11
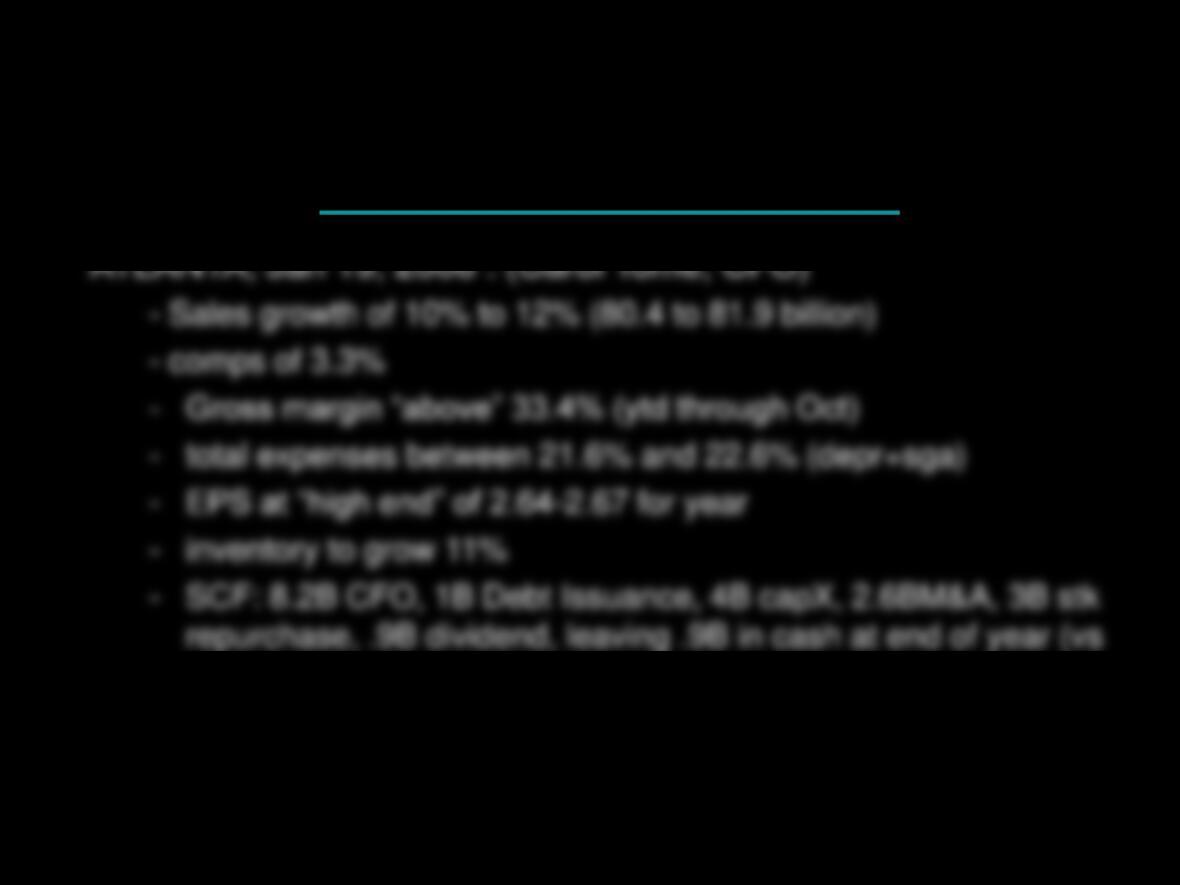
What did you learn from “The Home Depot
Investor and Analyst Conference” held on
January 13, 2005 ?
http://ir.homedepot.com/releases.cfm
2.2 in 2004)
12
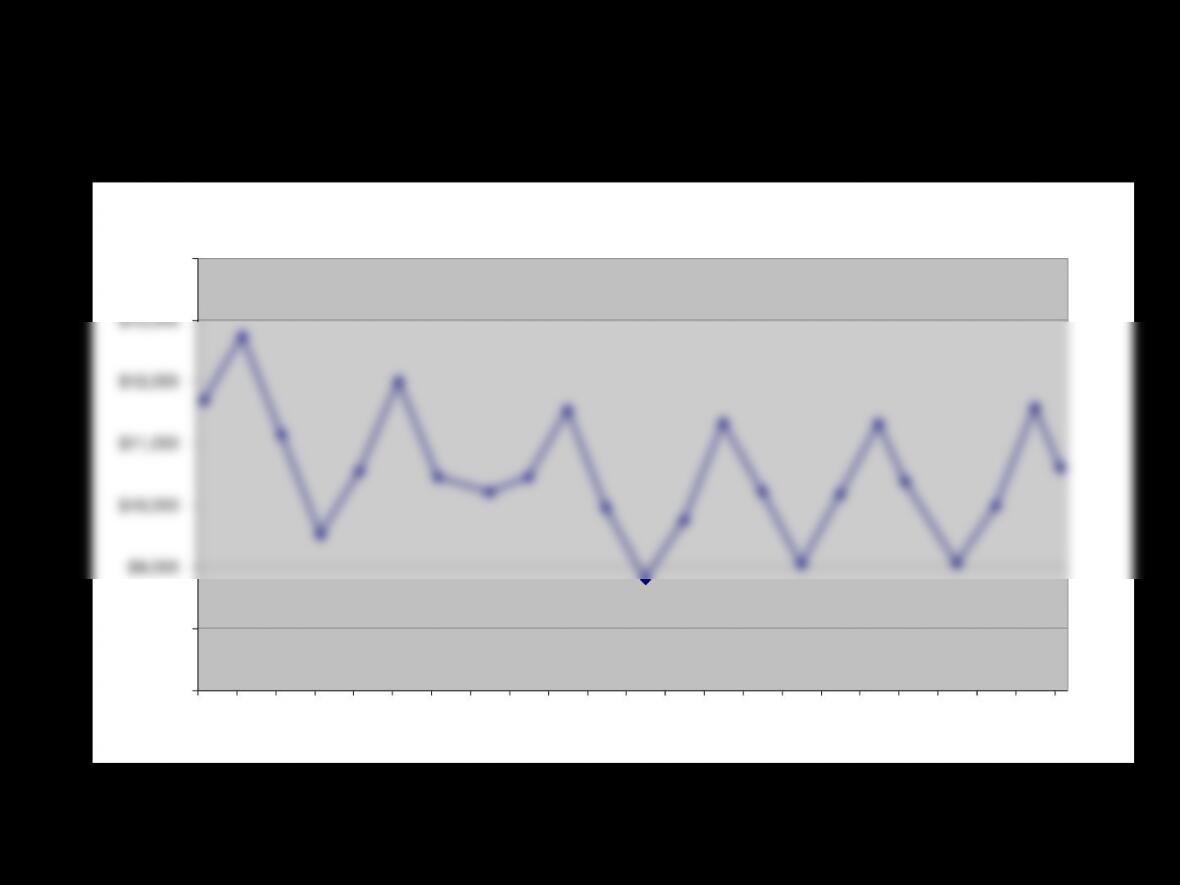
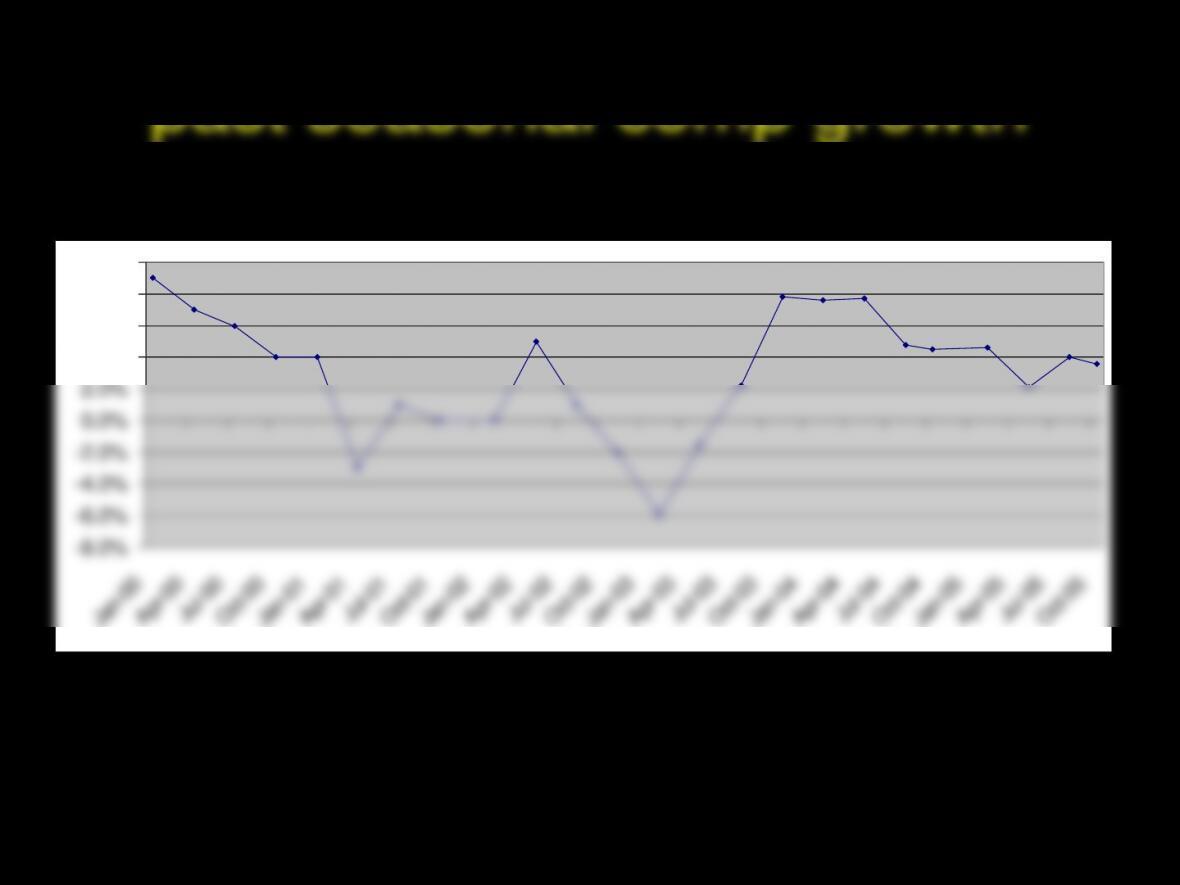
Seasonal Sales Effects
HD Quarterly Sales Per Store
Sales/average number of stores
$7,000
$8,000
$9,000
$10,000
$11,000
$12,000
$13,000
$14,000
Apr-00
Jul–00
Oct-00
Jan-01
Apr-01
Jul–01
Oct-01
Jan-02
Apr-02
Jul–02
Oct-02
Jan-03
Apr-03
Jul–03
Oct-03
Jan-04
Apr-04
Jul–04
Oct-04
Jan-05
Apr-05
Jul–05
Oct-05
13
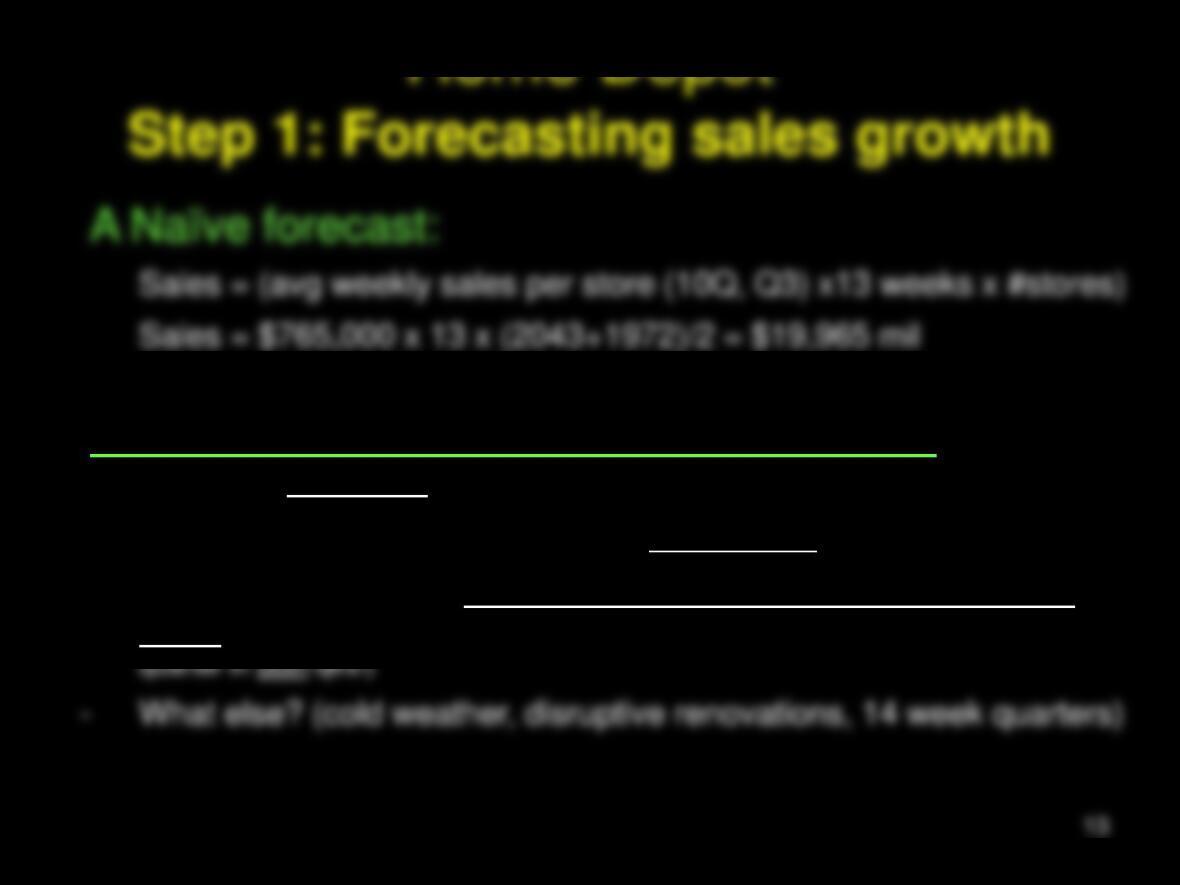
Home Depot
Step 1: Forecasting sales growth
A Naïve forecast:
Sales = (avg weekly sales per store (10Q, Q3) x13 weeks x #stores)
Sales = $765,000 x 13 x (2043+1972)/2 = $19,965 mil
However, there are other relevant factors:
– Sales are seasonal!
– HD is growing, so need to factor in new stores.
– Separate between (1) same-store or comp sales growth, (2) new
store sales growth (Same stores are those that were in operation for the entire
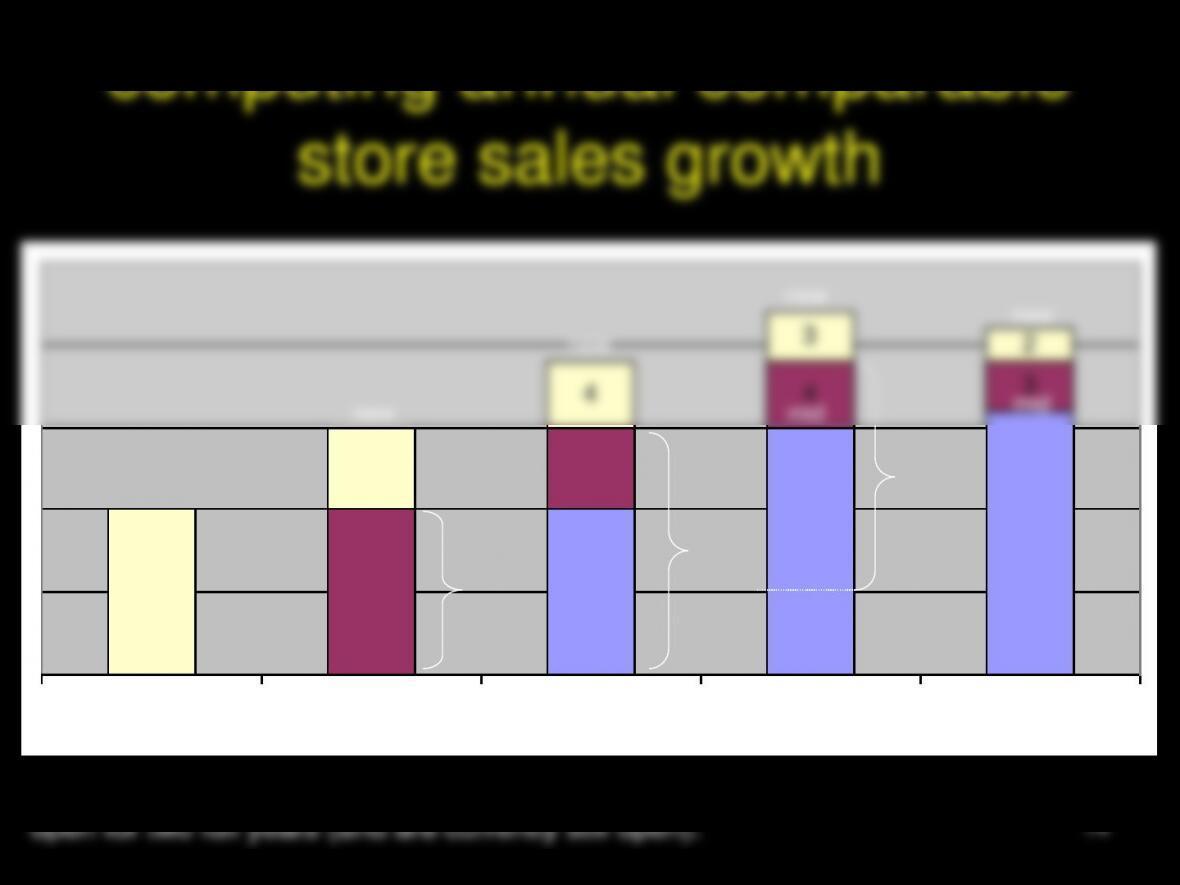
computing annual comparable
store sales growth
10
15
16
10
5
4
4
10
5
1 2 3 4 5
close 3
new
new
mid
mid
old
old old
Comparable store sales growth is the growth in sales from stores that have been
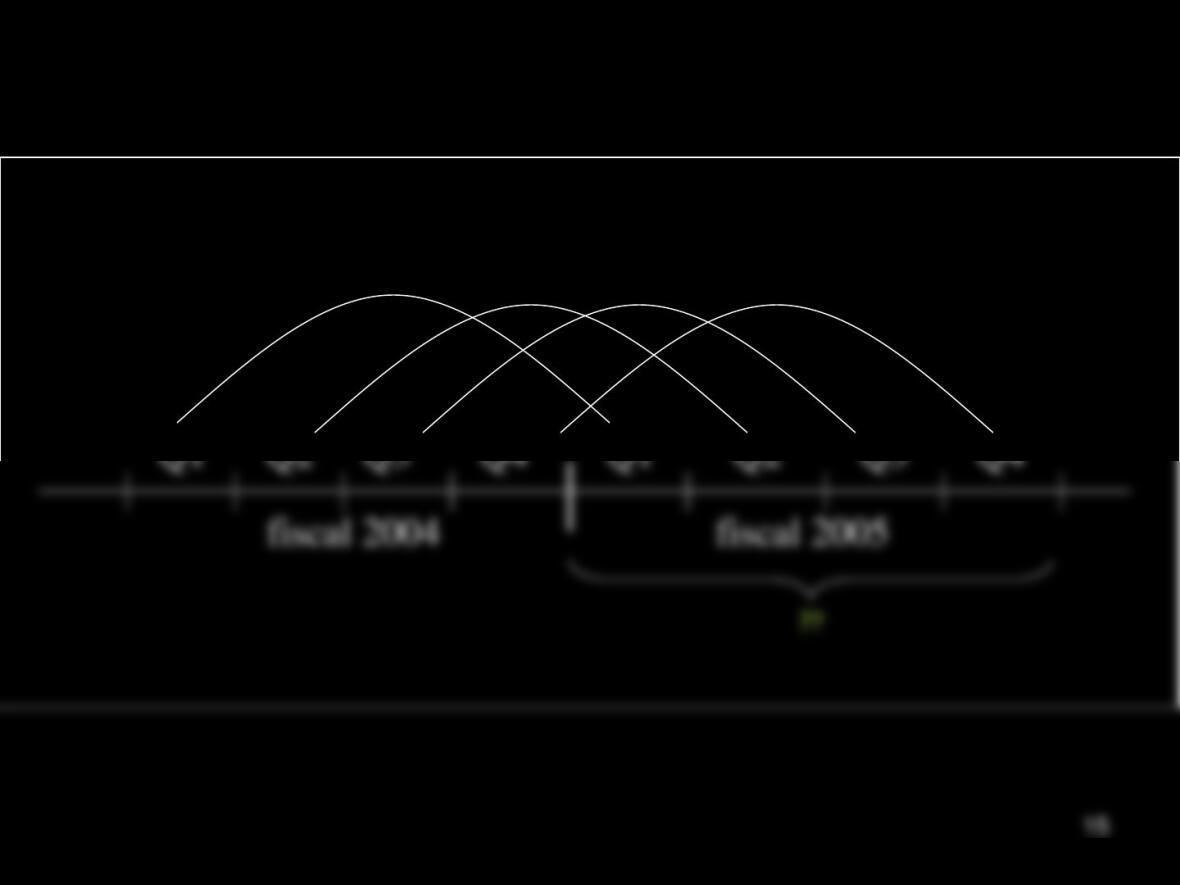
Computing Quarterly
Comparable Store Sales
2.1 4.0 3.6 3.3
16
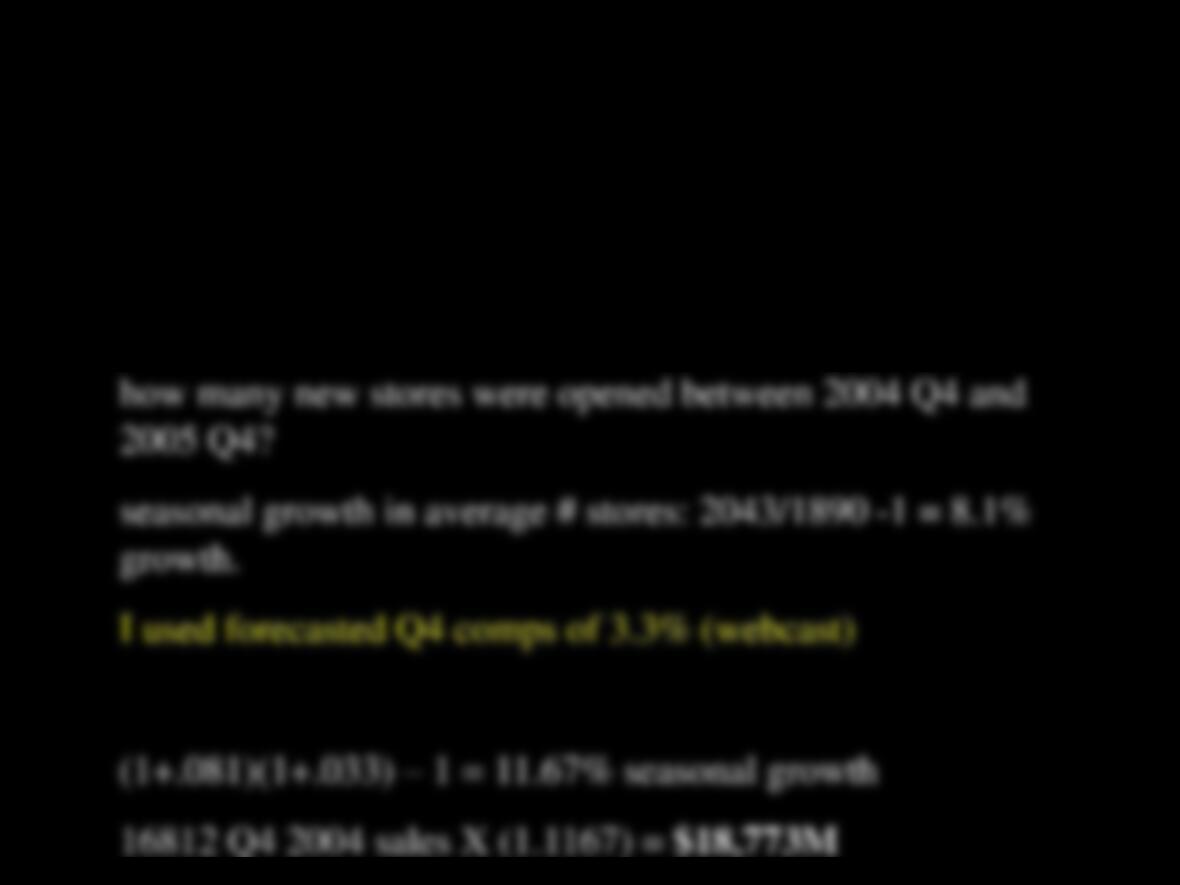
Use Seasonal variation on simple %’s model:
Sales Growth %
= (1+growth % in stores)(1+ comp growth) -1
Sales Estimate –option 2
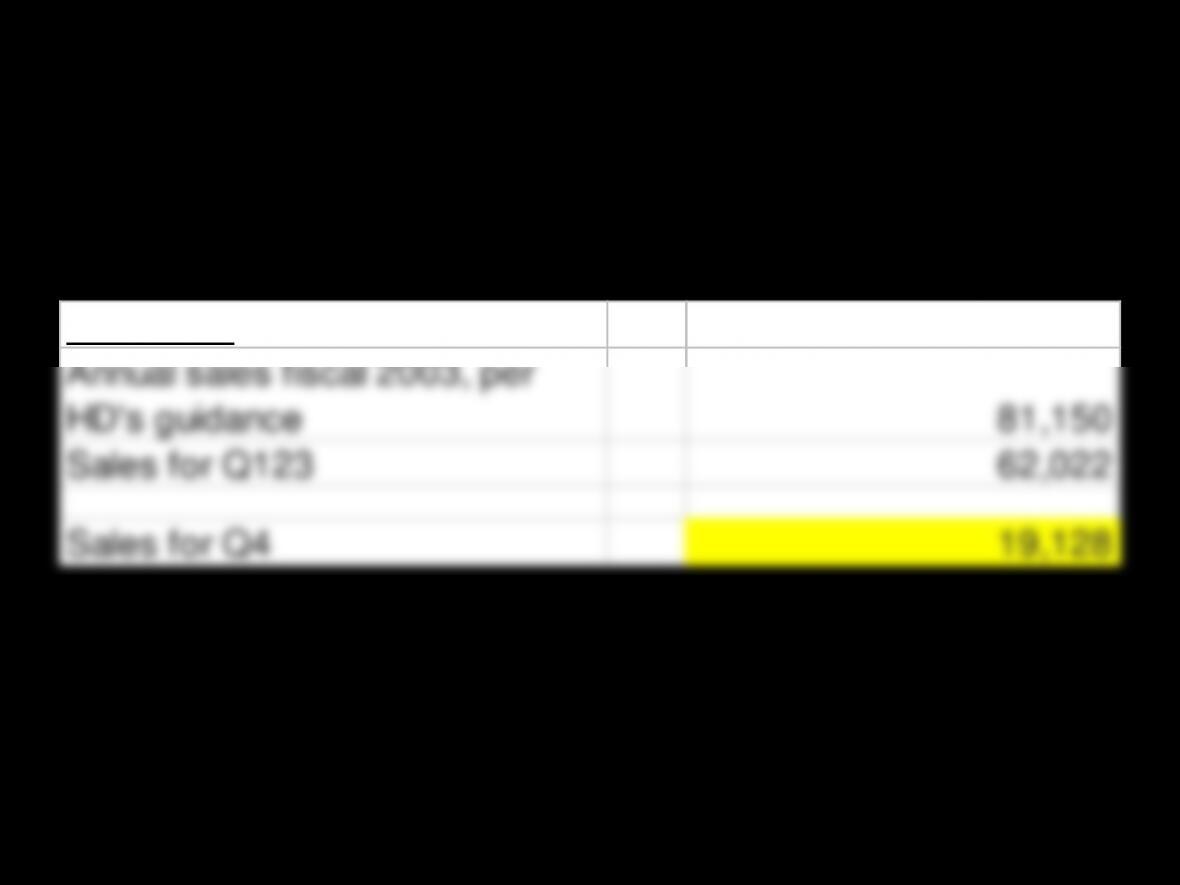
Sales Estimate –Option 3
(trust management forecast)
Options 3:
Annual sales fiscal 2003, per
HD’s guidance
81,150
Sales for Q123 62,022
Sales for Q4 19,128