Unlock document.
This document is partially blurred.
Unlock all pages and 1 million more documents.
Get Access
1
Financial Statement Analysis
Forecasting Home Depot’s
fourth quarter of 2005
financial statements
super freak
2
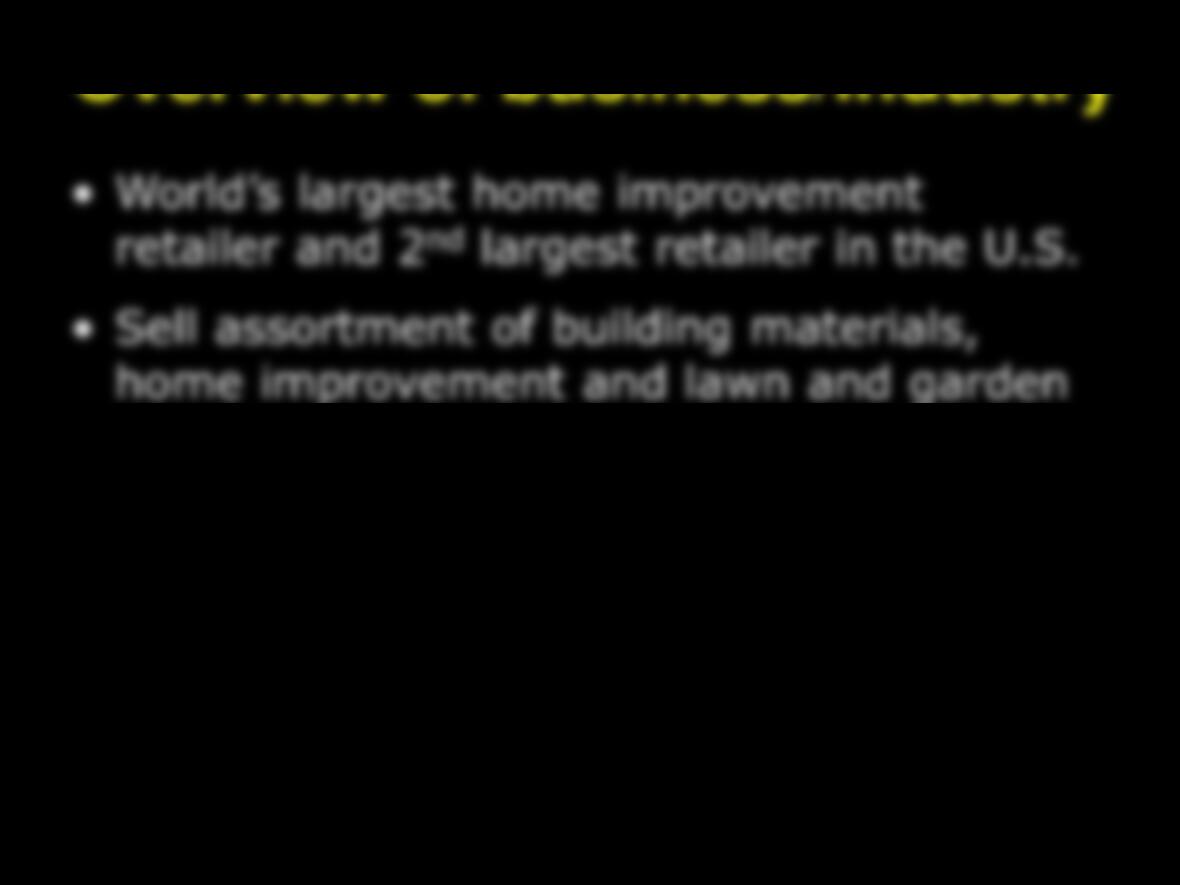
products as well as other services.
•Target individual homeowners, small
contractors, and moving into commercial
and industrial customers.
3
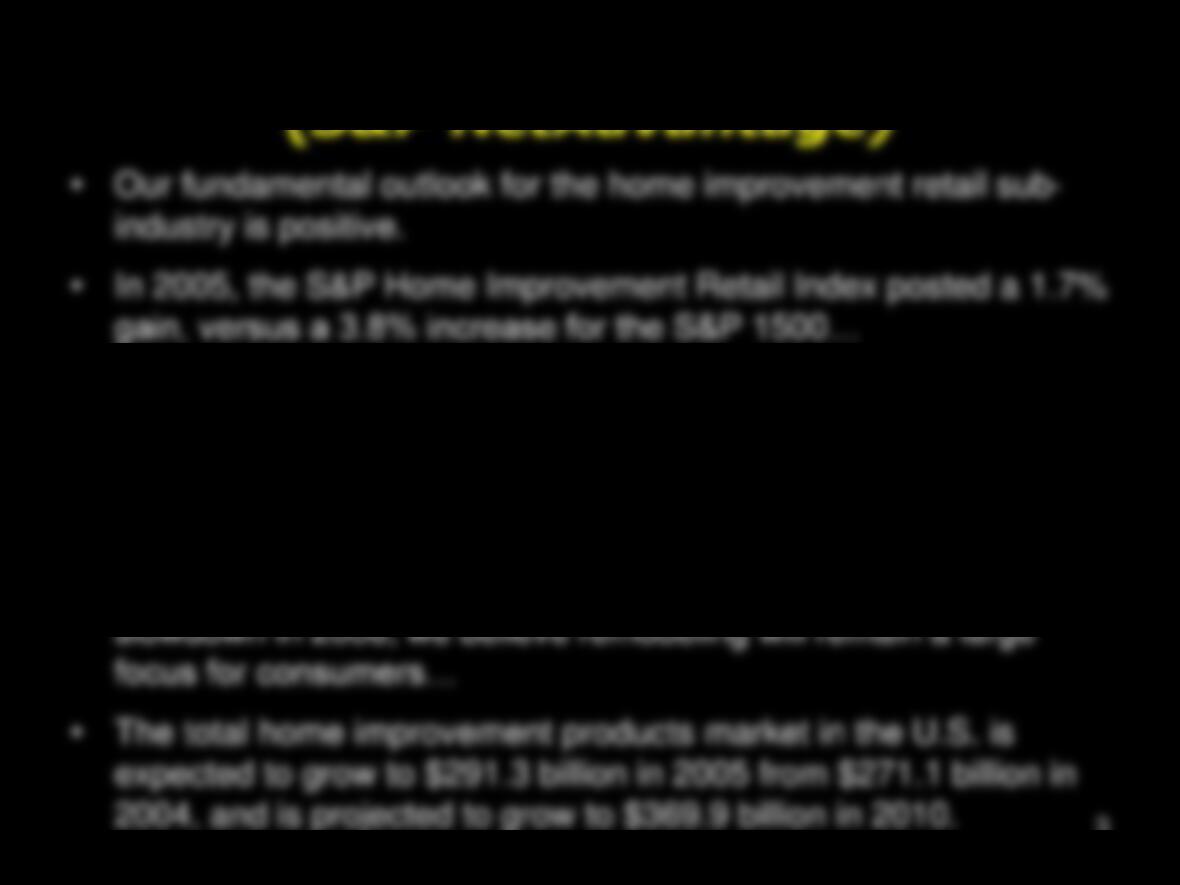
Industry Outlook
•We expect home improvement retailers to report strong fourth-
quarter results…
•The rebuilding efforts from Hurricane Katrina bode well for home
improvement retailers
• …In addition, should the housing market face a significant

4
Business Strategy
Key Success Factors
•Warehouse retailing concept
- Low overhead
- High turnover
•Several brands (e.g., Expo and HD Supply Company).
•Offer expanded services.

Business Strategy
Key Risks
• Competition (Lowe’s)!
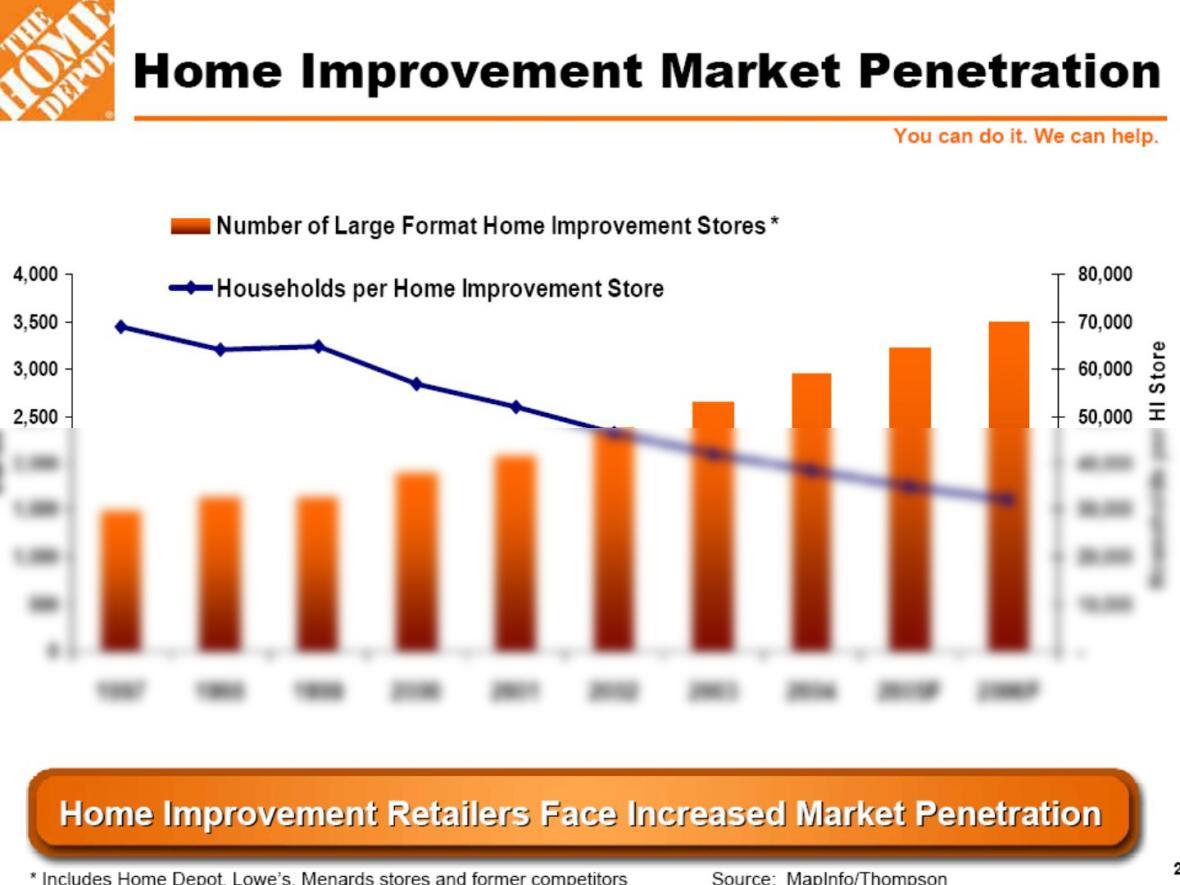
•Reaching end of growth opportunities.
•Strategy conflict (cost leader with high level of service).
•Capital constraints.
•Burst of the housing market bubble (interest rates have been
increasing, consumers spending on home improvements are declining…).
6
7
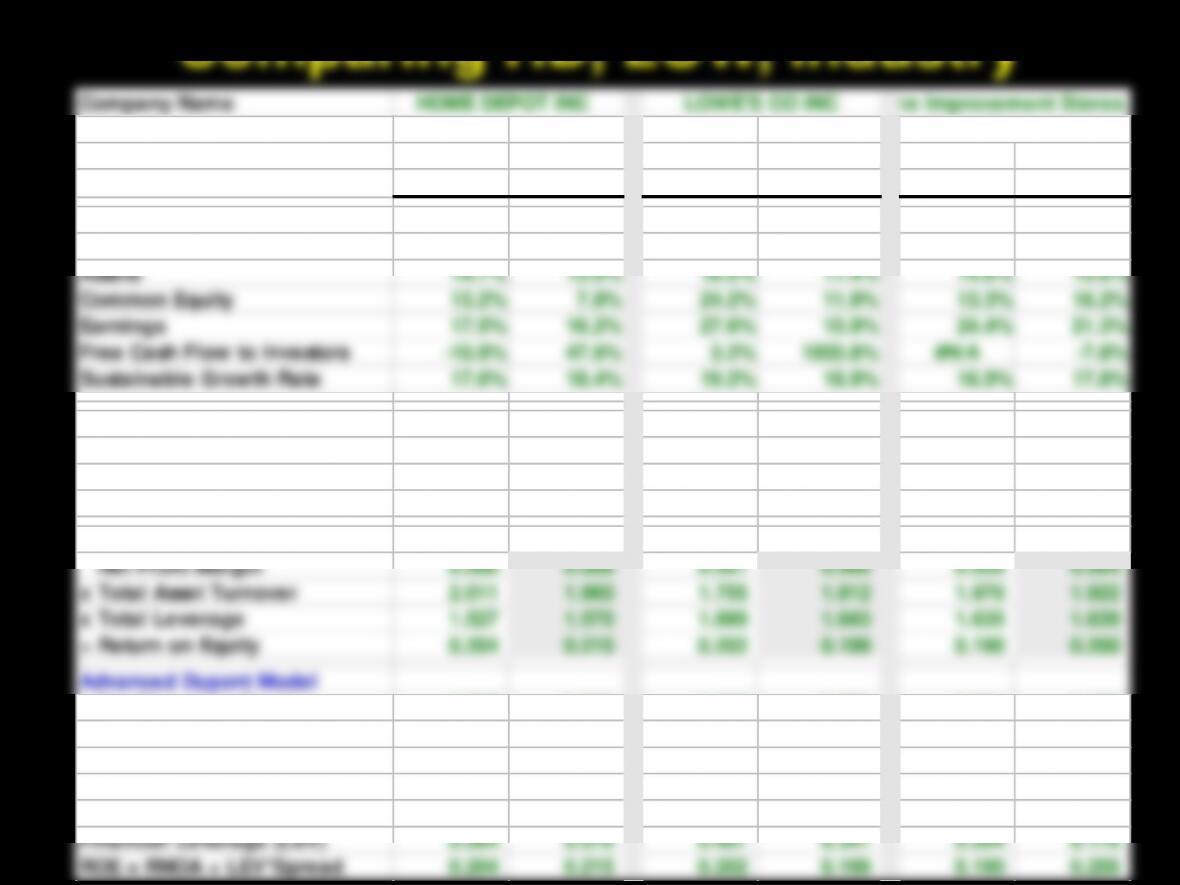
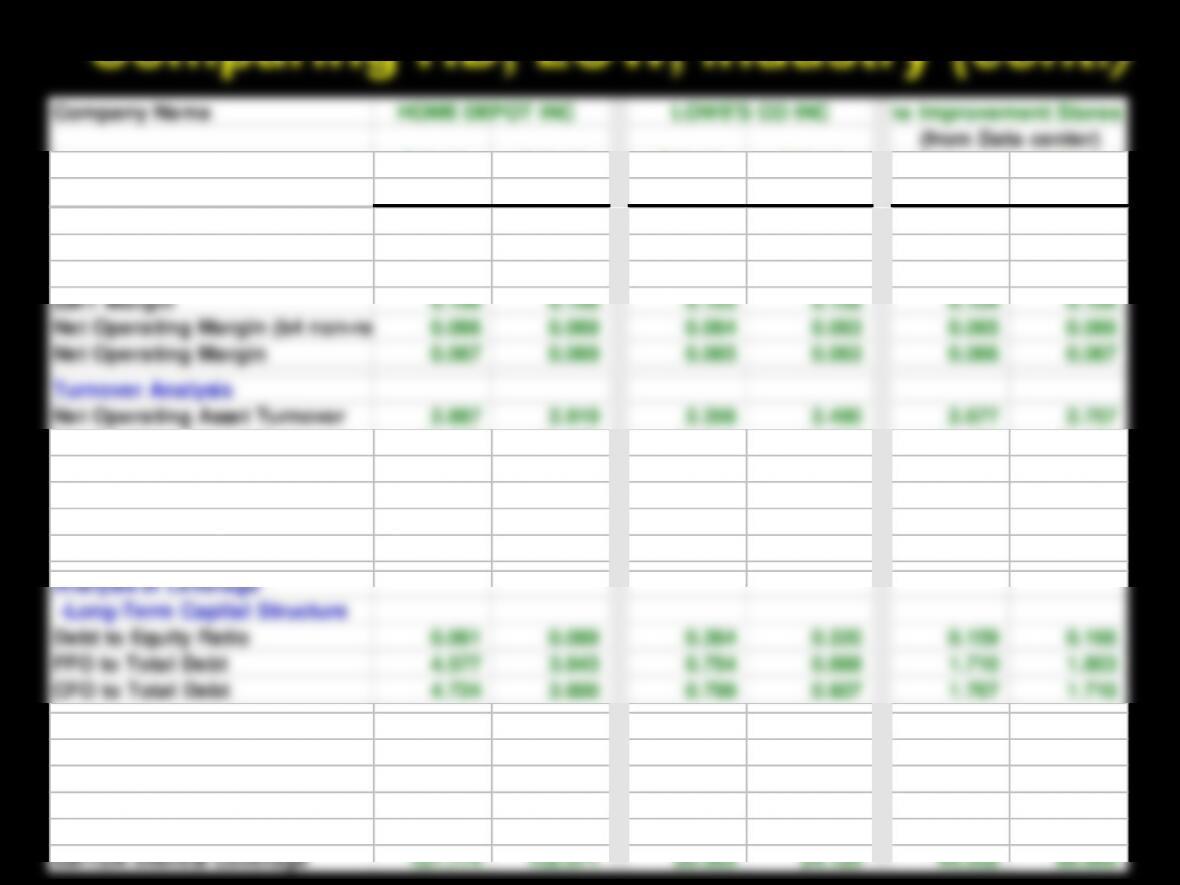
Actual Actual Actual Actual Actual Actual
Fiscal Year End Date 1/31/2004 1/31/2005 1/31/2004 1/31/2005 1/31/2004 1/31/2005
Annual Growth Rates
Sales 11.3% 12.8% 16.4% 18.2% 11.7% 12.3%
Profitability
Return on Equity 0.204 0.215 0.202 0.199 0.190 0.200
Return on Equity (b4 non-recurring
0.202 0.213 0.199 0.198 0.189 0.197
Return on Net Operating Assets 0.193 0.201 0.153 0.157 0.163 0.175
Basic Dupont Model
Net Operating Margin 0.067 0.069 0.065 0.063 0.061 0.065
x Net Operating Asset Turnover 2.887 2.919 2.356 2.490 2.677 2.680
= Return on Net Operating Assets
0.193 0.201 0.153 0.157 0.163 0.175
Net Borrowing Cost (NBC) 0.029 0.025 0.032 0.032 0.031 0.033
Spread (RNOA - NBC) 0.164 0.176 0.121 0.125 0.132 0.142
(from Data center)
8
Margin Analysis
Gross Margin 0.334 0.352 0.312 0.338 0.327 0.347
EBITDA Margin 0.122 0.126 0.128 0.127 0.123 0.126
EBIT Margin 0.106 0.108 0.103 0.102 0.104 0.106
Net Working Capital Turnover 15.877 18.377 13.813 17.035 14.192 16.498
Avge Days to Collect Receivable
6.107 6.482 1.793 0.701 5.648 5.623
Avge Inventory Holding Period 73.634 73.825 73.592 79.857 73.798 75.680
Avge Days to Pay Payables 41.811 43.021 38.189 40.537 40.410 41.889
PP&E Turnover 3.482 3.416 2.766 2.821 3.261 3.258
Analysis of Leverage
Analysis of Leverage
- Short-Term Liquidity
Current Ratio 1.395 1.348 1.531 1.219 1.476 1.347
Quick Ratio 0.413 0.348 0.402 0.144 0.433 0.303
EBIT Interest Coverage 110.419 113.229 16.297 19.333 37.527 42.626
EBITDA Interest Coverage 127.774 132.071 20.303 24.125 44.532 50.800
Company Name
Actual Actual Actual Actual Actual Actual
Fiscal Year End Date 1/31/2004 1/31/2005 1/31/2004 1/31/2005 1/31/2004 1/31/2005
HOME DEPOT INC
LOWE'S CO INC
me Improvement Stores
(from Data center)

9
What are your forecasted
Sales, Net Income and EPS?
Collect forecasts
Home Depot Q4 2005

10
What’s my forecast?
First, let’s get some relevant information from
Q3 2005 10Q (November 15, 2005)
•The Home Depot Announces Record
Third Quarter 2005 Results
Earnings of $1.5 billion - Record Average Ticket of $58.92
•Sales for the period increased $2.0 billion, or 10.5 percent, to
$20.7 billion. Growth in comparable store sales was 3.6
percent.


