ratio times (1+.9*(.158))/(1.158).
My Income Statement Forecast Assumptions
Actual Actual Actual Actual Actual Forecast Forecast Forecast
Fiscal Year End Date 12/31/1994 12/31/1995 12/31/1996 12/31/1997 12/31/1998 12/31/1999 12/31/2000 12/31/2001
Implied Return on Equity 0.165 0.147 0.119 0.154 0.116 0.127 0.095
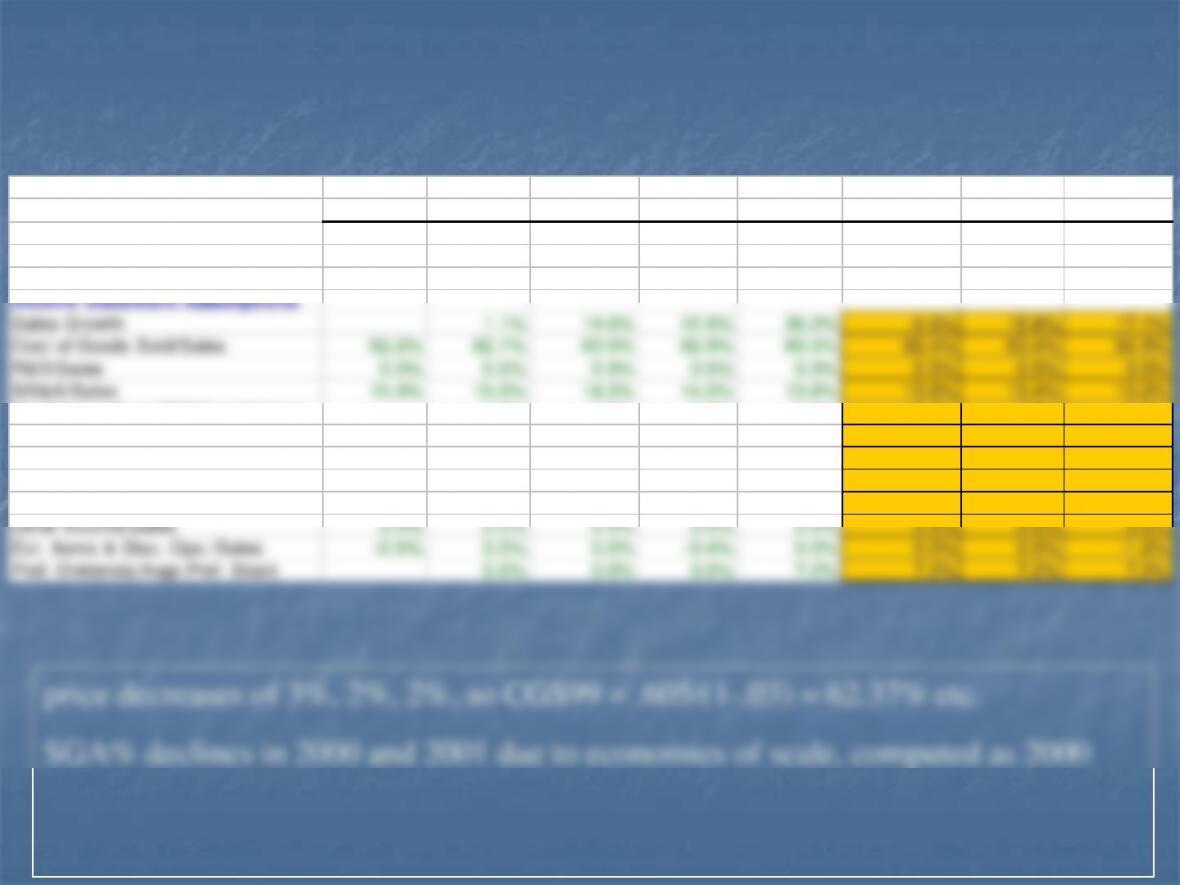
Income Statement Assumptions
Sales Growth 1.1% 14.6% 42.9% 36.0% –0.6% 15.8% 17.1%
Cost of Goods Sold/Sales 62.2% 62.7% 63.0% 62.9% 60.5% 62.4% 63.4% 64.9%
R&D/Sales 0.0% 0.0% 0.0% 0.0% 0.0% 0.0% 0.0% 0.0%
SG&A/Sales 15.3% 15.0% 14.3% 14.0% 13.6% 13.6% 13.4% 13.2%
Dep&Amort/Avge PP&E and Intang. 4.2% 3.8% 3.7% 3.7% 3.7% 3.7% 3.7%
Interest Expense/Avge Debt 6.5% 6.6% 6.5% 6.7% 6.7% 6.7% 6.7%
Non-Operating Income/Sales 0.0% 1.7% 0.8% 0.4% 0.4% 0.4% 0.4% 0.4%
Effective Tax Rate 0.0% 0.0% 0.0% 0.0% 0.0% 0.0% 0.0% 0.0%
Minority Interest/After Tax Income 0.0% 0.0% 0.0% 0.0% 0.0% 0.0% 0.0% 0.0%
Other Income/Sales 0.0% 0.0% 0.0% 0.0% 0.0% 0.0% 0.0% 0.0%
Ext. Items & Disc. Ops./Sales –0.5% 0.0% 0.0% –0.4% 0.0% 0.0% 0.0% –1.2%
Pref. Dividends/Avge Pref. Stock 0.0% 0.0% 0.0% 7.2% 7.2% 7.2% 7.2%
bad news forecast
capX amounts of 996M, 1196M and 1368M given in MD&A, as shown in SCF. Amortized Intangibles
Actual Actual Actual Actual Actual Forecast Forecast Forecast
Fiscal Year End Date 12/31/1994 12/31/1995 12/31/1996 12/31/1997 12/31/1998 12/31/1999 12/31/2000 12/31/2001
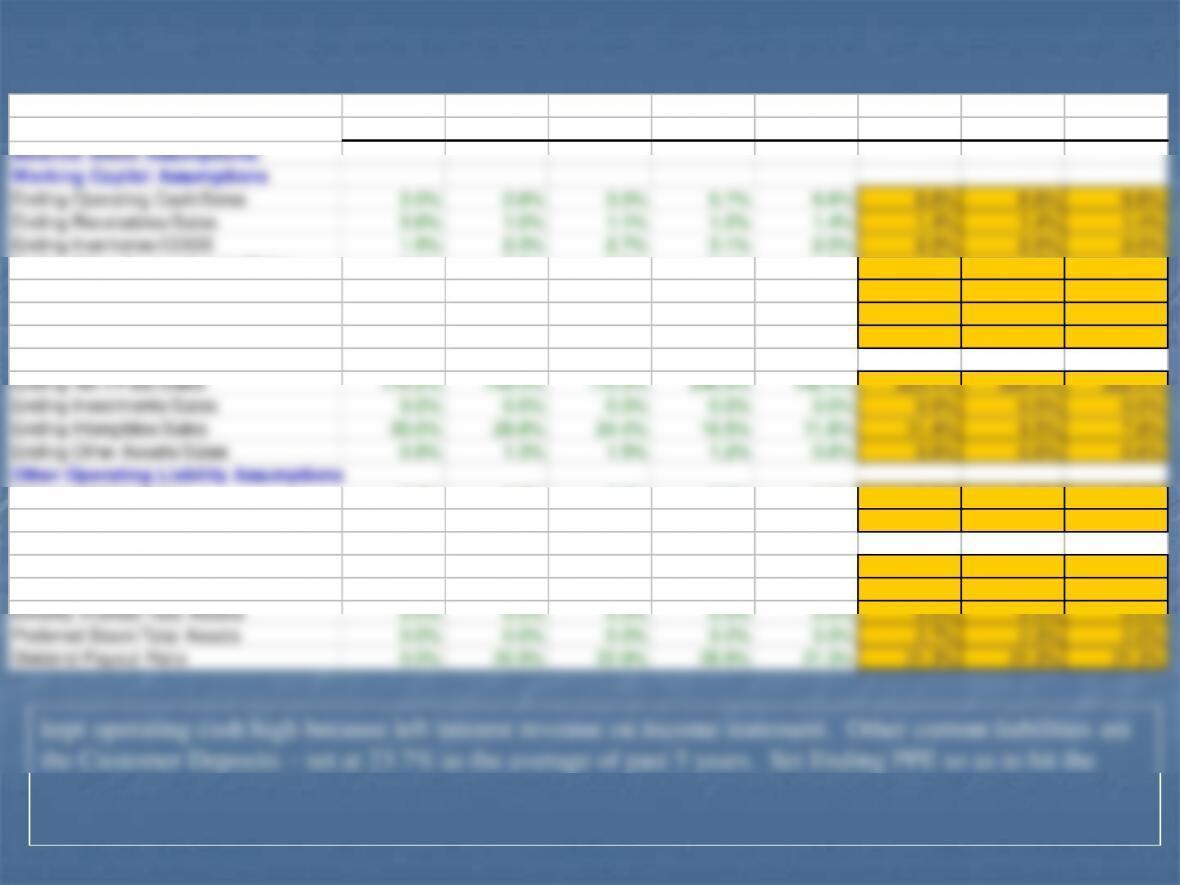
Balance Sheet Assumptions:
Working Capital Assumptions
Ending Operating Cash/Sales 2.0% 2.6% 3.0% 5.7% 6.6% 6.6% 6.6% 6.6%
Ending Receivables/Sales 0.8% 1.0% 1.1% 1.2% 1.4% 1.4% 1.4% 1.4%
Ending Inventories/COGS 1.9% 2.3% 2.7% 3.1% 2.0% 2.0% 2.0% 2.0%
Ending Other Current Assets/Sales 6.1% 2.3% 2.5% 2.1% 1.7% 1.7% 1.7% 1.7%
Ending Accounts Payable/COGS 8.7% 9.6% 8.1% 8.9% 7.3% 7.3% 7.3% 7.3%
Ending Taxes Payable/Sales 0.0% 0.0% 0.0% 0.0% 0.0% 0.0% 0.0% 0.0%
Ending Other Current Liabs/Sales 17.8% 19.5% 23.7% 33.0% 24.5% 23.7% 23.7% 23.7%
Other Operating Asset Assumptions
Other Operating Liability Assumptions
Other Liabilities/Sales 0.0% 0.0% 0.0% 0.0% 0.0% 0.0% 0.0% 0.0%
Deferred Taxes/Sales 0.0% 0.0% 0.0% 0.0% 0.0% 0.0% 0.0% 0.0%
Financing Assumptions
Current Debt/Total Assets 0.0% 0.3% 0.5% 2.6% 2.2% 2.2% 2.2% 2.2%
Long-Term Debt/Total Assets 40.1% 42.2% 47.6% 45.5% 41.2% 41.2% 41.2% 41.2%
My Balance Sheet Forecasts
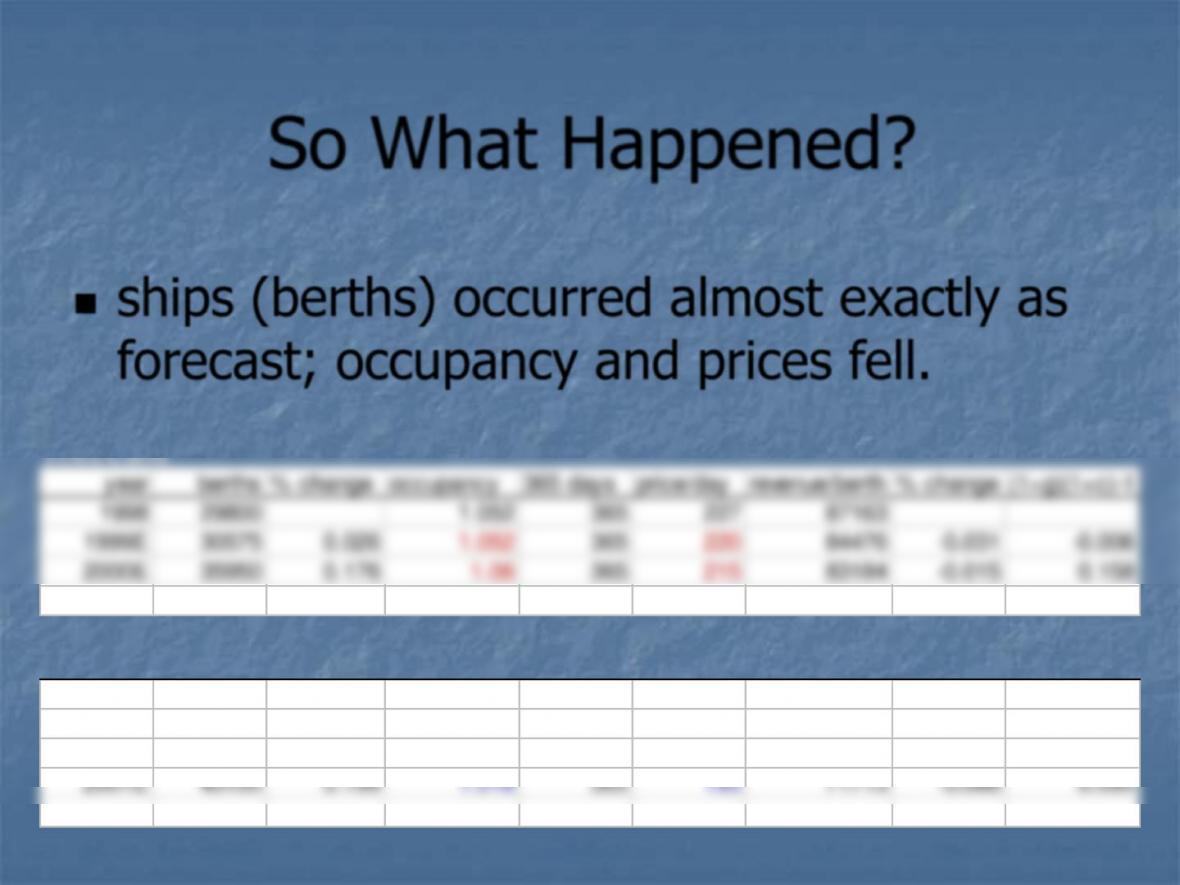
So What Happened?
◼ships (berths) occurred almost exactly as
forecast; occupancy and prices fell.
year berths % change occupancy 365 days price/day revenue/berth % change (1+g)(1+c)–1
1998 29800 1.052 365 227 87163
1999E 30575 0.026 1.052 365 220 84476 –0.031 –0.006
2000E 35950 0.176 1.06 365 215 83184 –0.015 0.158
2001E 43100 0.199 1.06 365 210 81249 –0.023 0.171
1998 29800 1.052 365 227 87163
1999E 30575 0.026 1.047 365 215 82163 –0.057 –0.033
forecast
actual
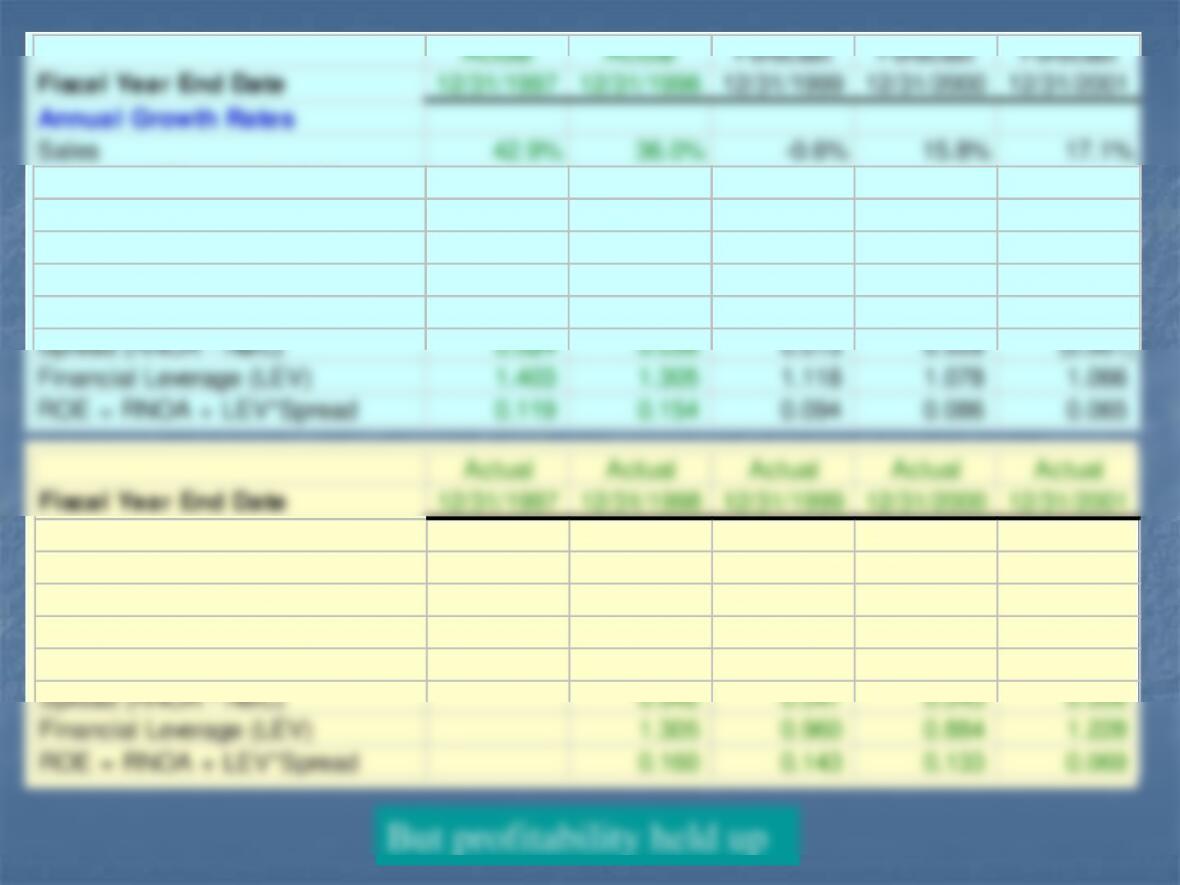
Actual Actual Forecast Forecast Forecast
Fiscal Year End Date 12/31/1997 12/31/1998 12/31/1999 12/31/2000 12/31/2001
Annual Growth Rates
Sales 42.9% 36.0% –0.6% 15.8% 17.1%
Advanced Dupont Model
Net Operating Margin 0.157 0.189 0.162 0.154 0.131
x Net Operating Asset Turnover 0.551 0.554 0.493 0.493 0.502
= Return on Net Operating Assets 0.086 0.105 0.080 0.076 0.066
Net Borrowing Cost (NBC) 0.063 0.067 0.067 0.067 0.067
Spread (RNOA – NBC) 0.024 0.038 0.013 0.009 (0.001)
Financial Leverage (LEV) 1.403 1.305 1.118 1.078 1.066
ROE = RNOA + LEV*Spread 0.119 0.154 0.094 0.086 0.065
Actual Actual Actual Actual Actual
Fiscal Year End Date 12/31/1997 12/31/1998 12/31/1999 12/31/2000 12/31/2001
= Return on Net Operating Assets 0.105 0.098 0.095 0.062
Net Borrowing Cost (NBC) 0.062 0.051 0.052 0.056
Spread (RNOA – NBC) 0.042 0.047 0.043 0.006
Financial Leverage (LEV) 1.305 0.960 0.884 1.228
ROE = RNOA + LEV*Spread 0.160 0.143 0.133 0.069
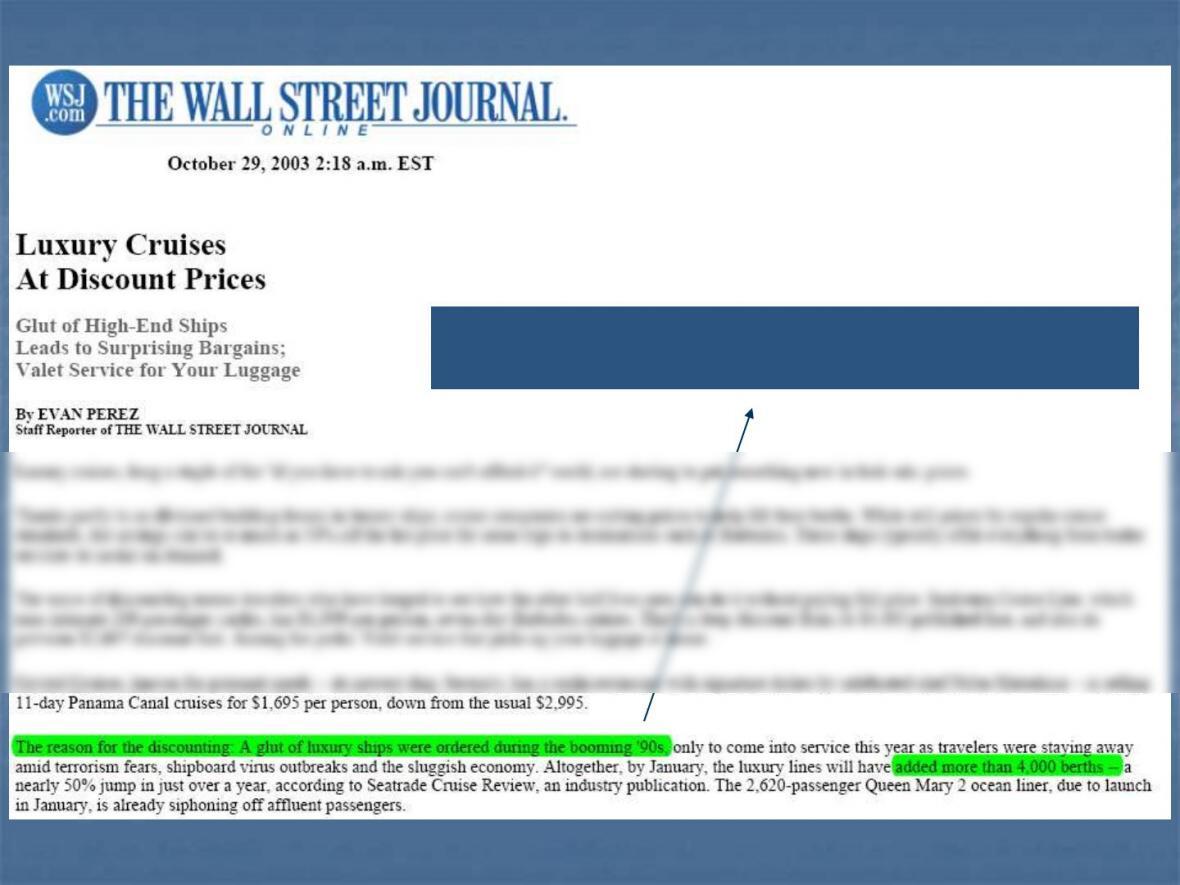
“The reason for the discounting: A glut of luxury
ships were ordered during the booming ’90s.”
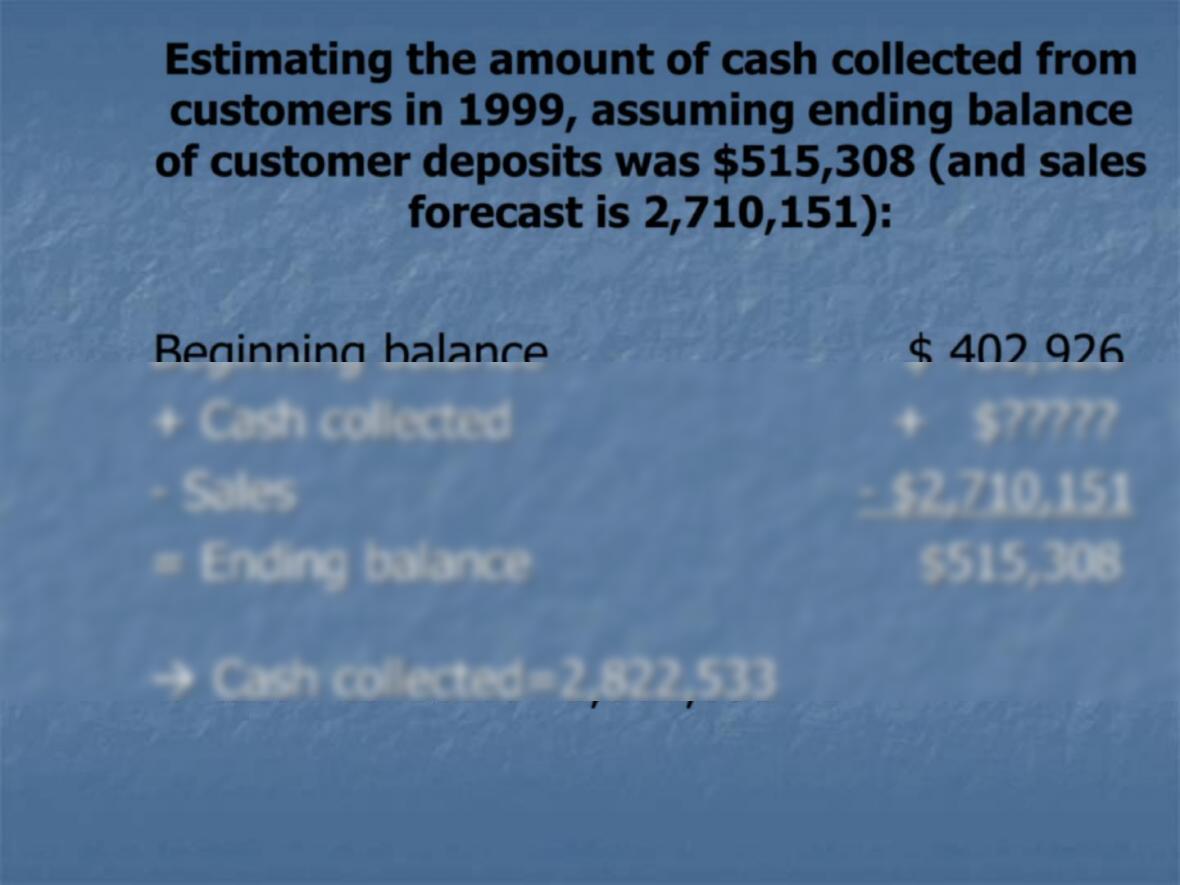
Estimating the amount of cash collected from
customers in 1999, assuming ending balance
of customer deposits was $515,308 (and sales
forecast is 2,710,151):
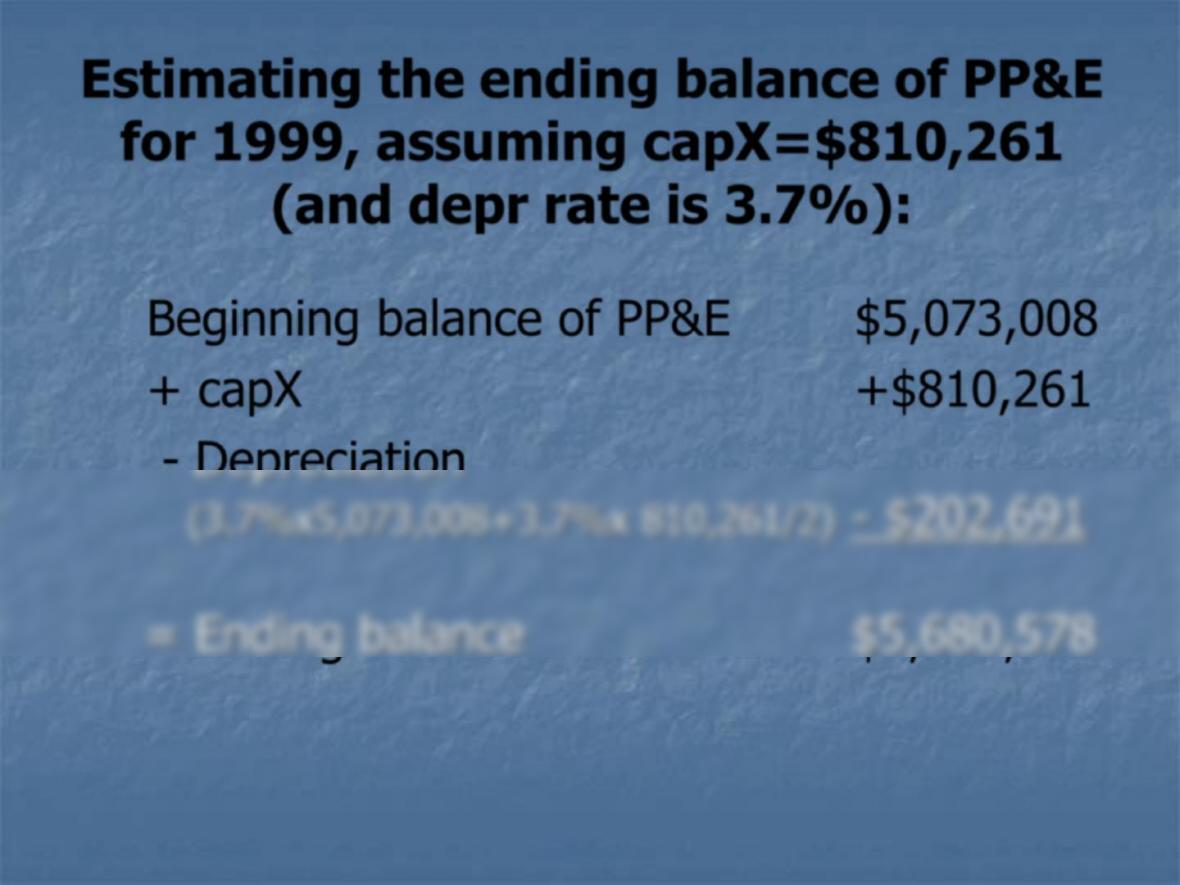
Estimating the ending balance of PP&E
for 1999, assuming capX=$810,261
(and depr rate is 3.7%):
Beginning balance of PP&E $5,073,008
+ capX +$810,261