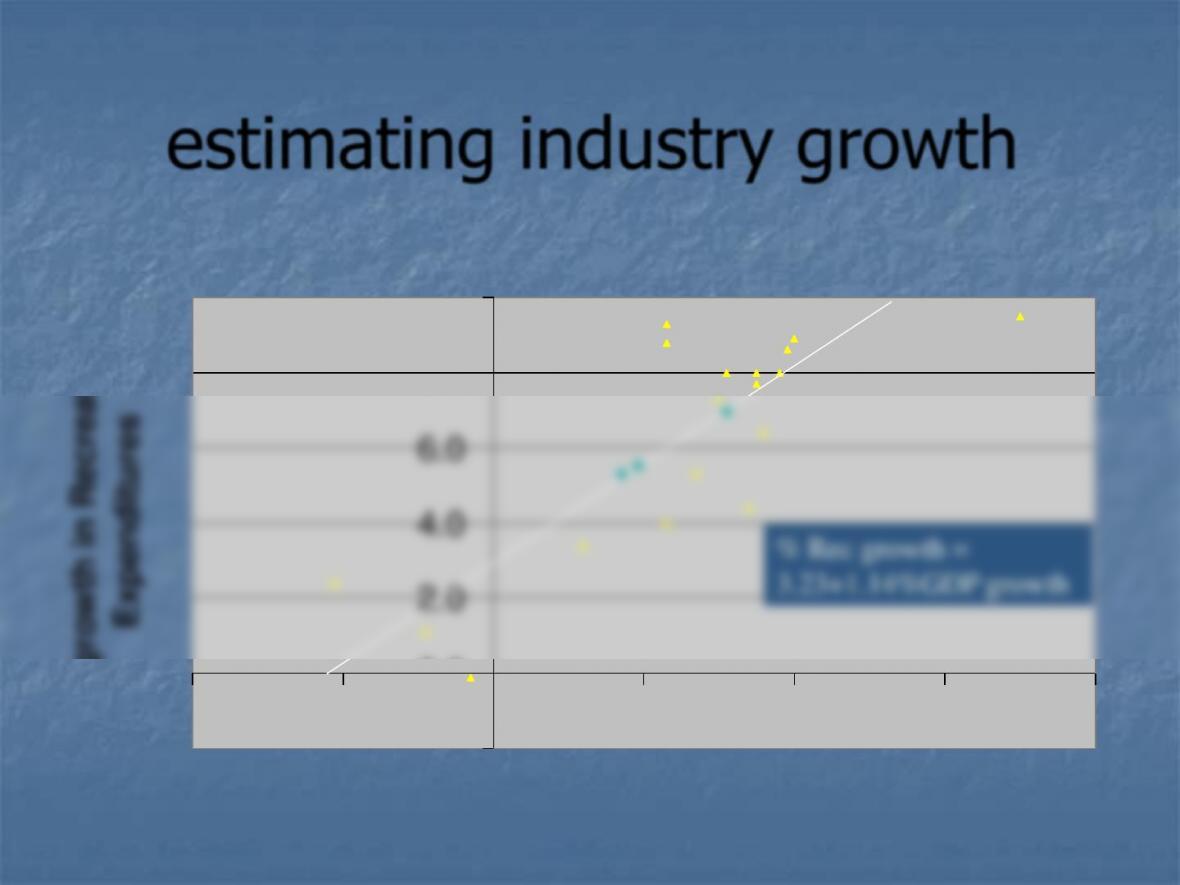
estimating industry growth
-2.0
0.0
2.0
4.0
6.0
8.0
10.0
-4.0 -2.0 0.0 2.0 4.0 6.0 8.0
% growth in GDP
% growth in Recreation
Expenditures
% Rec growth =
3.23+1.14%GDP growth
-5.0
0.0
5.0
10.0
15.0
20.0
25.0
1980
1981
1982
1983
1984
1985
1986
1987
1988
1989
1990
1991
1992
1993
1994
1995
1996
1997
1998E
1999E
2000E
2001E
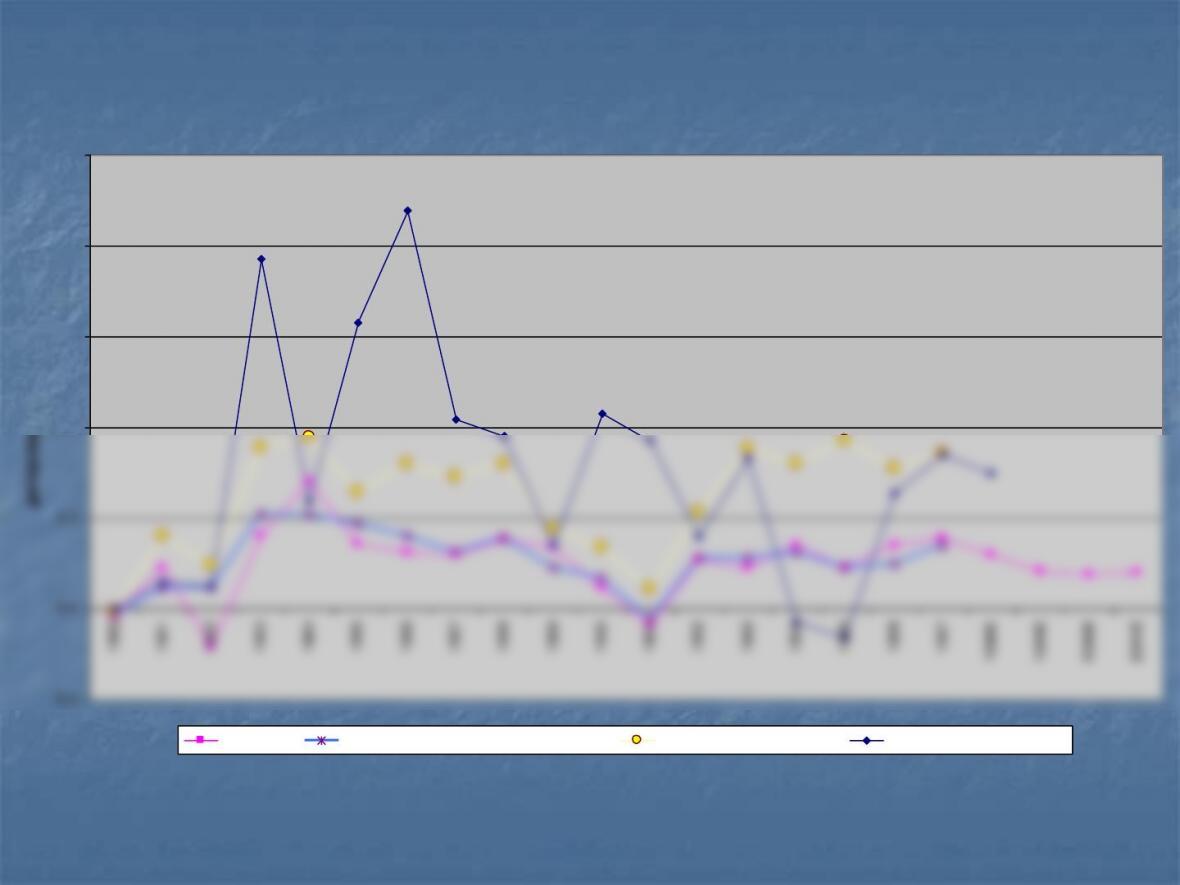
percentage growth
Real GDP Personal Consumption Expenditures Recreation Expenditures % growth in passengers
the trouble is…
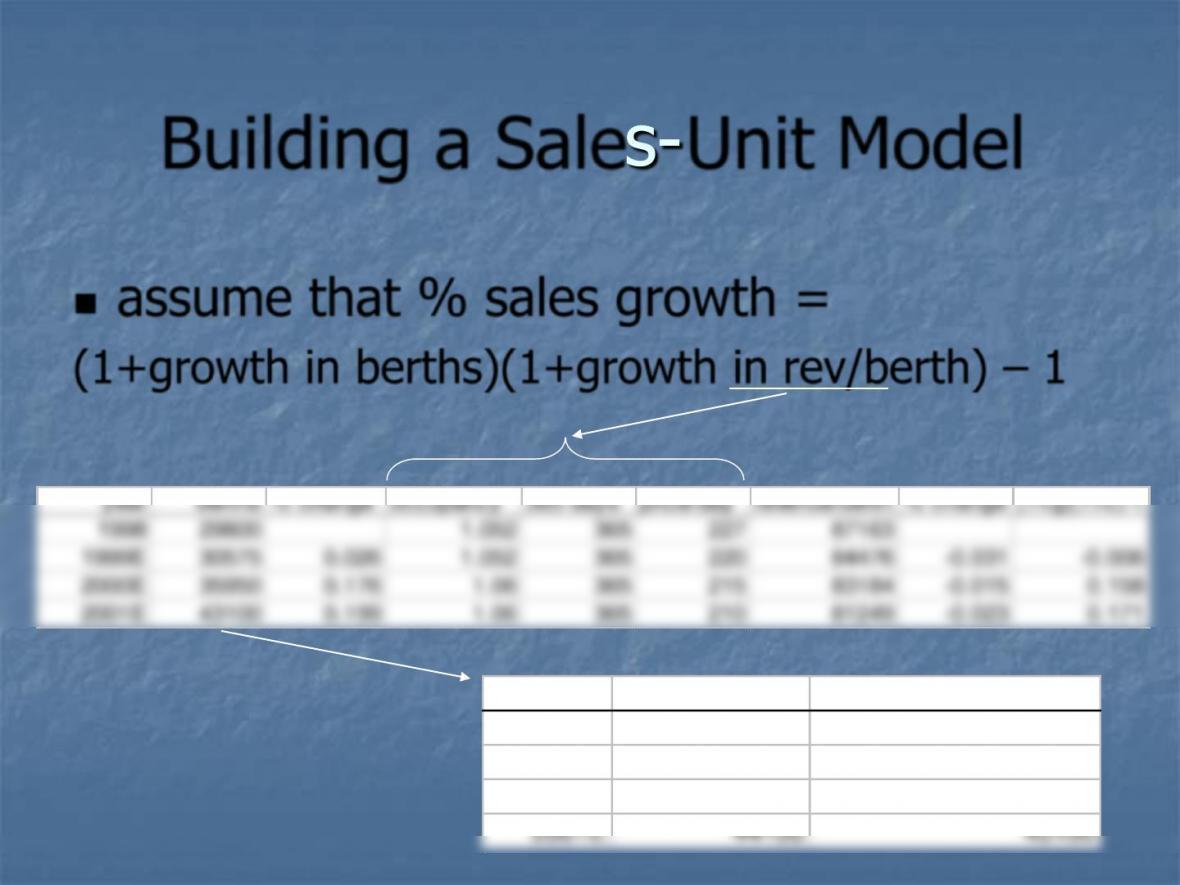
Building a Sales–Unit Model
◼assume that % sales growth =
(1+growth in berths)(1+growth in rev/berth) –1
year berths % change occupancy 365 days price/day revenue/berth % change (1+g)(1+c)–1
1998 29800 1.052 365 227 87163
1999E 30575 0.026 1.052 365 220 84476 -0.031 –0.006
2000E 35950 0.176 1.06 365 215 83184 -0.015 0.158
2001E 43100 0.199 1.06 365 210 81249 -0.023 0.171
berth forecasts from RCL
year berths at yr end weighted average berths
1998 29800

Radiance of the Seas…………………………….. 1st Quarter 2001 2,100
Brilliance of the Seas…………………………… 2nd Quarter 2002 2,100
CELEBRITY CRUISES:
Millennium–class
Millennium……………………………………… 2nd Quarter 2000 2,000
Unnamed………………………………………… 1st Quarter 2001 2,000
Unnamed………………………………………… 3rd Quarter 2001 2,000
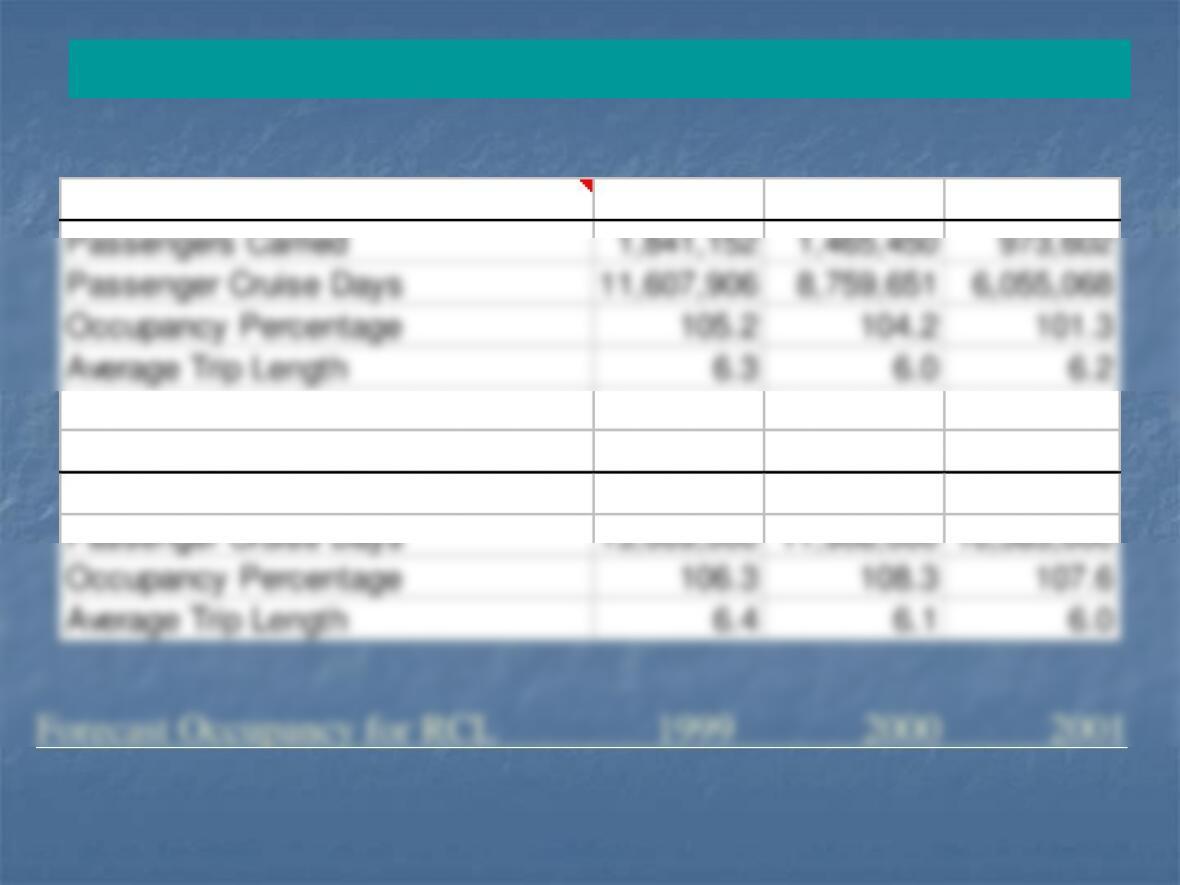
Royal Caribbean Cruises 1998 1997 1996
Passengers Carried 1,841,152 1,465,450 973,602
Passenger Cruise Days 11,607,906 8,759,651 6,055,068
Occupancy Percentage 105.2 104.2 101.3
Average Trip Length 6.3 6.0 6.2
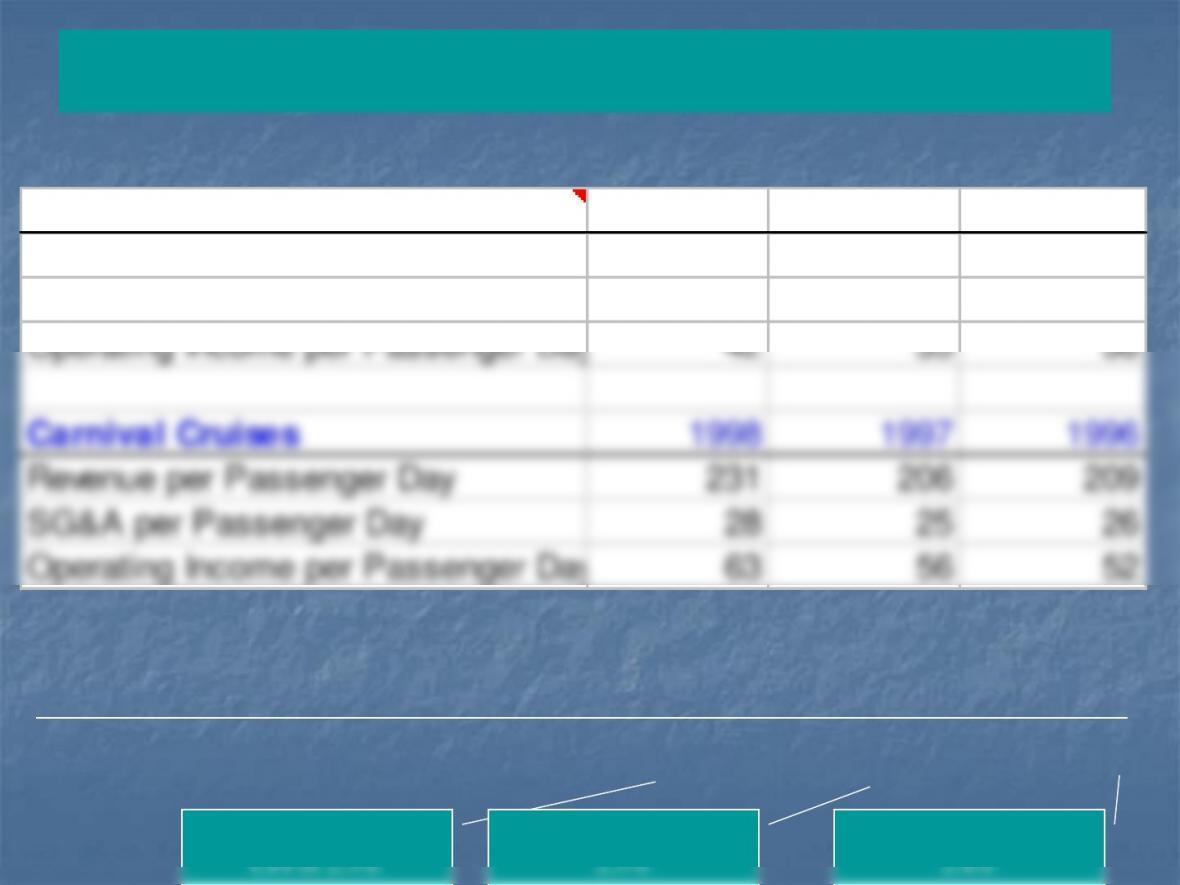
Carnival Cruises 1998 1997 1996
Average Trip Length 6.4 6.1 6.0
Occupancy –How full is the boat?
Royal Caribbean Cruises 1998 1997 1996
Revenue per Passenger Day 227 221 224
SG&A per Passenger Day 31 31 32
Operating Income per Passenger Day
42 35 36
Carnival Cruises 1998 1997 1996
Revenue per Passenger Day 231 206 209
SG&A per Passenger Day 28 25 26
Operating Income per Passenger Day
63 56 52
Margins and Pricing
Forecast for RCL 1999 2000 2001
236 242 248
CCL price of 231 +
increase by CPI of
increase of CPI of
bad news forecast 220 215 210
good news forecast
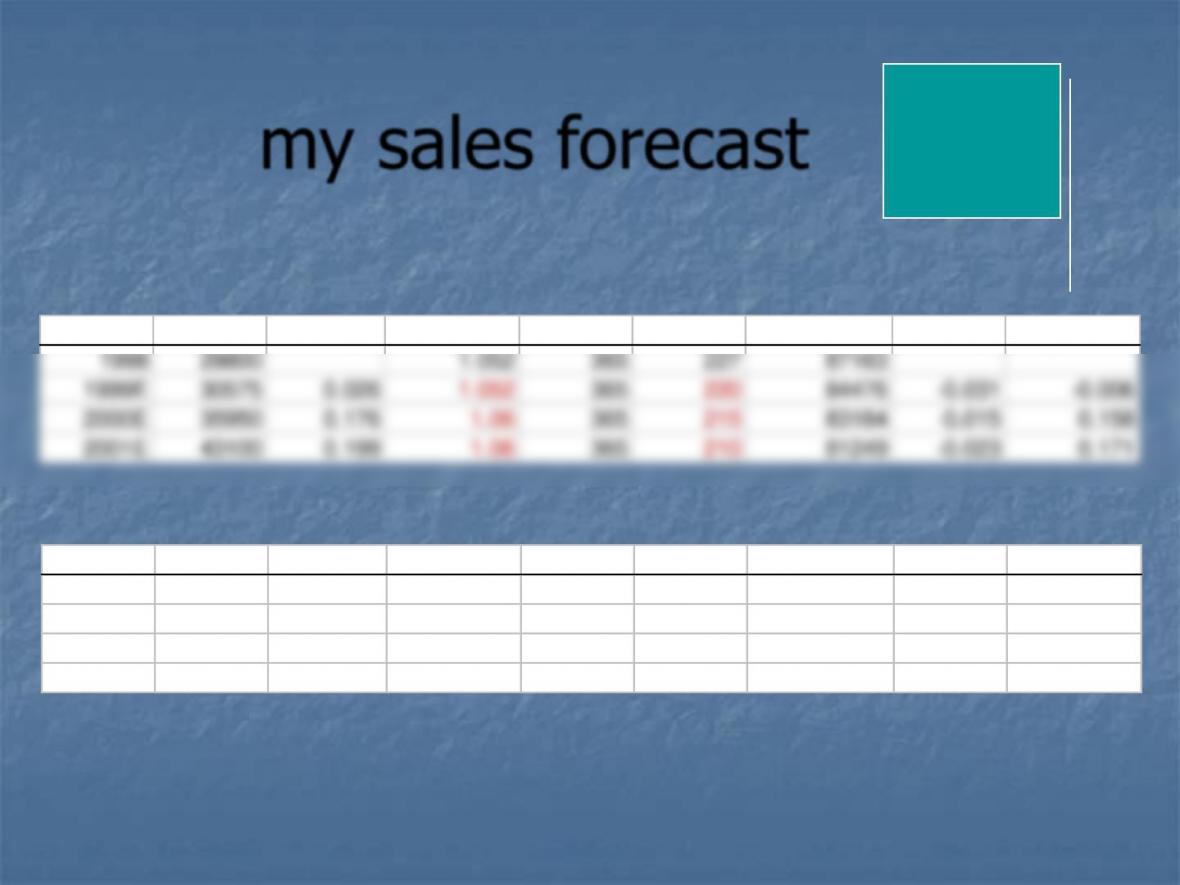
my sales forecast
year berths % change occupancy 365 days price/day revenue/berth % change (1+g)(1+c)-1
1998 29800 1.052 365 227 87163
1999E 30575 0.026 1.052 365 220 84476 –0.031 –0.006
2000E 35950 0.176 1.06 365 215 83184 –0.015 0.158
2001E 43100 0.199 1.06 365 210 81249 –0.023 0.171
year berths % change occupancy 365 days price/day revenue/berth % change (1+g)(1+c)-1
1998 29800 1.052 365 227 87163
1999E 30575 0.026 1.052 365 236 90619 0.040 0.067
2000E 35950 0.176 1.06 365 242 93630 0.033 0.215
2001E 43100 0.199 1.06 365 248 95951 0.025 0.229
bad news forecasts
good news forecasts
sales %
growth
forecast
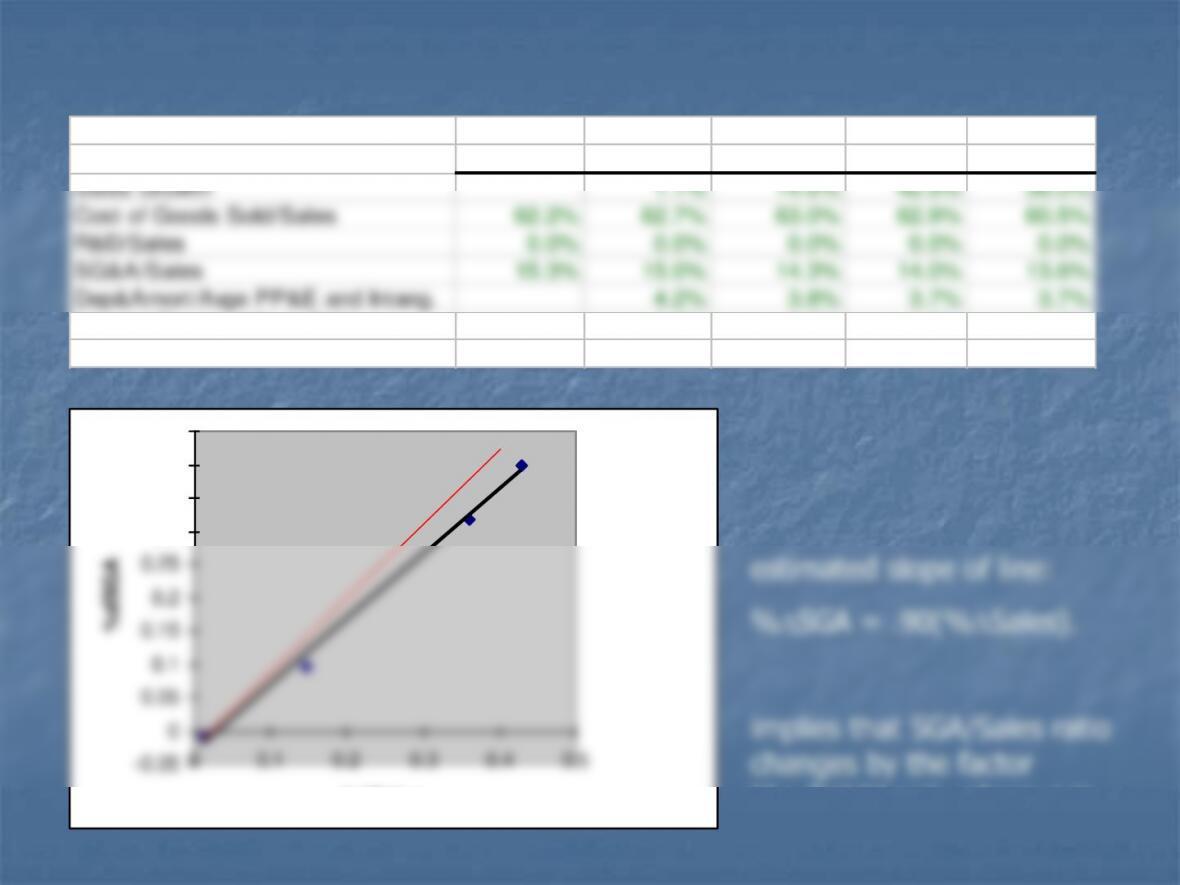
Forecasting Costs: economies of scale?
Actual Actual Actual Actual Actual
12/31/1994 12/31/1995 12/31/1996 12/31/1997 12/31/1998
Sales Growth 1.1% 14.6% 42.9% 36.0%
Cost of Goods Sold/Sales 62.2% 62.7% 63.0% 62.9% 60.5%
R&D/Sales 0.0% 0.0% 0.0% 0.0% 0.0%
SG&A/Sales 15.3% 15.0% 14.3% 14.0% 13.6%
Dep&Amort/Avge PP&E and Intang. 4.2% 3.8% 3.7% 3.7%
Interest Expense/Avge Debt 6.5% 6.6% 6.5% 6.7%
Non-Operating Income/Sales 0.0% 1.7% 0.8% 0.4% 0.4%
0.25
0.3
0.35
0.4
0.45
slope of less than one implies
economies of scale.
the %DSales.