what direction is
this ship headed?
Forecasting for
the Love Boat
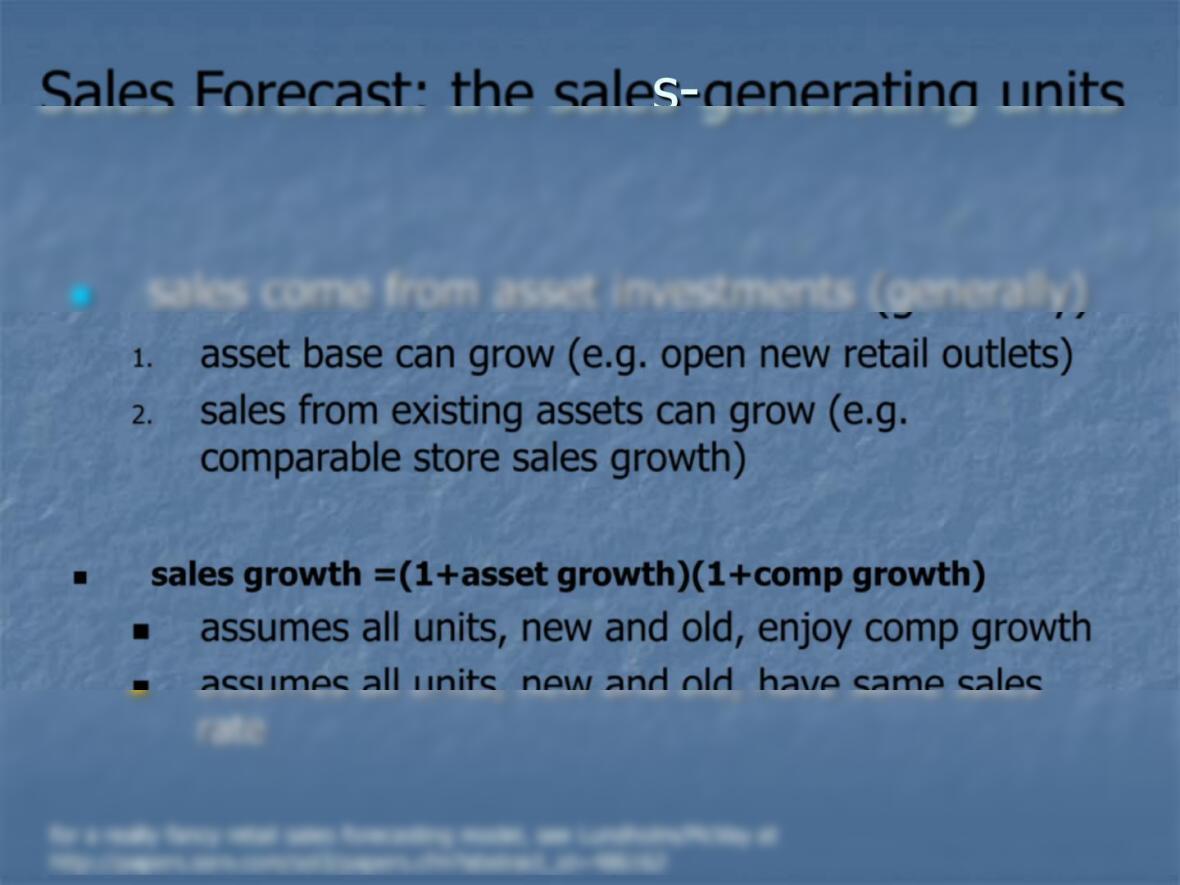
1. asset base can grow (e.g. open new retail outlets)
2. sales from existing assets can grow (e.g.
comparable store sales growth)
◼sales growth =(1+asset growth)(1+comp growth)
◼assumes all units, new and old, enjoy comp growth
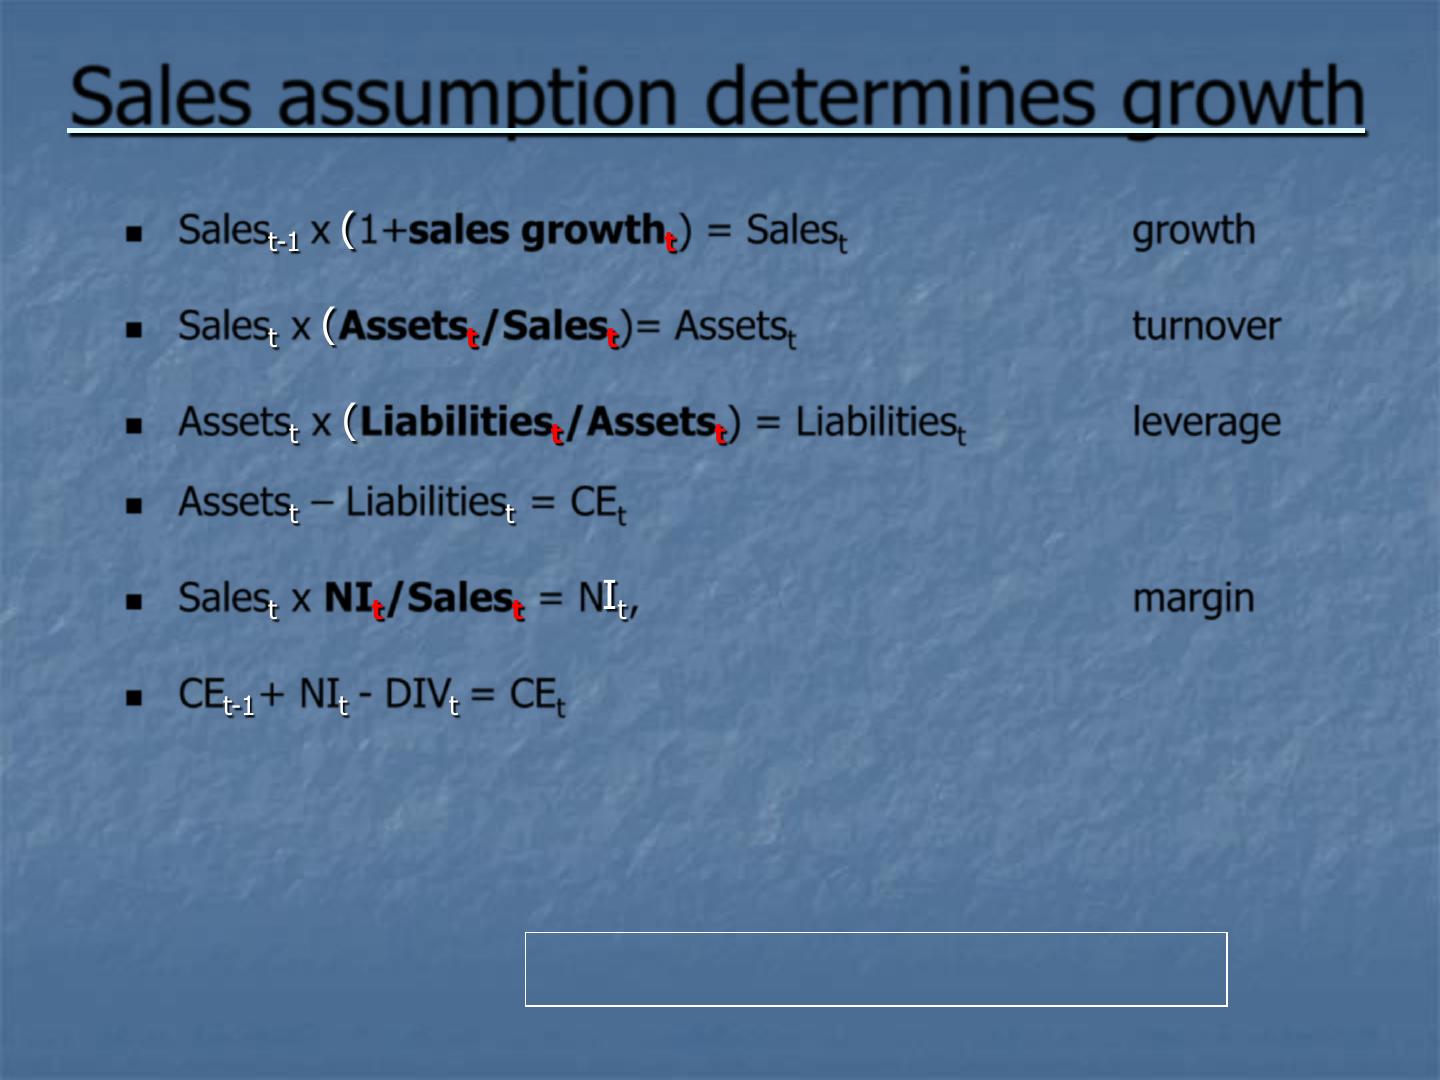
Sales assumption determines growth
◼Salest–1 x (1+sales growtht) = Salestgrowth
◼Salestx (Assetst/Salest)= Assetstturnover
◼Assetstx (Liabilitiest/Assetst) = Liabilitiestleverage
◼Assetst–Liabilitiest= CEt
◼Salestx NIt/Salest= NIt, margin
◼CEt–1+ NIt –DIVt = CEt
… and DIVtis determined!
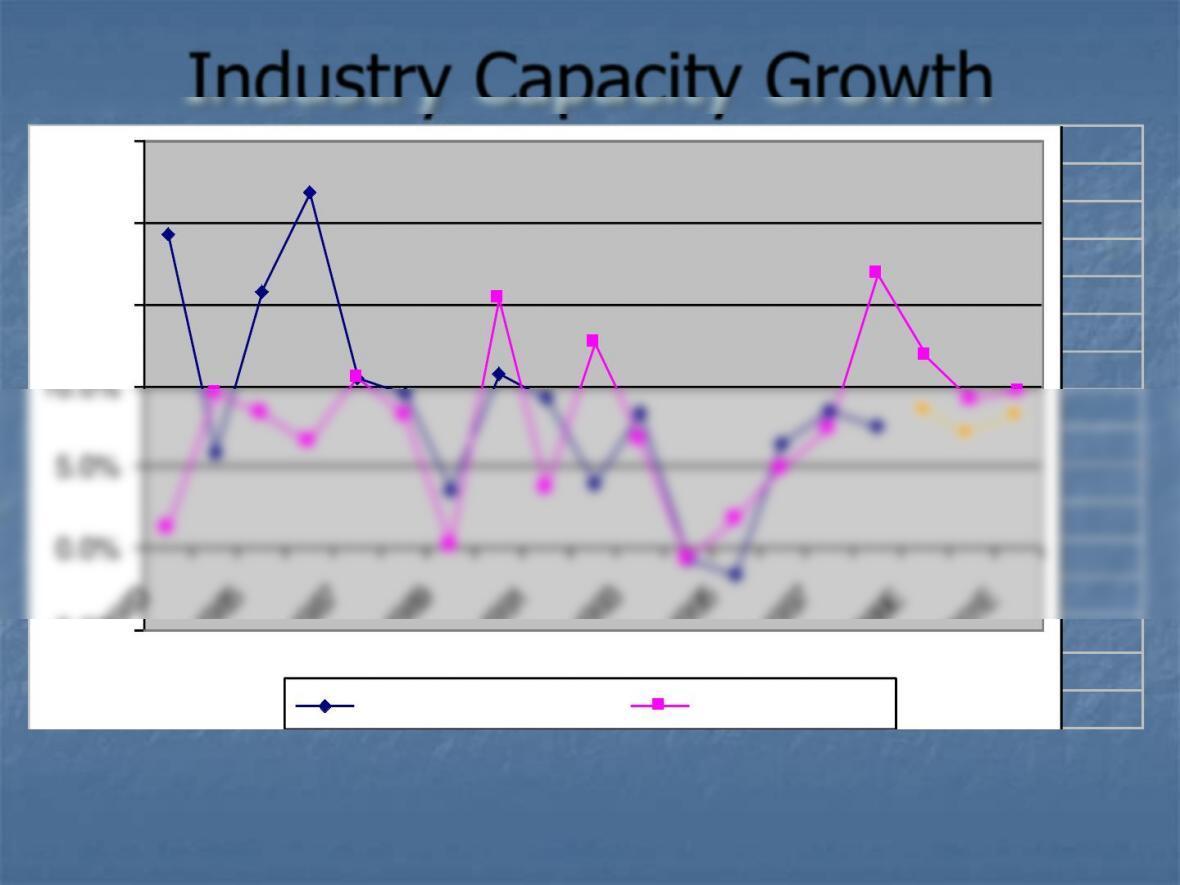
RCL: Sunny Skies and Clear Sailing?
–5.0%
0.0%
5.0%
10.0%
15.0%
20.0%
25.0%
1983
1985
1987
1989
1991
1993
1995
1997
1999E
2001E
passenger growth % berth growth %
Or, assuming 5000 berths retired each year, industry growth in berths is 8.2%,
6.1% and 7.1% over next three years,. Can demand increase at least this much?
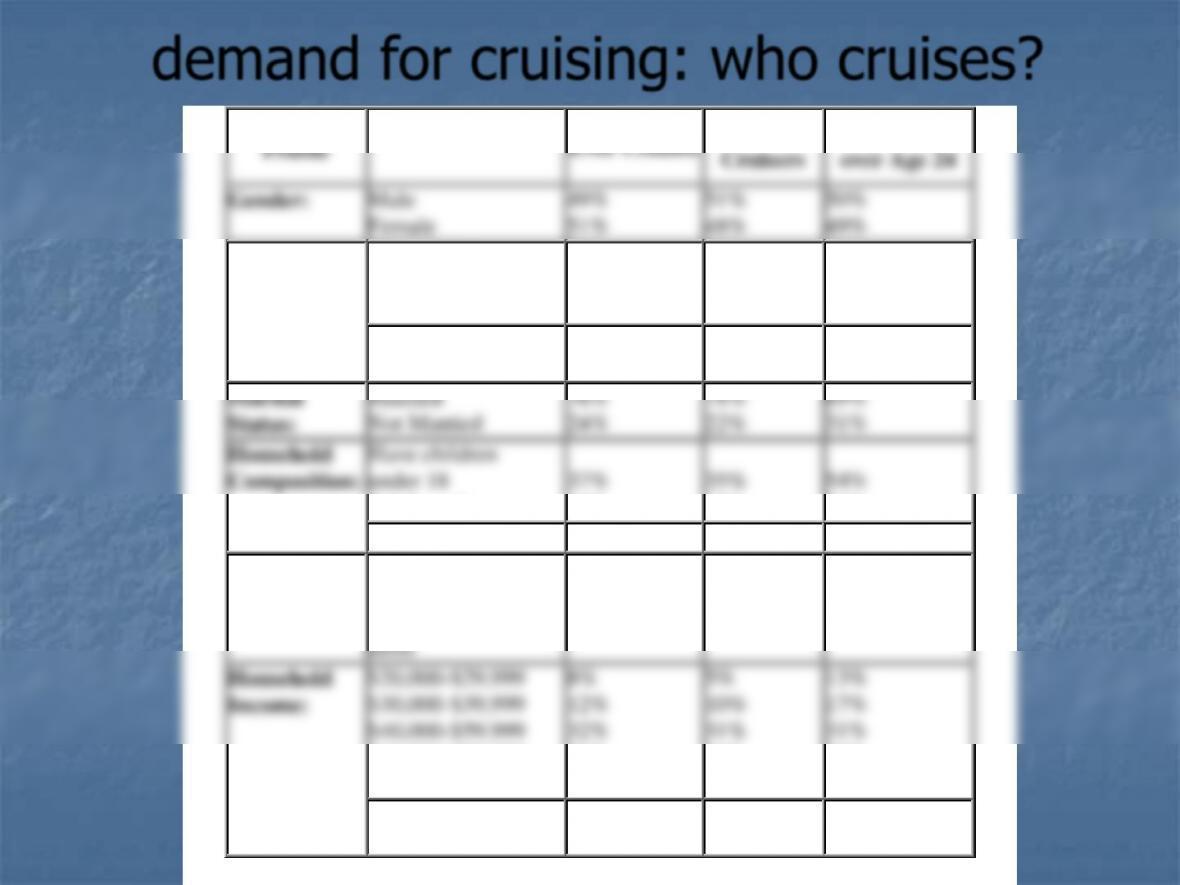
demand for cruising: who cruises?
Demographic
Past 5 Year
Population
25-under 40 years
40-59 years
60 years or older
27%
42%
32%
28%
42%
30%
43%
44%
13%
Age:
Average
Median
51 yrs.
51 yrs.
50 yrs.
51 yrs.
43 yrs.
42 yrs.
Adults only
63%
65%
46%
Occupants
3
3
3
Education:
Some College or
less
College Graduate or
42%
58%
36%
64%
54%
46%
$60,000-$99,999
$100,000 or more
28%
20%
30%
25%
29%
9%
Average
Median
$72,600
$58,500
$79,100
$64,500
$60,400
$51,800
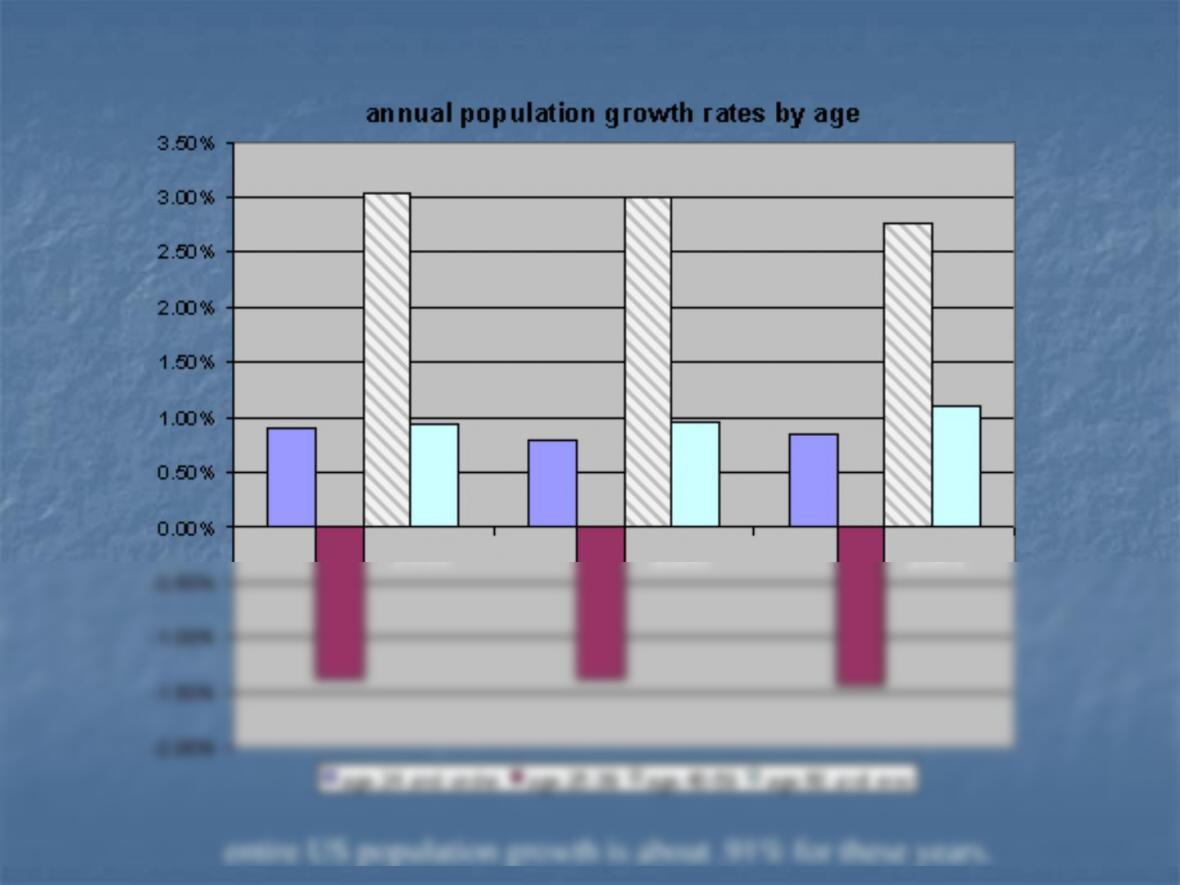
demand for cruising: demographics
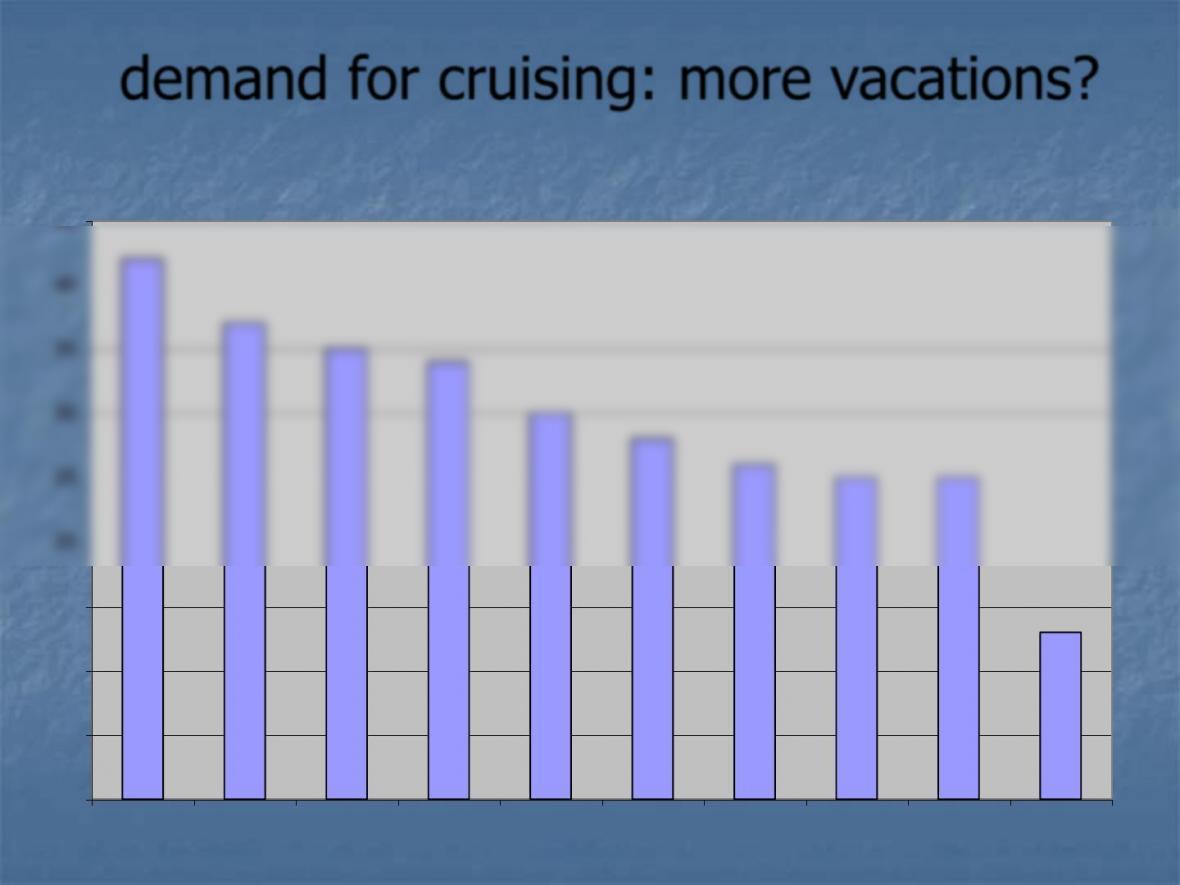
demand for cruising: more vacations?
Average Number of Vacation Days
0
5
10
15
20
25
30
35
40
45
Italy France Germany Brazil Austria UK Canada Korea Japan USA
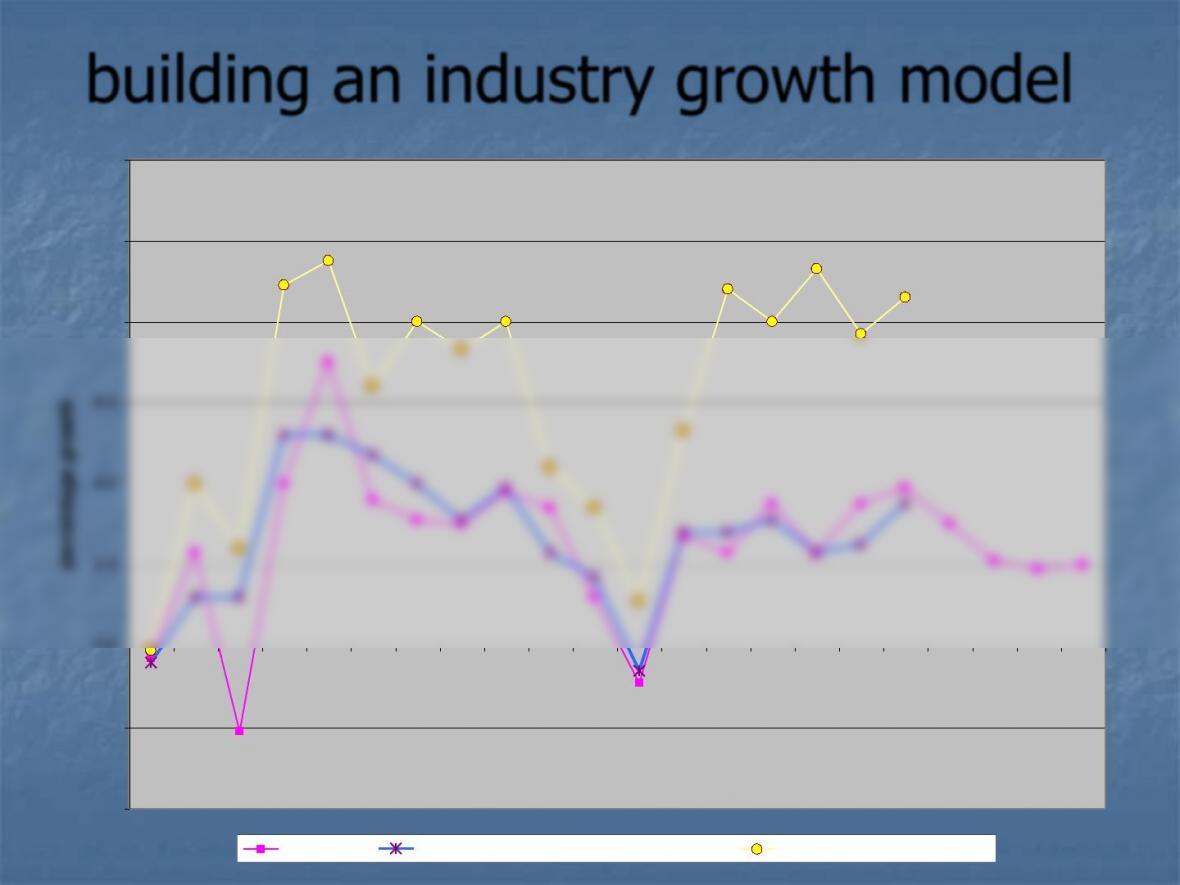
building an industry growth model
-4.0
-2.0
0.0
2.0
4.0
6.0
8.0
10.0
12.0
1980
1981
1982
1983
1984
1985
1986
1987
1988
1989
1990
1991
1992
1993
1994
1995
1996
1997
1998E
1999E
2000E
2001E
percentage growth
Real GDP Personal Consumption Expenditures Recreation Expenditures