11
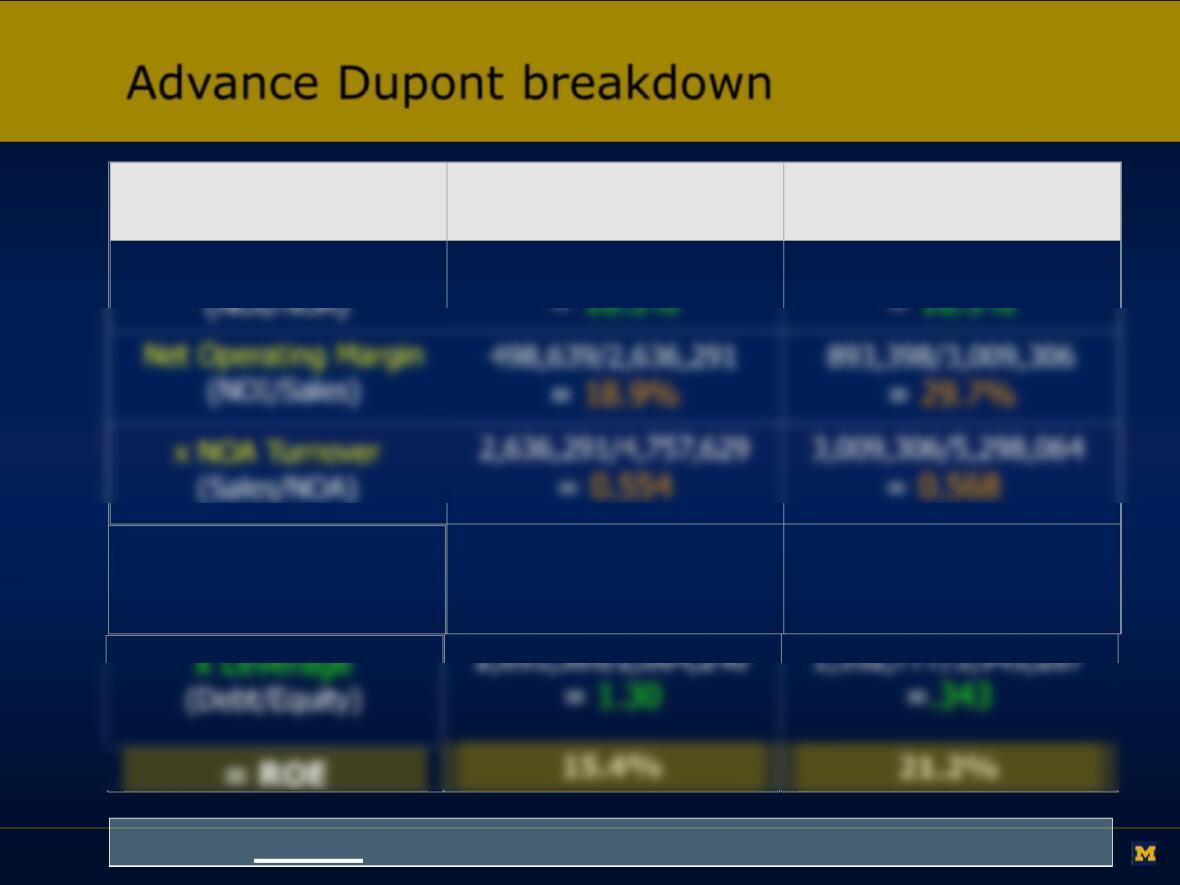
Advance Dupont breakdown
Royal Caribbean Carnival
RNOA=
498,639/4,757,629
893,398/5,298,064
+ Spread
(RNOA – NBC)
10.5% – 6.7%
= 3.8%
16.9% – 4.3%
=12.6%
Check: ROE = RNOA + (Spread x Leverage)
2,693,389/2,064,240
1,352,777/3,945,287
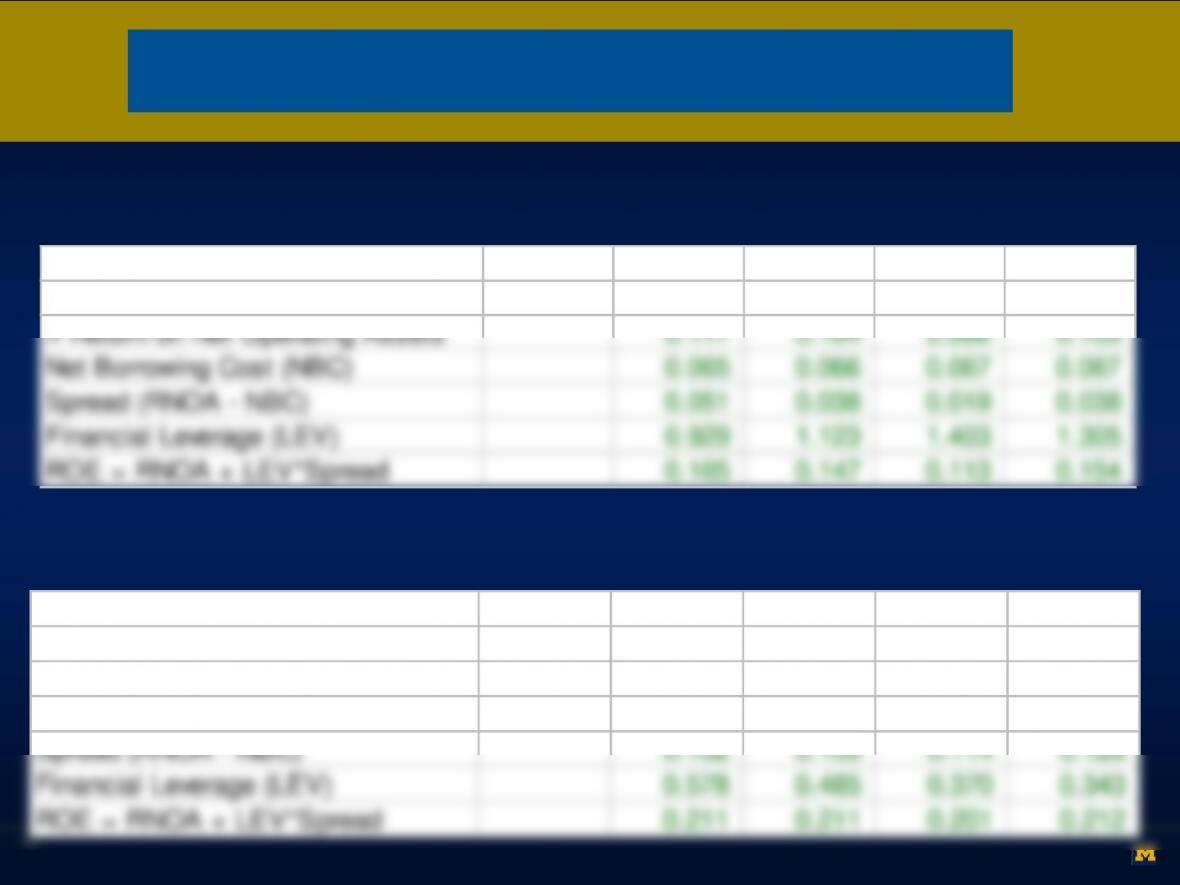
Advanced Dupont Analysis
Royal Caribbean Cruises 1994 1995 1996 1997 1998
Carnival Cruises 1994 1995 1996 1997 1998
Net Operating Margin 0.154 0.172 0.168 0.157 0.189
x Net Operating Asset Turnover 0.678 0.624 0.551 0.554
= Return on Net Operating Assets 0.117 0.104 0.086 0.105
Net Borrowing Cost (NBC) 0.065 0.066 0.067 0.067
Spread (RNOA – NBC) 0.051 0.038 0.019 0.038
Financial Leverage (LEV) 0.929 1.123 1.403 1.305
ROE = RNOA + LEV*Spread 0.165 0.147 0.113 0.154
Net Operating Margin 0.239 0.257 0.284 0.295 0.297
x Net Operating Asset Turnover 0.593 0.554 0.538 0.568
= Return on Net Operating Assets 0.152 0.158 0.159 0.169
Net Borrowing Cost (NBC) 0.050 0.048 0.045 0.043
13
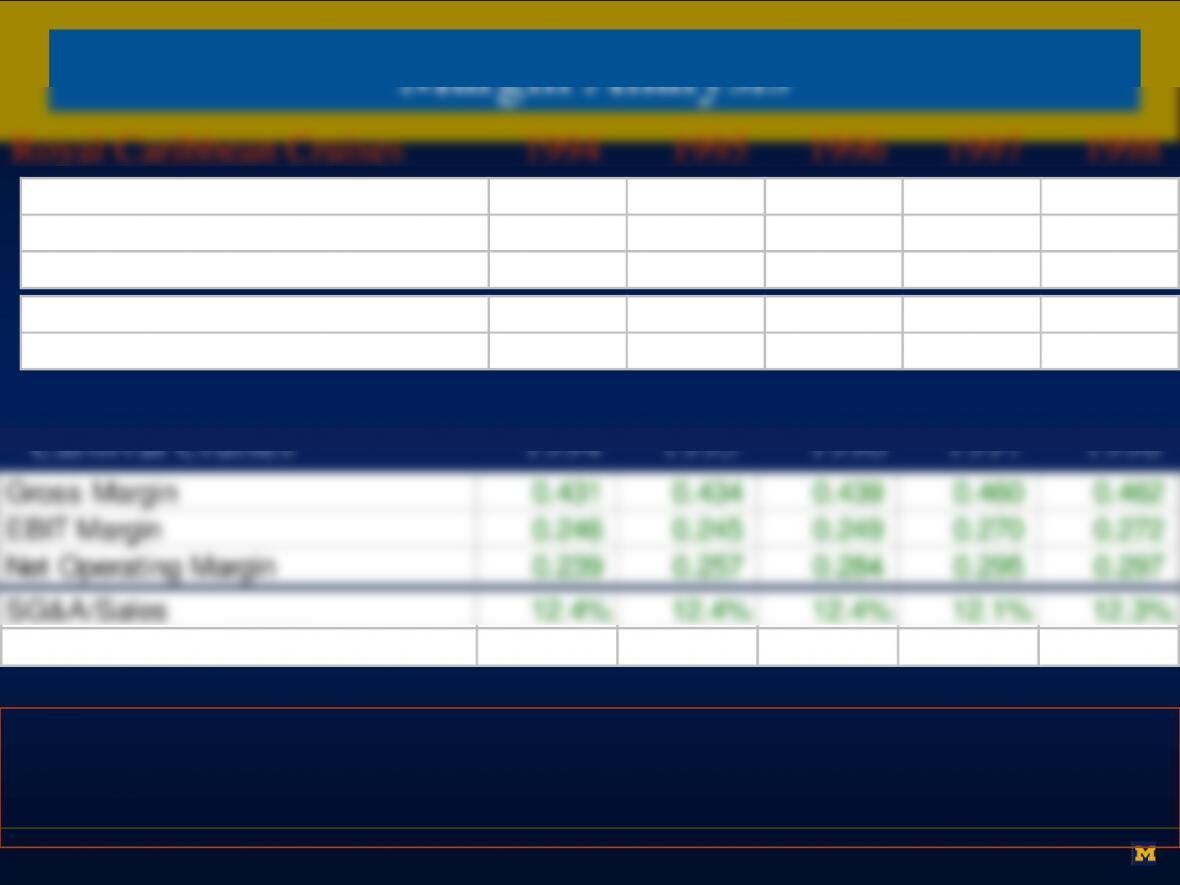
Royal Caribbean Cruises 1994 1995 1996 1997 1998
Carnival Cruises 1994 1995 1996 1997 1998
Margin Analysis
Difference in NetOperatingMargin 11.6% 13.8% 10.8%
Difference in GrossMargin 6.9% 8.9% 6.7%
Gross Margin 0.378 0.373 0.370 0.371 0.395
EBIT Margin 0.159 0.155 0.160 0.157 0.185
Net Operating Margin 0.154 0.172 0.168 0.157 0.189
SG&A/Sales 15.3% 15.0% 14.3% 14.0% 13.6%
Dep&Amort/Avge PP&E and Intang. 4.2% 3.8% 3.7% 3.7%
Gross Margin 0.431 0.434 0.439 0.460 0.462
EBIT Margin 0.246 0.245 0.249 0.270 0.272
Net Operating Margin 0.239 0.257 0.284 0.295 0.297
SG&A/Sales 12.4% 12.4% 12.4% 12.1% 12.3%
Dep&Amort/Avge PP&E and Intang. 3.7% 3.6% 3.8% 3.7%
14
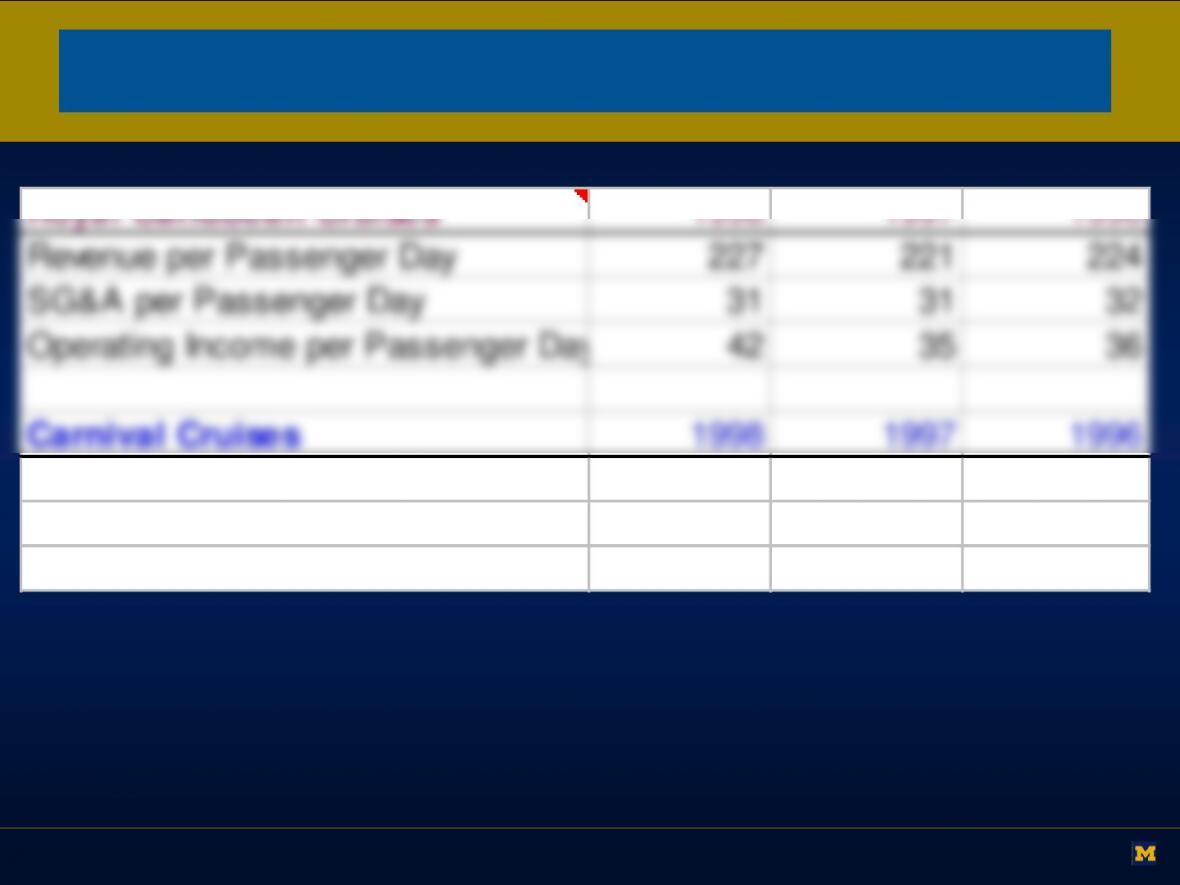
Royal Caribbean Cruises 1998 1997 1996
Revenue per Passenger Day 227 221 224
SG&A per Passenger Day 31 31 32
Operating Income per Passenger Day
42 35 36
Carnival Cruises 1998 1997 1996
Revenue per Passenger Day 231 206 209
Margins and Pricing
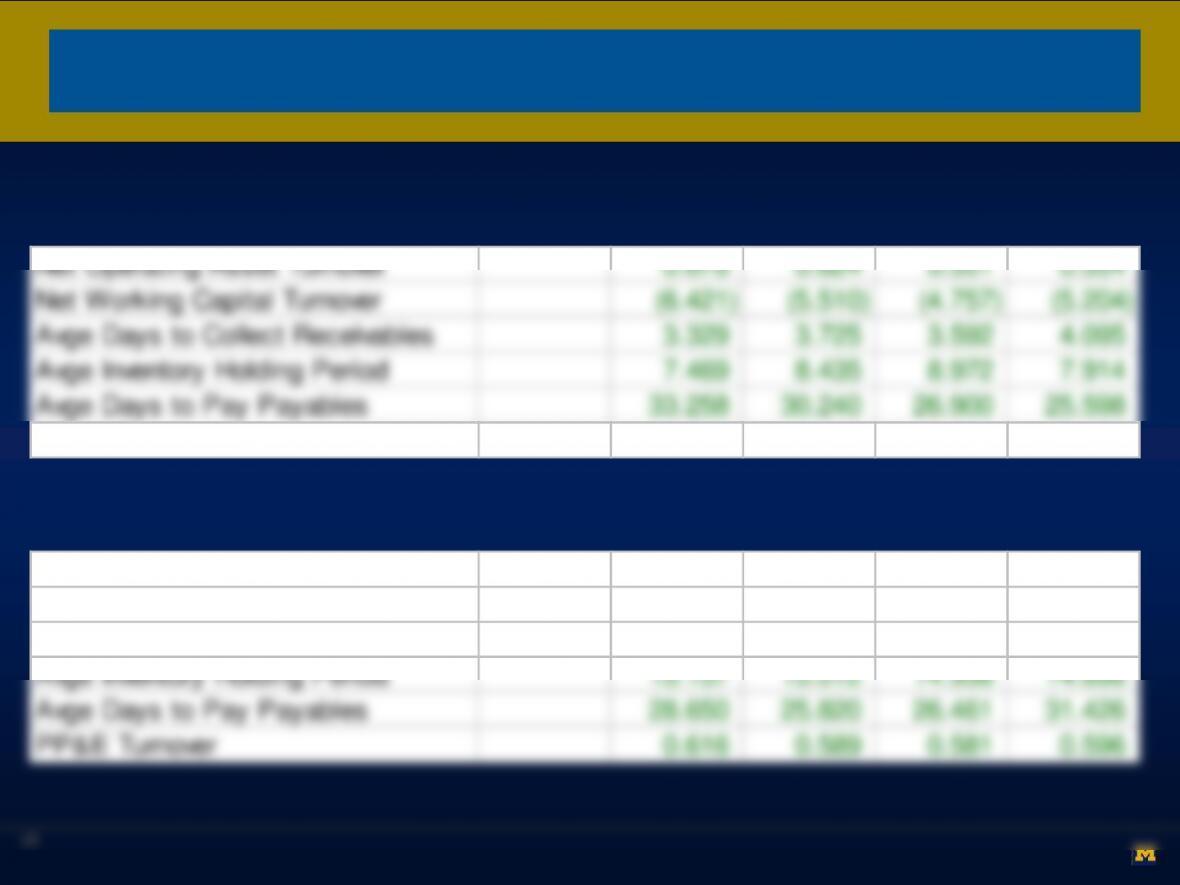
Turnover Analysis
Royal Caribbean Cruises 1995 1996 1997 1998
Carnival Cruises 1995 1996 1997 1998
Net Operating Asset Turnover 0.678 0.624 0.551 0.554
Net Working Capital Turnover (6.421) (5.510) (4.757) (5.204)
Avge Days to Collect Receivables 3.329 3.725 3.592 4.095
Avge Inventory Holding Period 7.469 8.435 8.972 7.914
Avge Days to Pay Payables 33.258 30.240 26.900 25.598
PP&E Turnover 0.753 0.656 0.541 0.535
Net Operating Asset Turnover 0.593 0.554 0.538 0.568
Net Working Capital Turnover (7.907) (7.750) (7.034) (5.533)
Avge Days to Collect Receivables 4.920 5.872 7.099 7.152
Avge Inventory Holding Period 15.157 15.012 14.936 14.698
16
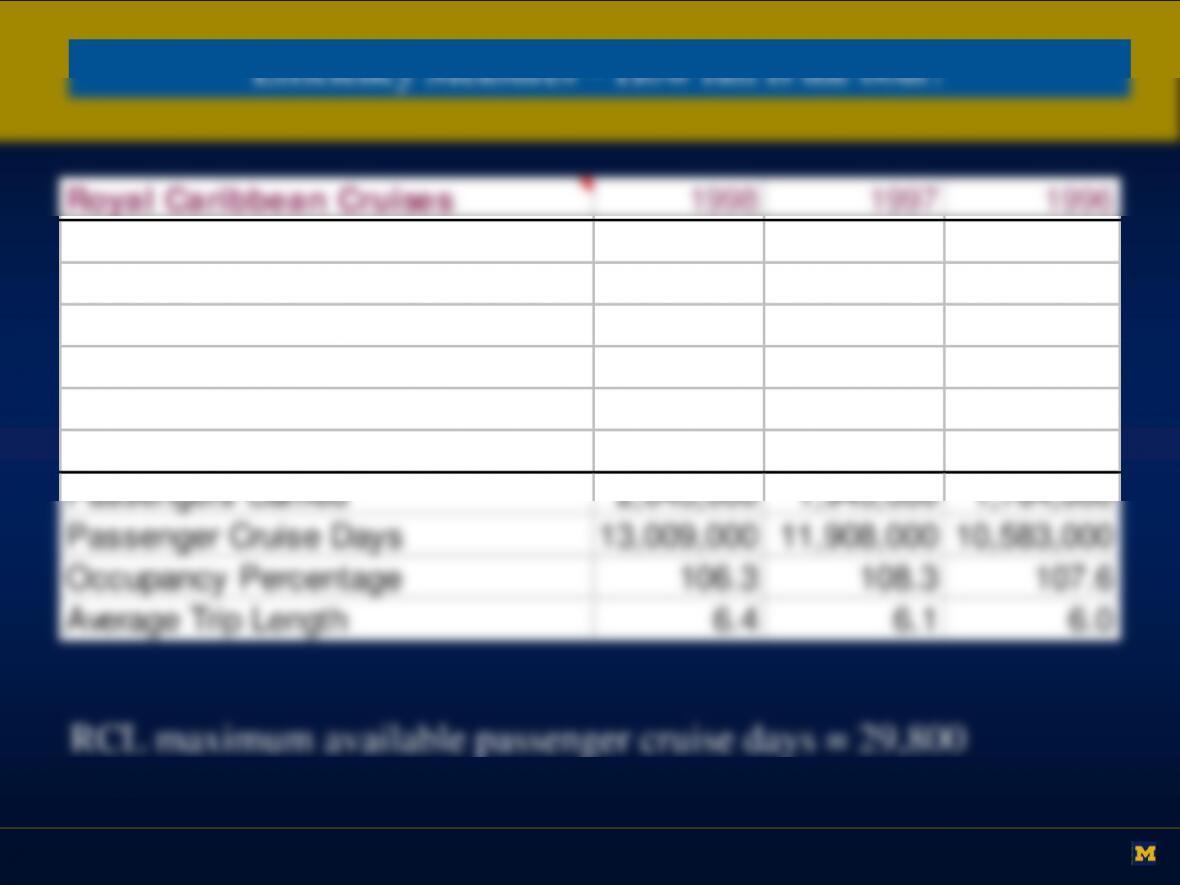
Royal Caribbean Cruises 1998 1997 1996
Passengers Carried 1,841,152 1,465,450 973,602
Passenger Cruise Days 11,607,906 8,759,651 6,055,068
Occupancy Percentage 105.2 104.2 101.3
Average Trip Length 6.3 6.0 6.2
Carnival Cruises 1998 1997 1996
Passengers Carried 2,045,000 1,945,000 1,764,000
Passenger Cruise Days 13,009,000 11,908,000 10,583,000
Occupancy Percentage 106.3 108.3 107.6
Average Trip Length 6.4 6.1 6.0
berths * 365 days = 10,877,000
17
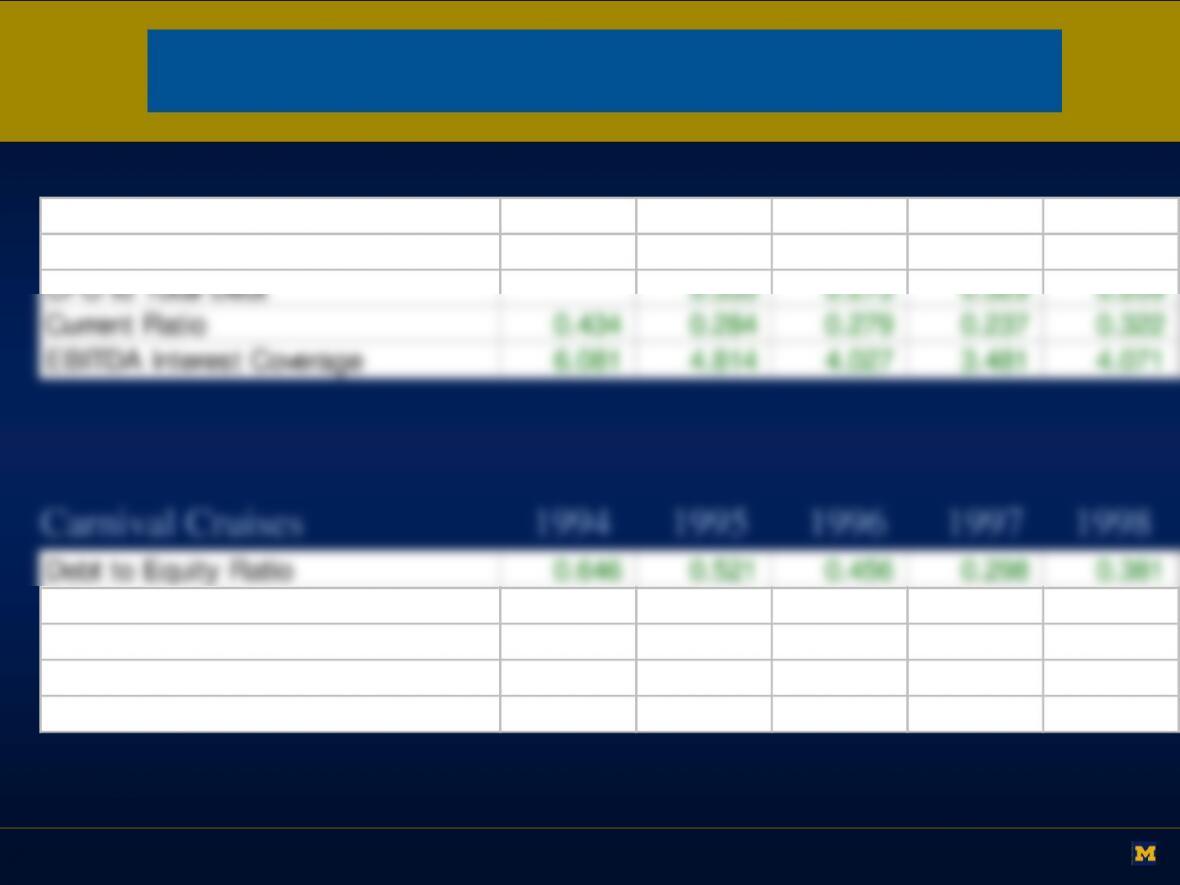
Royal Caribbean Cruises 1994 1995 1996 1997 1998
Leverage and Liquidity
Debt to Equity Ratio 0.883 0.970 1.260 1.393 1.082
FFO to Total Debt 0.272 0.210 0.162 0.208
CFO to Total Debt 0.353 0.273 0.329 0.209
Current Ratio 0.434 0.284 0.279 0.237 0.322
EBITDA Interest Coverage 6.081 4.814 4.027 3.481 4.071
Debt to Equity Ratio 0.646 0.521 0.456 0.298 0.381
FFO to Total Debt 0.471 0.604 0.620 0.896
CFO to Total Debt 0.475 0.650 0.710 1.118
Current Ratio 0.426 0.431 0.439 0.427 0.326
EBITDA Interest Coverage 10.788 9.805 10.866 14.817 17.664
18
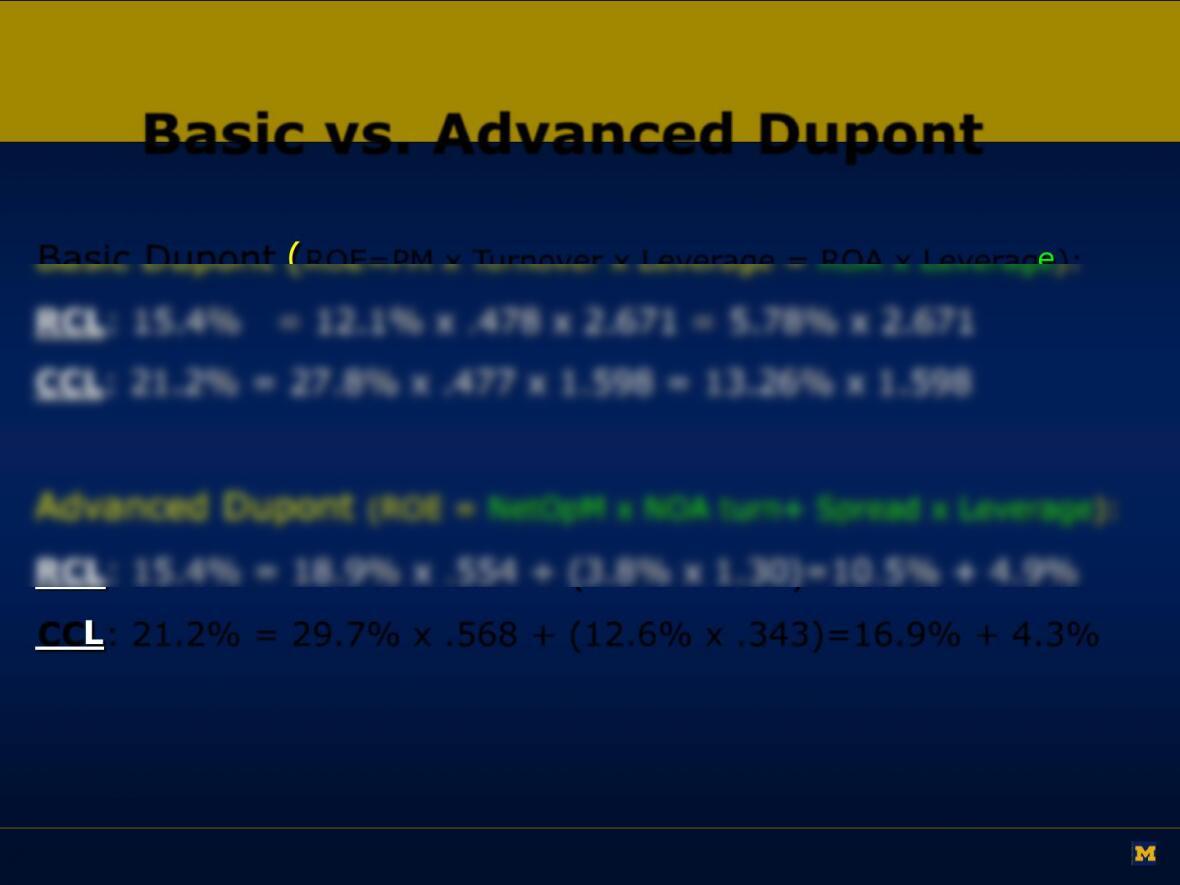
Basic vs. Advanced Dupont
CCL: 21.2% = 29.7% x .568 + (12.6% x .343)=16.9% + 4.3%
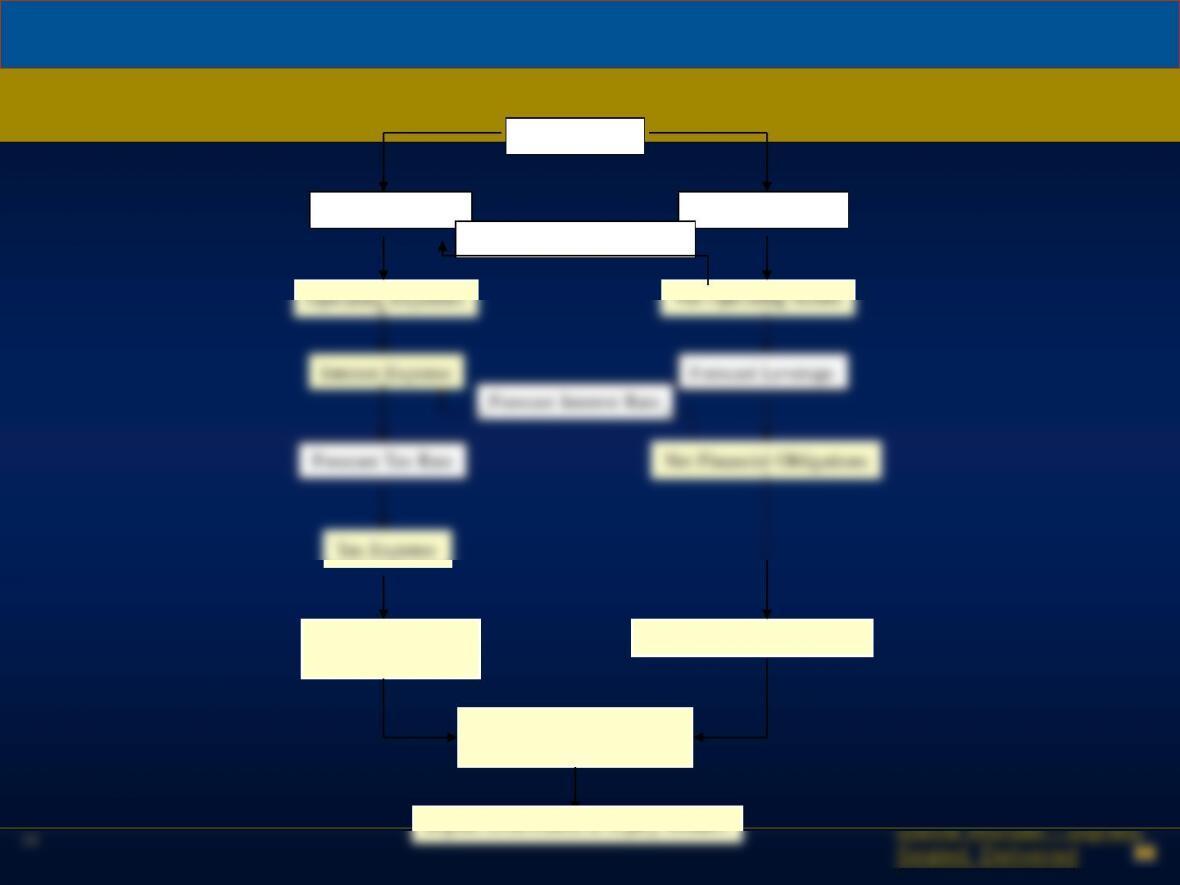
Forecast Sales
Forecast TurnoverForecast Margins
Pro Forma Balance Sheet
Tax Expense
Pro Forma
Income Statement
Pro Forma
Statement of Cash Flows
Implies Distribution to Equity Holders
Forecast Depreciation Rate
Structured Forecasting