Royal Caribbean Cruises
Ratio Analysis and Forecasting

2
The Cruise
Experience
3
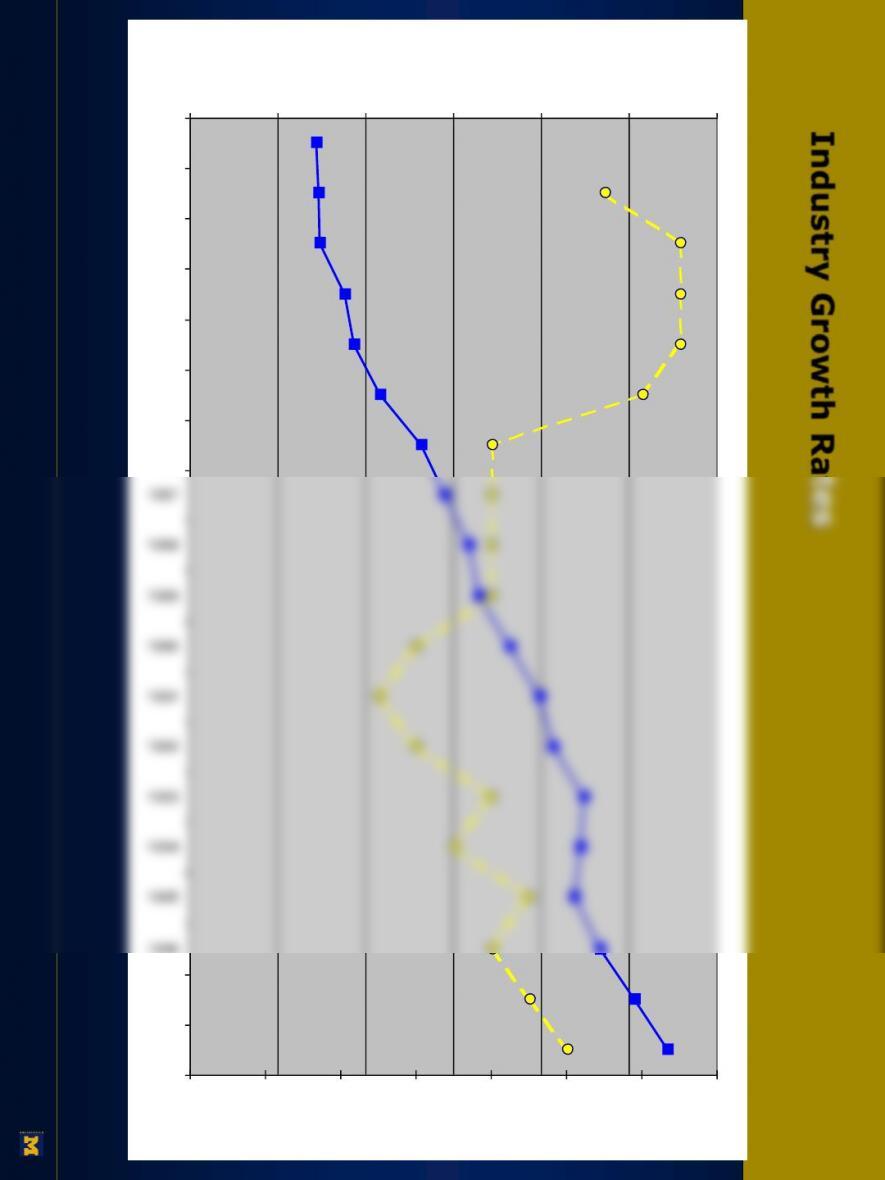
Industry Growth Rates
0
1000
2000
3000
4000
5000
6000
1980
1981
1982
1983
1984
1985
1986
1987
1996
1997
1998
annual cruise passengers (thousands)
5.6
5.8
6
6.2
6.4
6.6
6.8
7
average cruise length (days)
33
16
96
39466
29800
69107
2045000
1841000
1542000
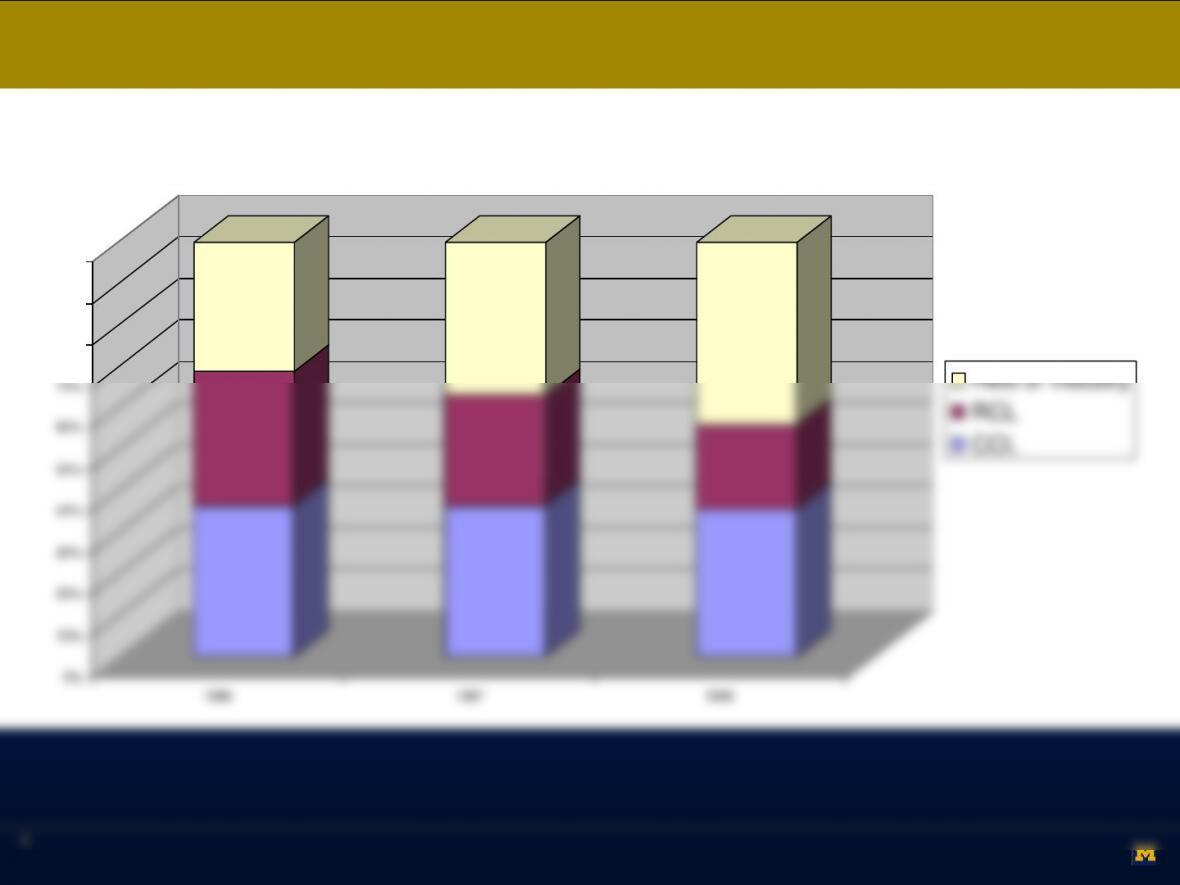
0%
20%
40%
60%
80%
100%
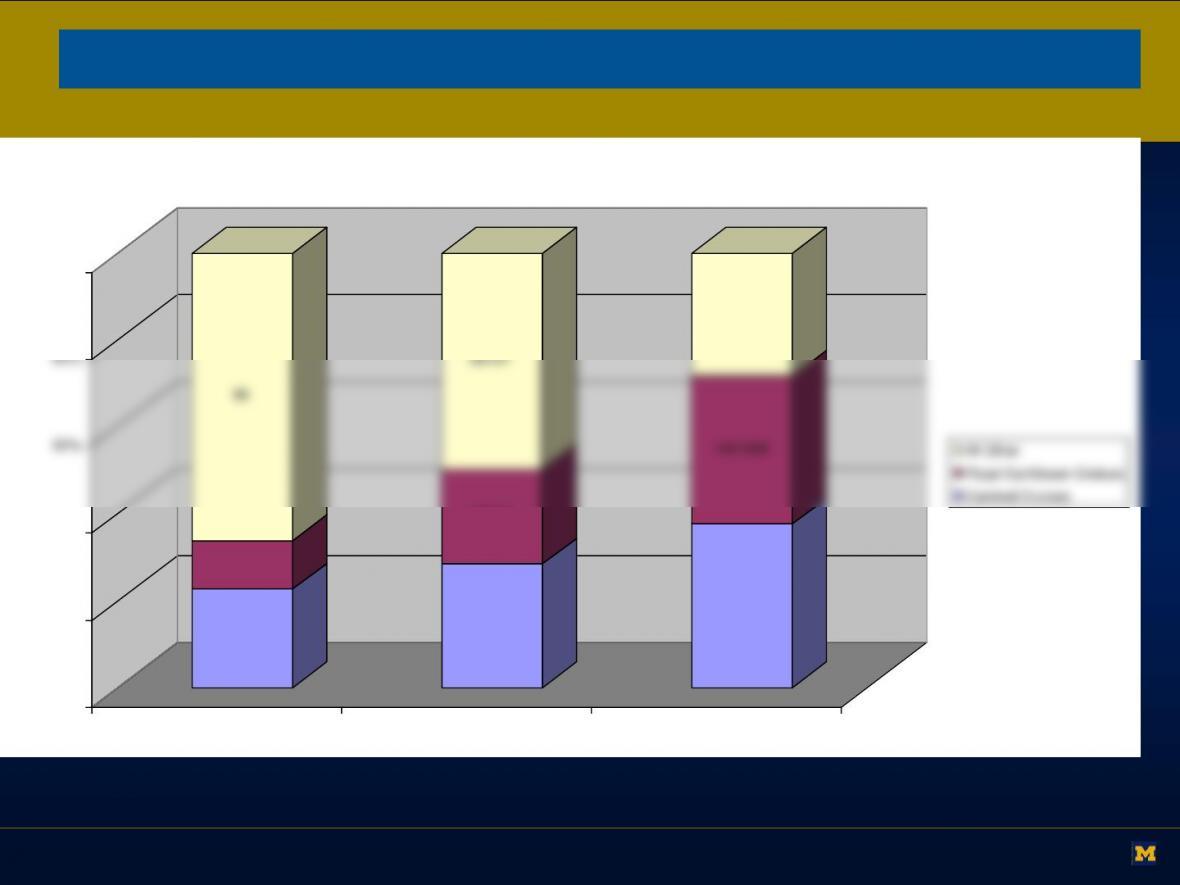
ships berths passengers
1998 Market Share
All Other
Royal Caribbean Cruises
Carnival Cruises
Cruise Industry Market Shares
5
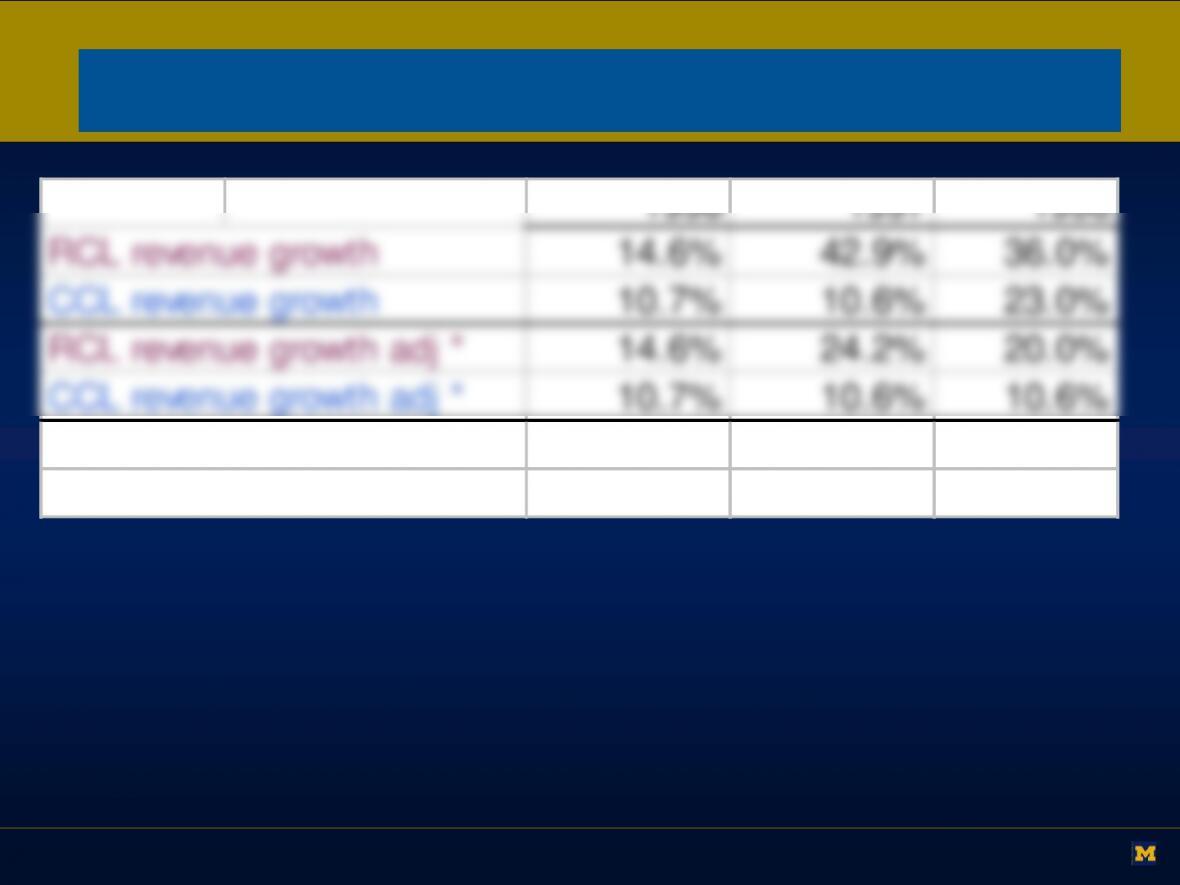
1996 1997 1998
RCL revenue growth 14.6% 42.9% 36.0%
CCL revenue growth 10.7% 10.6% 23.0%
RCL revenue growth adj * 14.6% 24.2% 20.0%
CCL revenue growth adj * 10.7% 10.6% 10.6%
RCL passenger day growth 44.7% 32.5%
CCL passenger day growth 12.5% 9.2%
Growth at RCL and CCL
0%
10%
20%
30%
40%
50%
60%
70%
80%
90%
100%
1998 1997 1996
share of passenger cruise days
Rest of Industry
RCL
CCL
7
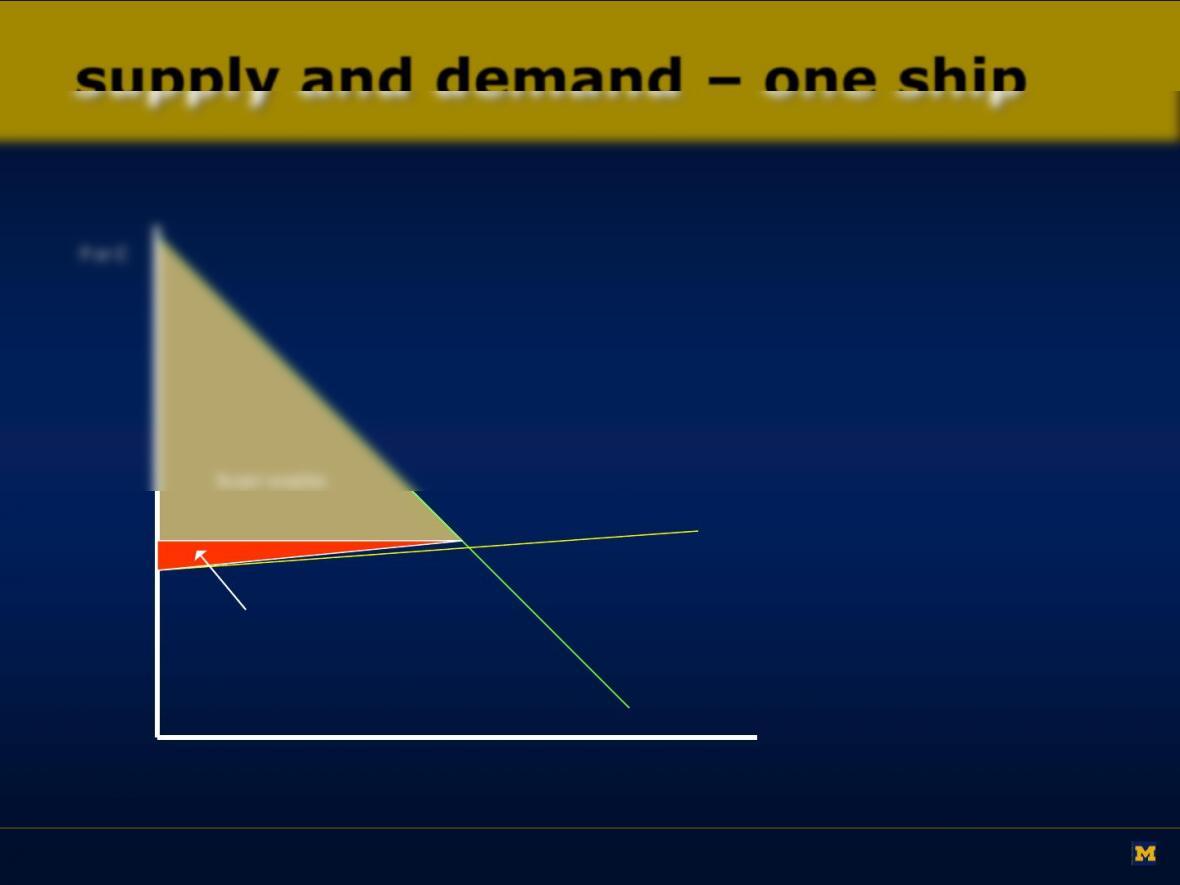
mc = 0
seller surplus
buyer surplus
P or C
Q
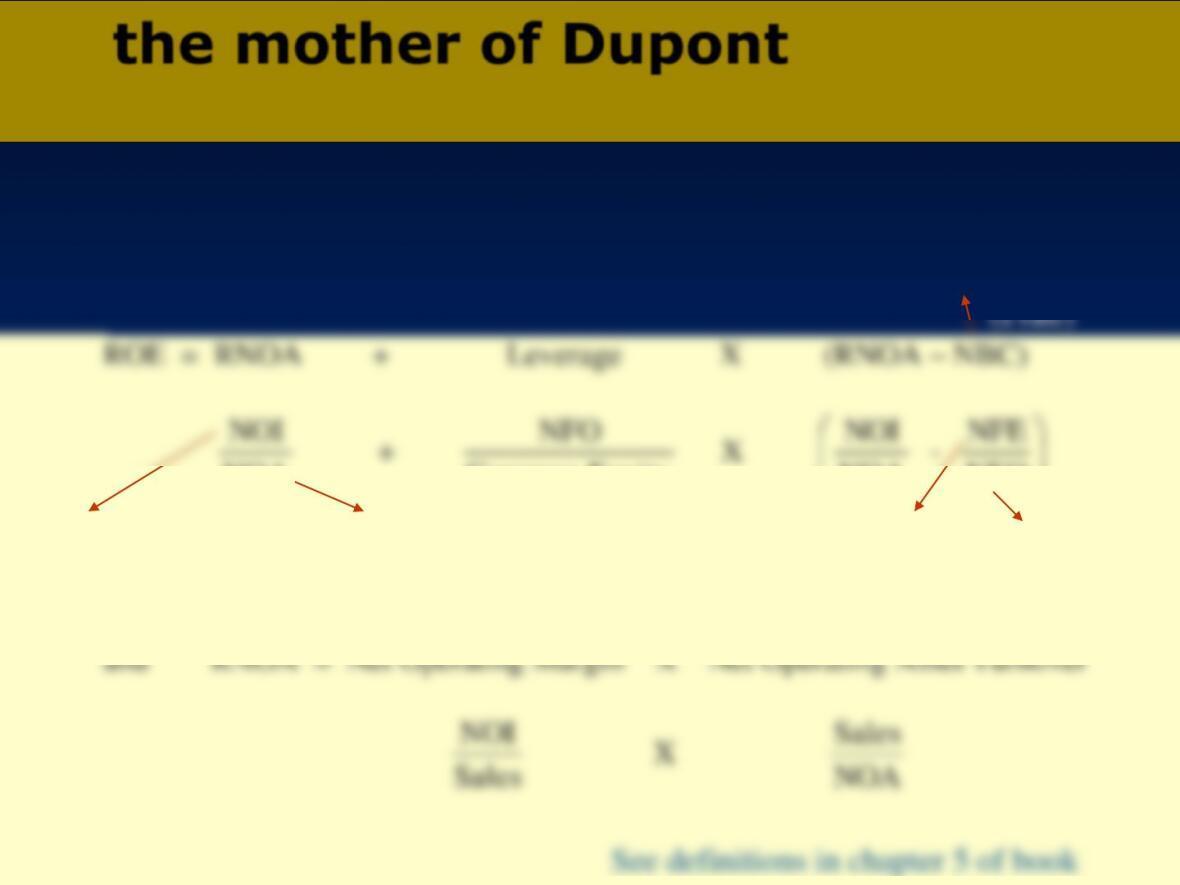
ROE = RNOA + Leverage X (RNOA – NBC)
NOA
NOI
+
EquityCommon
NFO
X
NFO
NFE
–
NOA
NOI
the mother of Dupont
Return on equity = return on net operating assets + leverage X spread
net operating income net operating assets
net borrowing cost
net financial
obligations
net financial
expense
9
YEAR ENDED DECEMBER 31,
————————————
1998 1997 1996
———- ———- ———-
———- ———- ———-
Expenses
Operating……………………….. 1,593,728 1,219,268 854,478
Marketing, selling and administrative. 359,214 272,368 194,629
Depreciation and amortization……… 194,614 143,816 91,185
———- ———- ———-
2,147,556 1,635,452 1,140,292
———- ———- ———-
Operating Income…………………… 488,735 303,555 217,033
———- ———- ———-
Other Income (Expense)
Interest income………………….. 15,912 4,666 2,278
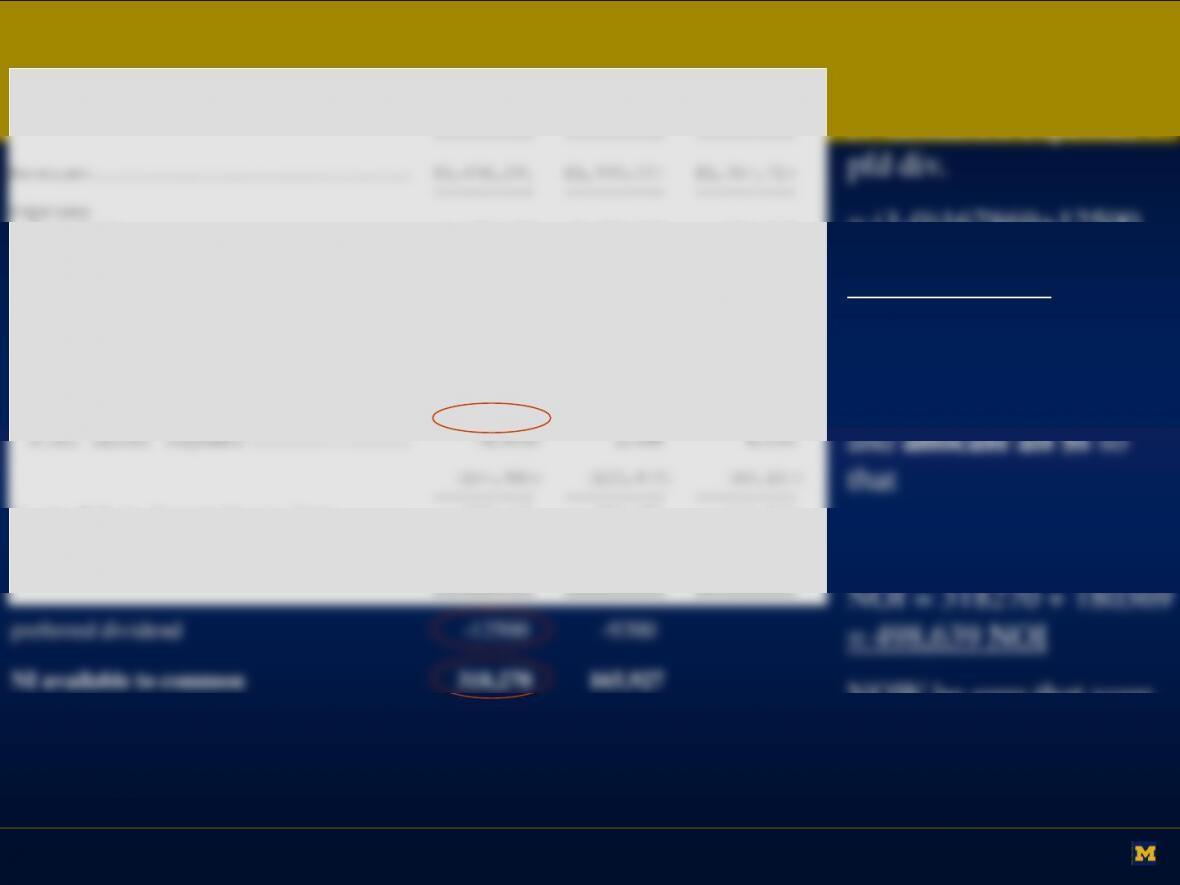
Income Before Extraordinary Item…….. 330,770 182,685 150,866
Extraordinary Item…………………. — (7,558) —
———- ———- ———-
Net Income………………………… $ 330,770 $ 175,127 $ 150,866
========== ========== ==========
NetFinancingExpense =
(1-t)(interest expense) +
= (1-0)167869+12500
=180,369 NFE.
NetOperatingIncome =
(1-t)OperatingIncome
NOI –NFE = NI
NOW be sure that your
allocations on BS.
10
1998 1997
———- ———-
ASSETS
Current Assets
Cash and cash equivalents……………………………
$172,921 $110,793
Trade and other receivables, net…..…………………
36,532 22,628
Inventories……………………..…………………
31,834 37,274
Prepaid expenses……………………………………
Total current assets……………..………….
depreciation and amortization……..…………………
5,073,008 4,785,291
Goodwill — less accumulated amortization of $107,365 and
$96,952, respectively…………….…………………
309,801 320,214
Other Assets…………………….…………………..
16,936 23,098
———- ———-
$5,686,076 $5,339,748
========== ==========
LIABILITIES AND SHAREHOLDERS’ EQUITY
Current Liabilities
Current portion of long-term debt….…………………
$127,919 $141,013
Accounts payable……………………………………
Accrued liabilities…………………………………
Total current liabilities…………………….
890,155 889,344
Long-Term Debt…………………..…………………..
2,341,163 2,431,683
Preferred Stock…. 172,500 172,500
Common stock ($.01 par value; 500,000,000 shares
Retained earnings………………..…………………
923,691 660,655
Treasury stock (354,492 and 314,148 common shares at
cost)…………………………..………………
–4,919 -4,359
———- ———-
Total shareholders’ equity………..………….
2,454,758 2,018,721
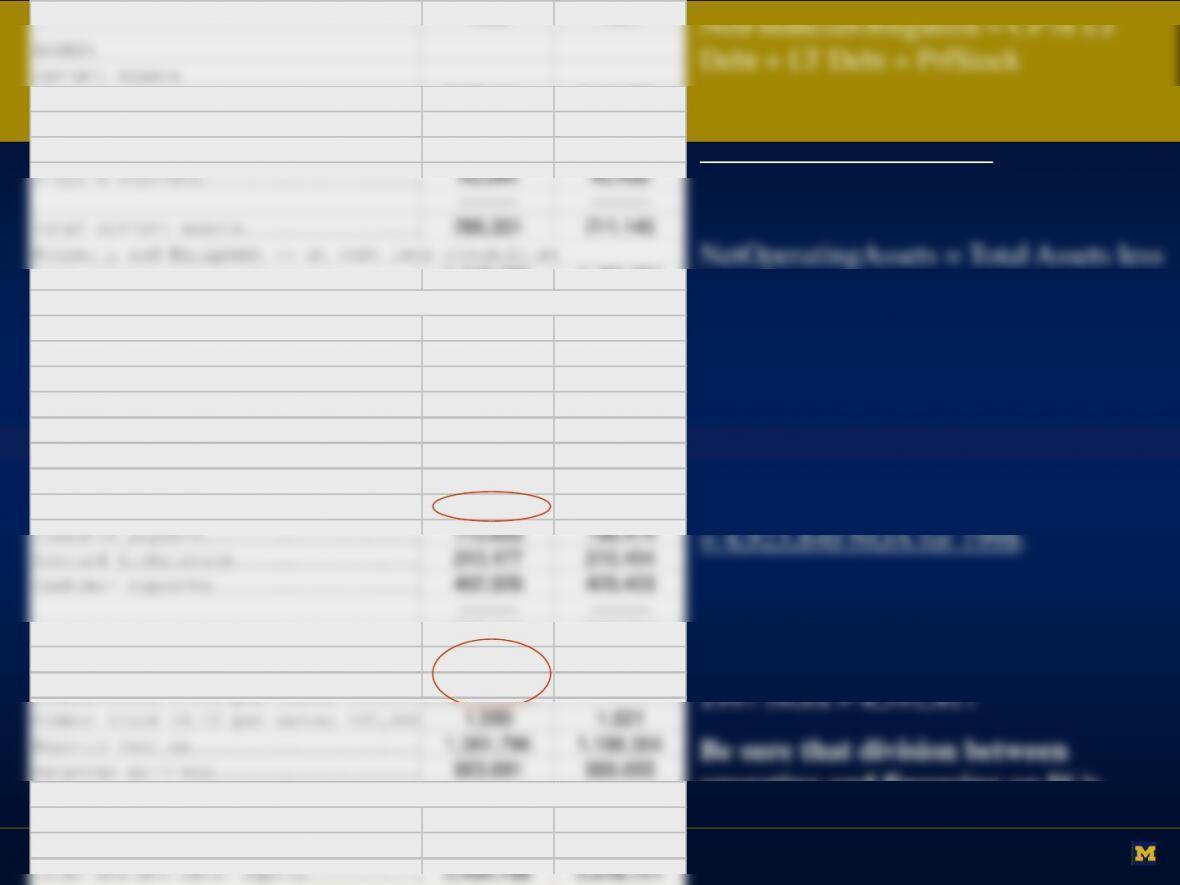
NetFinancialObligation = CP of LT
Debt + LT Debt + PrfStock
= 127,919 + 2,341,163 + 172,500 =
2,641,582 NFO for 1998
Operating Liabilities.
Allocate all $s such that
NOA –NFO = CE.
NOA = CE + NFO = (2,454,758 –
172,500) + 2,641,582
1997 NFO = 2,745,196
operating and financing on IS is
consistent with division on BS!