18
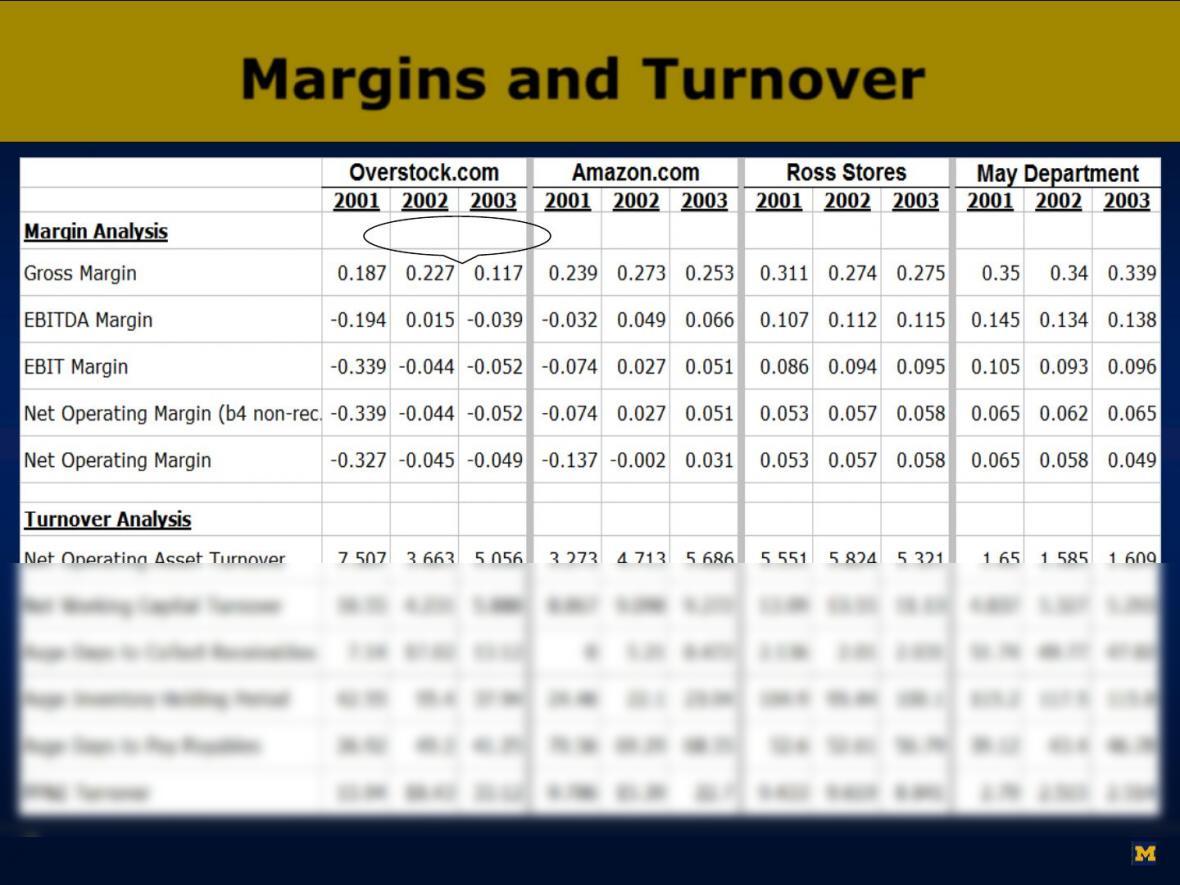
Margins and Turnover
12.8%
9%
Boston Chicken, 1996
Fiscal Years Ended
——————————————————-
Net income……………………………………………… $ 16,173 $ 33,559 $ 66,958
——— ——– —————
Net cash provided by operating activities………….. 35,918 55,476 144,910
——— ——– —————
Cash Flows from Investing Activities:
——— ——– —————
Net cash used in investing activities……………… (263,239) (321,855) (525,026)
——— ——– —————
average noncash Net Operating Assets = $930,534k, so
Would Operating Accruals have
identified Boston Chicken’s distortion?
20
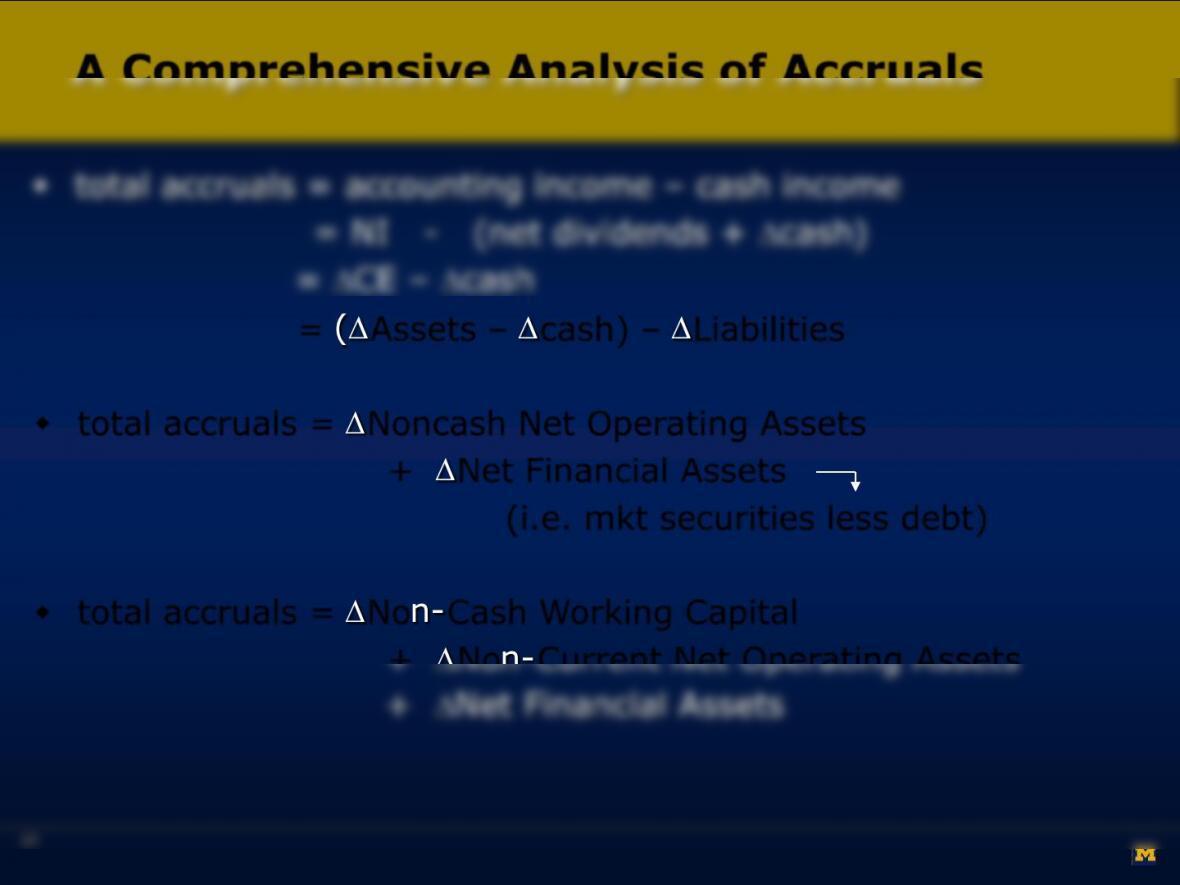
A Comprehensive Analysis of Accruals
total accruals = accounting income –cash income
= NI – (net dividends + Dcash)
= DCE –Dcash
= (DAssets –Dcash) –DLiabilities
total accruals = DNoncash Net Operating Assets
+ DNet Financial Assets
(i.e. mkt securities less debt)
total accruals = DNon–Cash Working Capital
21
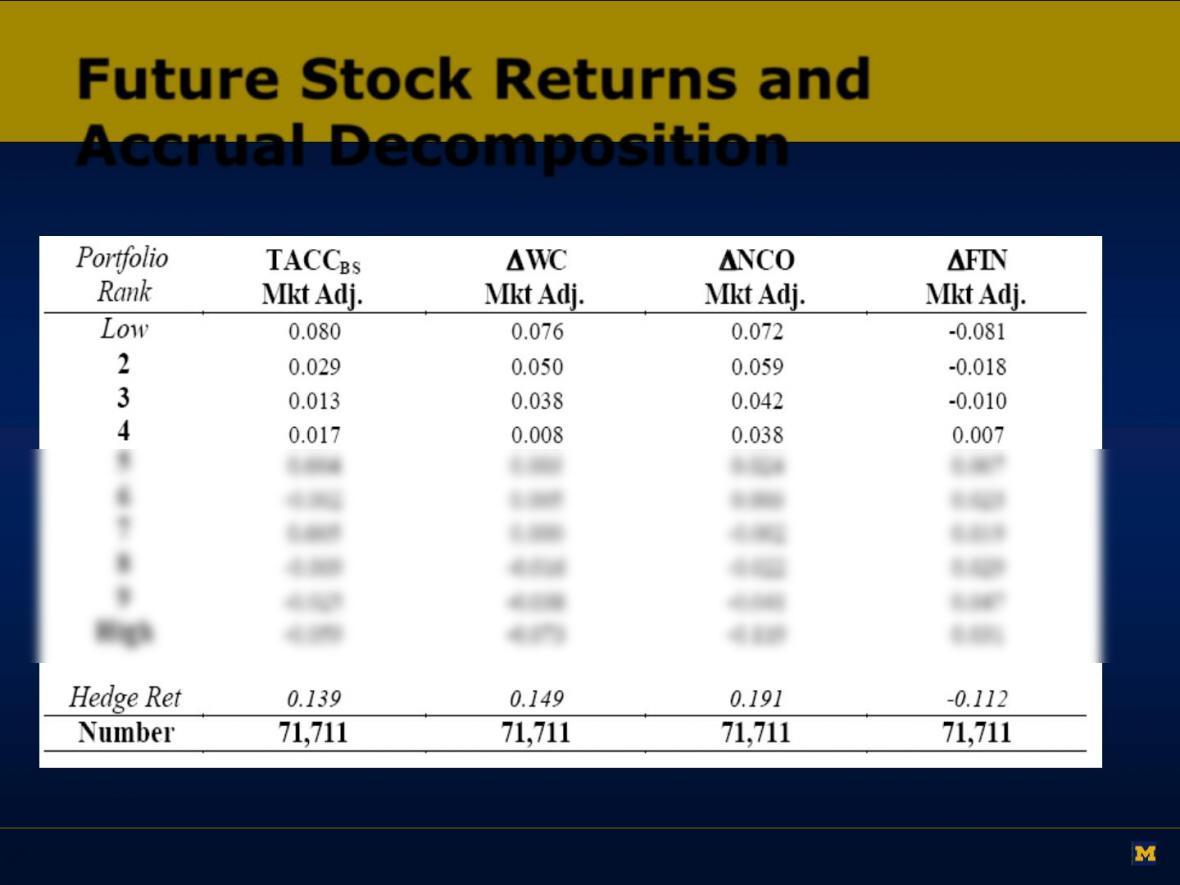
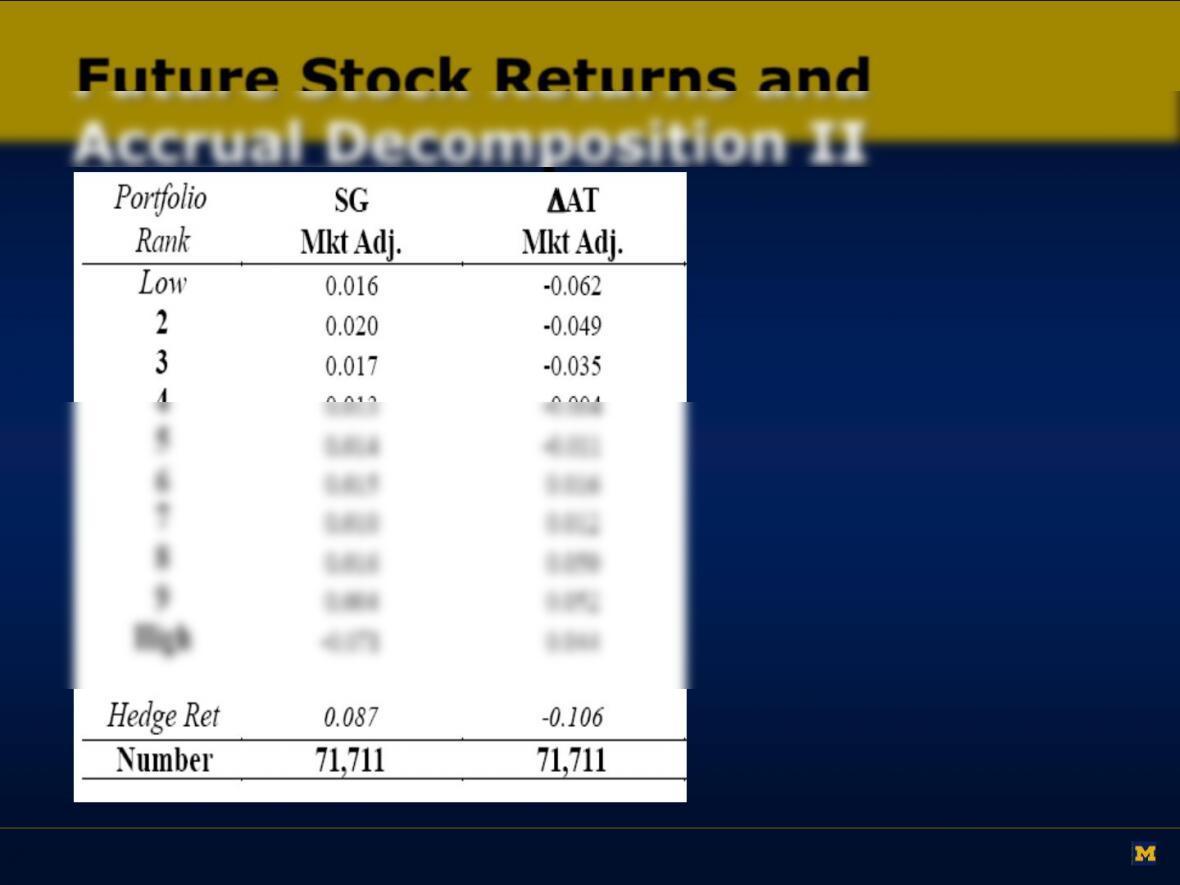
Future Stock Returns and
Accrual Decomposition
Richardson, Sloan, Soliman, Tuna (2002)
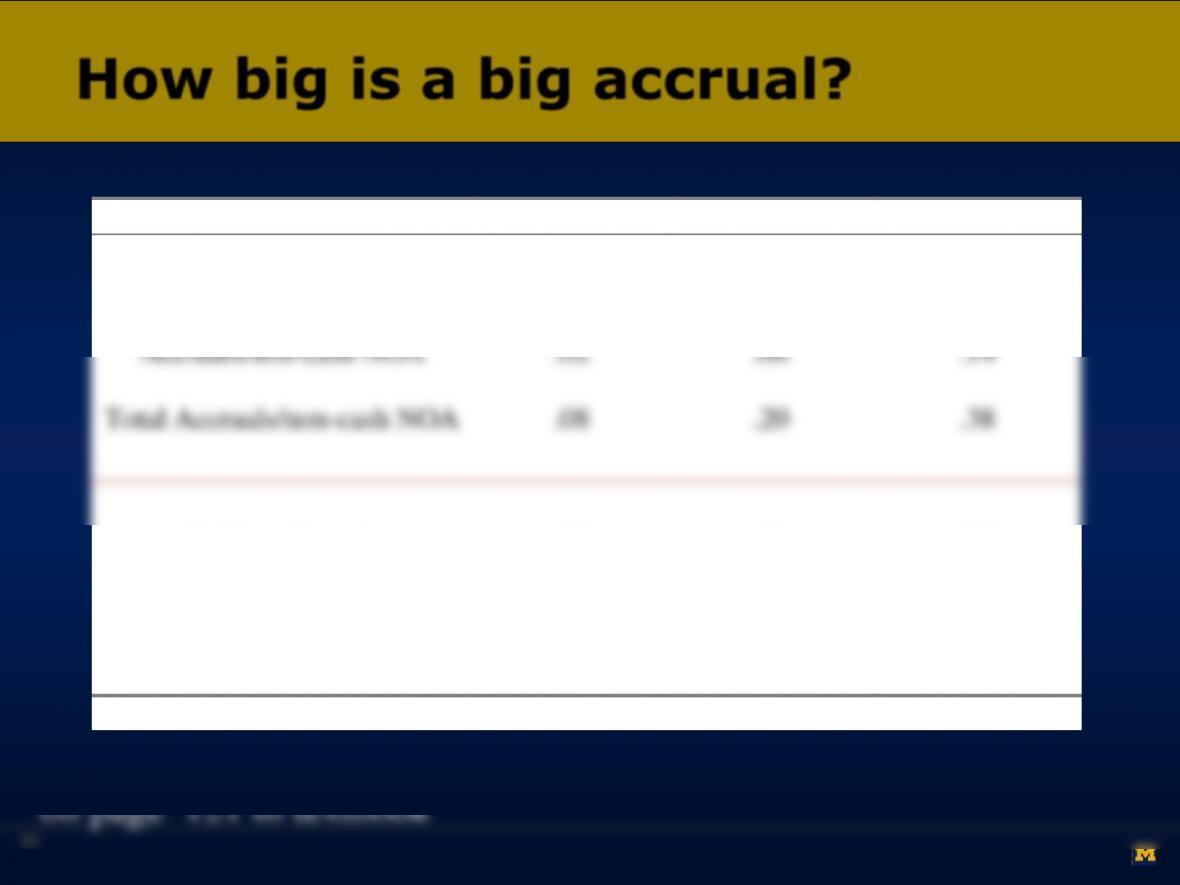
How big is a big accrual?
Accrual
50th percentile
75th percentile
90th percentile
Current Operating
Accruals/non-cash NOA
.01
.05
.11
Non-Current Operating
Accruals/non-cash NOA
.02
.06
.14
Total Accruals/non-cash NOA
.08
.20
.38
Interaction
.00
.02
.07
23
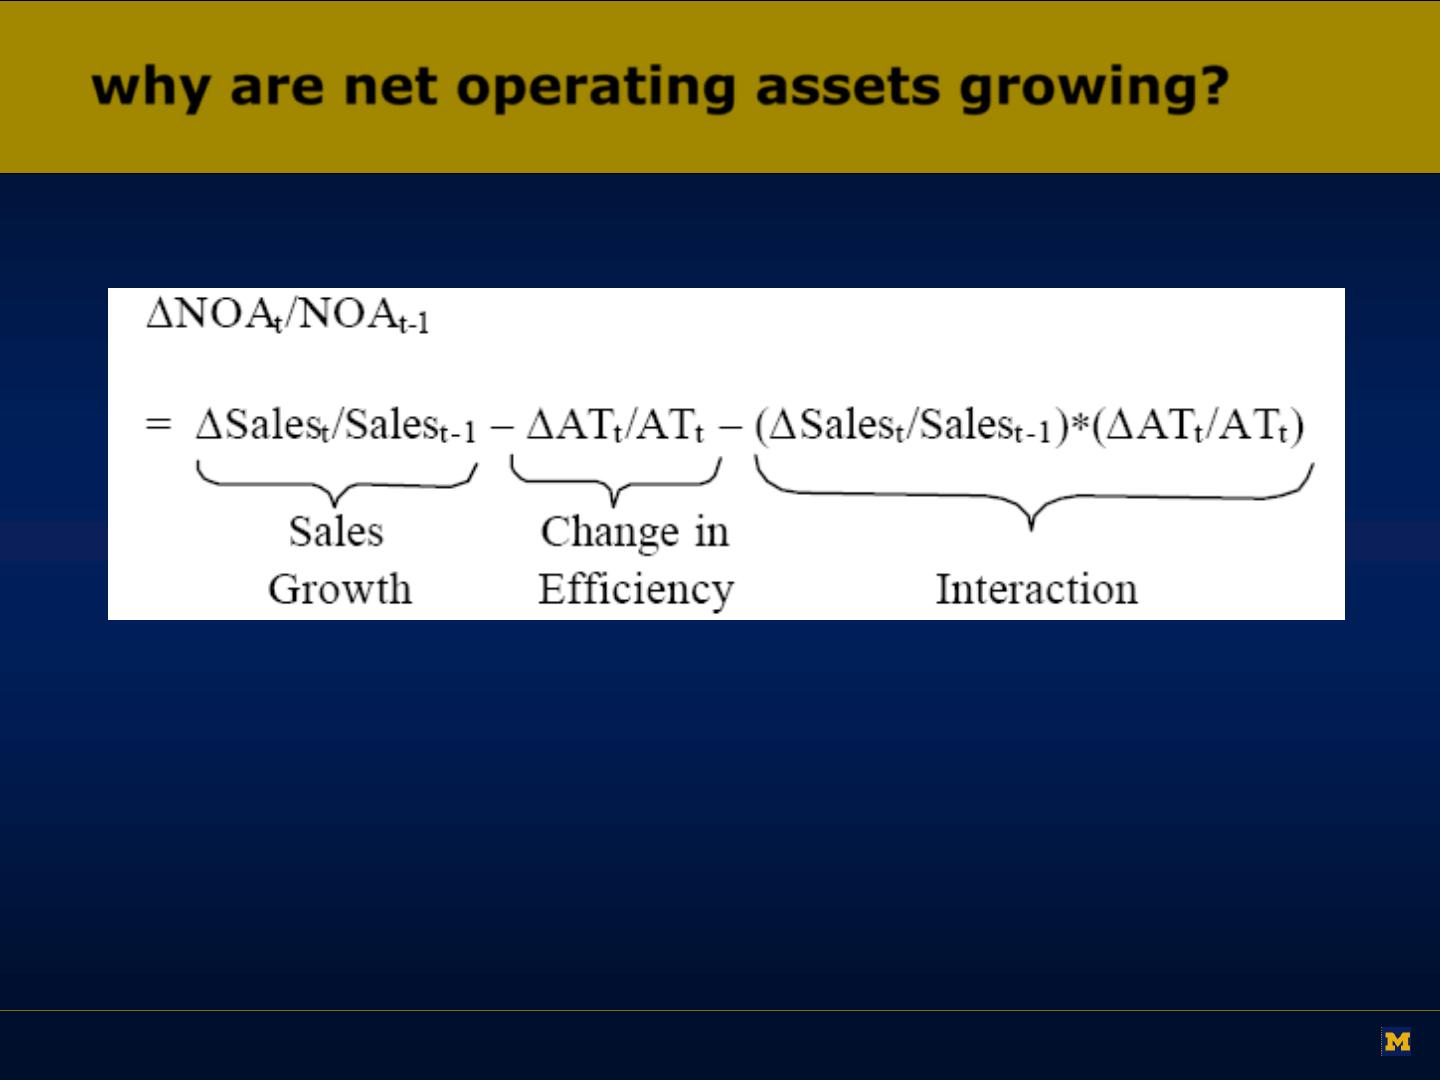
why are net operating assets growing?
which cause of NOA growth is best? which is the worst?
24
Richardson, Sloan, Soliman, Tuna (2002)