⚫
⚫
⚫
⚫
⚫
⚫
⚫
⚫
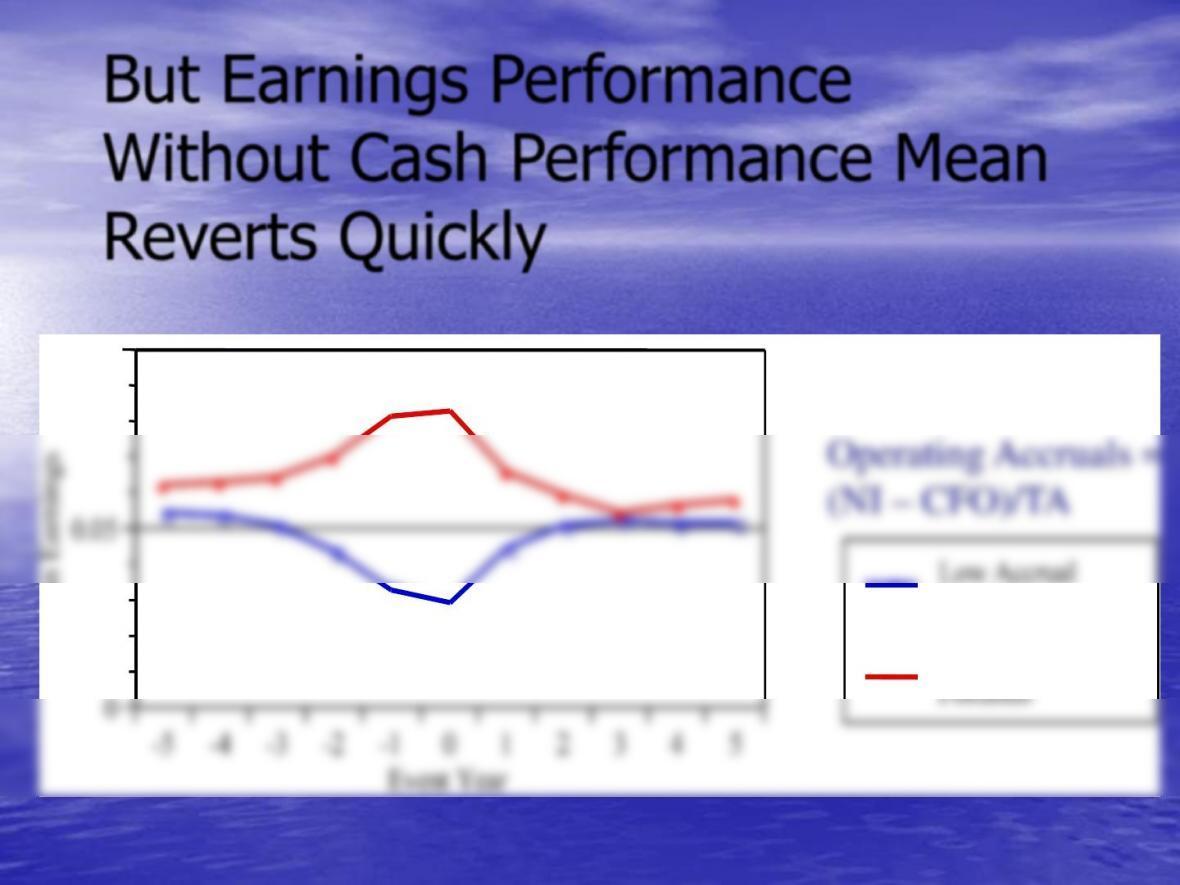
-5
-4
-3
-2
-1
0
1
2
3
4
5
0
0.05
0.1
Mean Earnings
Event Year
Low Accrual
Portfolio
⚫
High Accrual
Portfolio
But Earnings Performance
Without Cash Performance Mean
Reverts Quickly
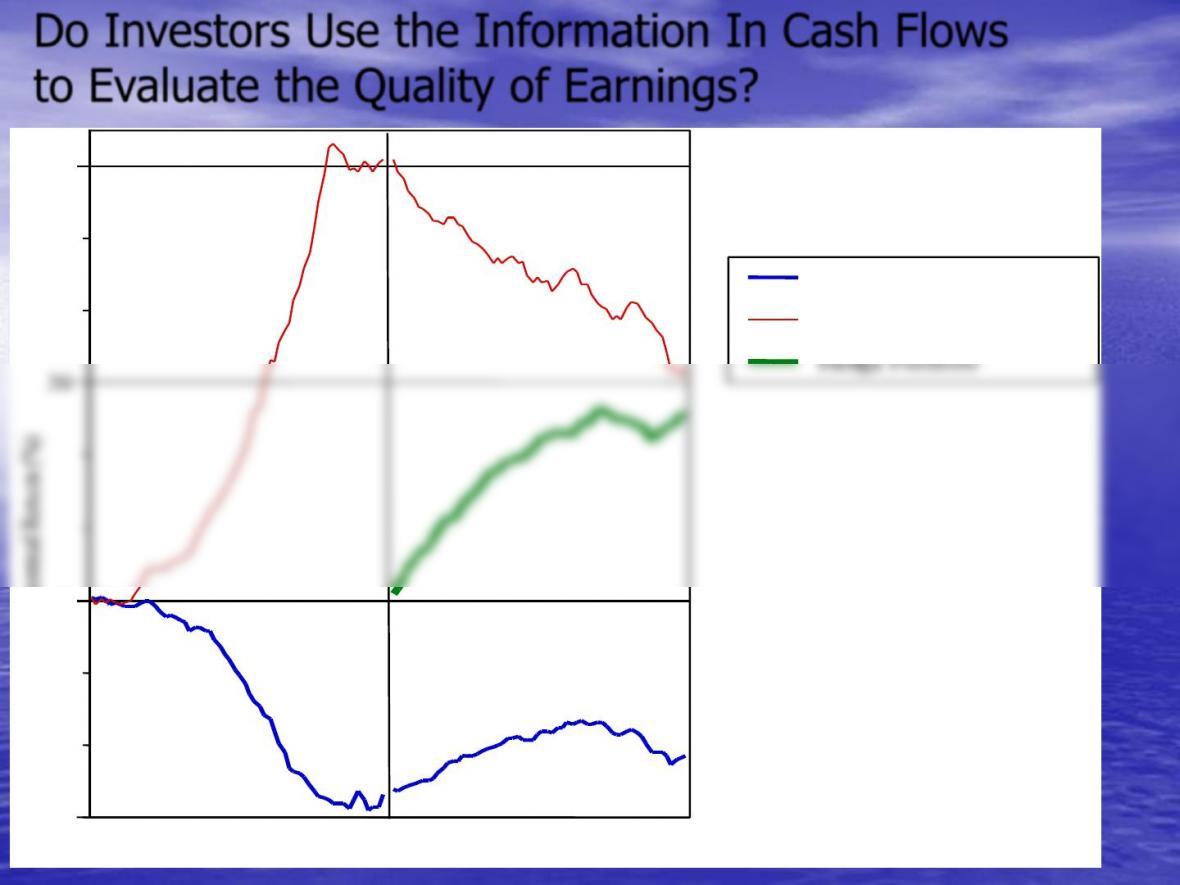
Do Investors Use the Information In Cash Flows
to Evaluate the Quality of Earnings?
-60
-48
-36
-24
-12
0
12
24
36
48
60
-30
0
30
60
Cumulative Abnormal Return (%)
Event Month
Lowest Accrual Portfolio
Highest Accrual Portfolio
Hedge Portfolio
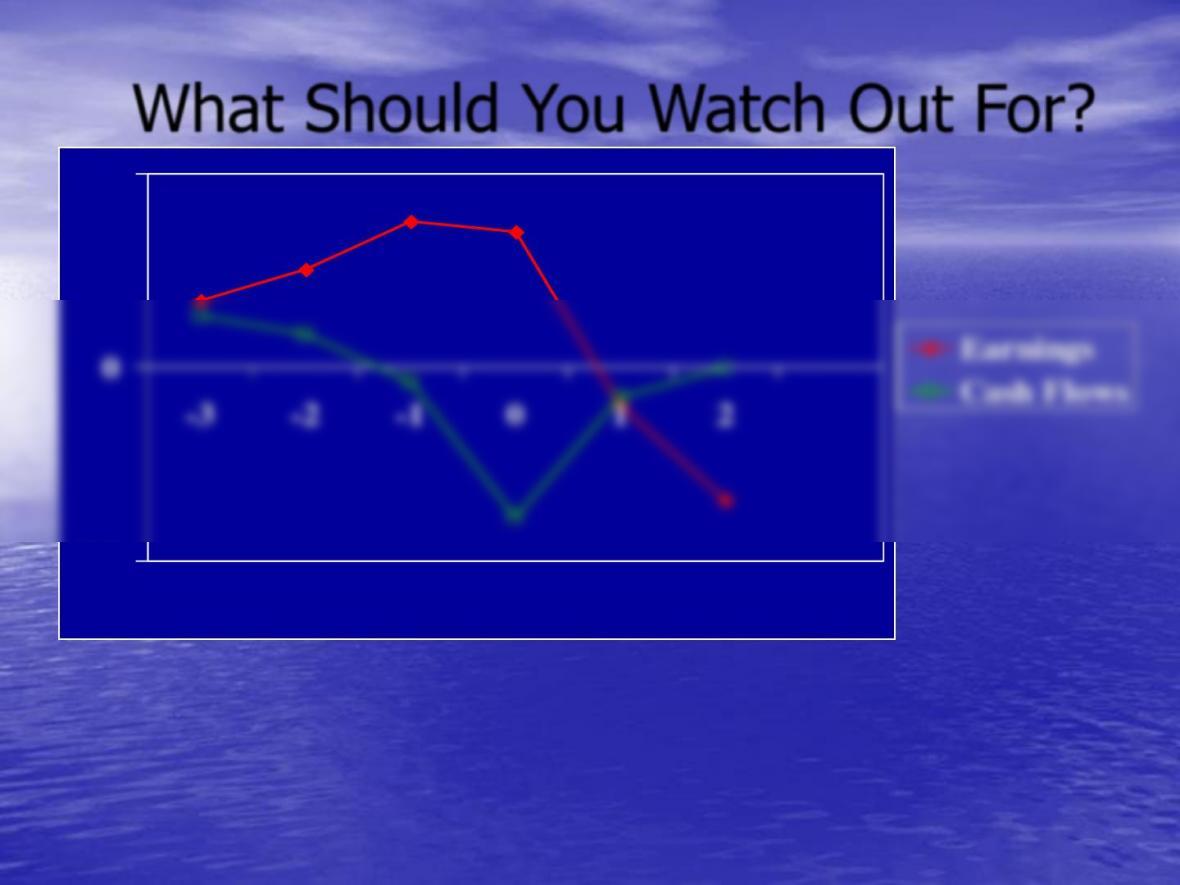
What Should You Watch Out For?
-0.1
0
0.1
-3 -2 -1 0 1 2
Year Relative to Earnings Manipulation
Earnings
Cash Flows
Average Earnings and Cash Flow Performance of Firms Sanctioned by
the SEC for Manipulating Earnings (Manipulation Occurs in Year 0)

Boston Chicken, 1996
Fiscal Years Ended
——————————————————-
December 25, 1994 December 31, 1995 December 29, 1996
—————– —————– —————–
<S> <C> <C> <C>
Cash Flows from Operating
Activities:
Net income……………………………………………… $ 16,173 $ 33,559 $ 66,958
——— ——– —————
Net cash provided by operating activities………….. 35,918 55,476 144,910
Issuance of notes receivable…………………………….. (225,282) (661,033) (1,467,065)
Repayment of notes receivable……………………………. 68,498 407,499 993,151
——— ——– —————
Net cash used in investing activities……………… (263,239) (321,855) (525,026)
——— ——– —————
Would Operating Accruals have
identified Boston Chicken’s distortion?
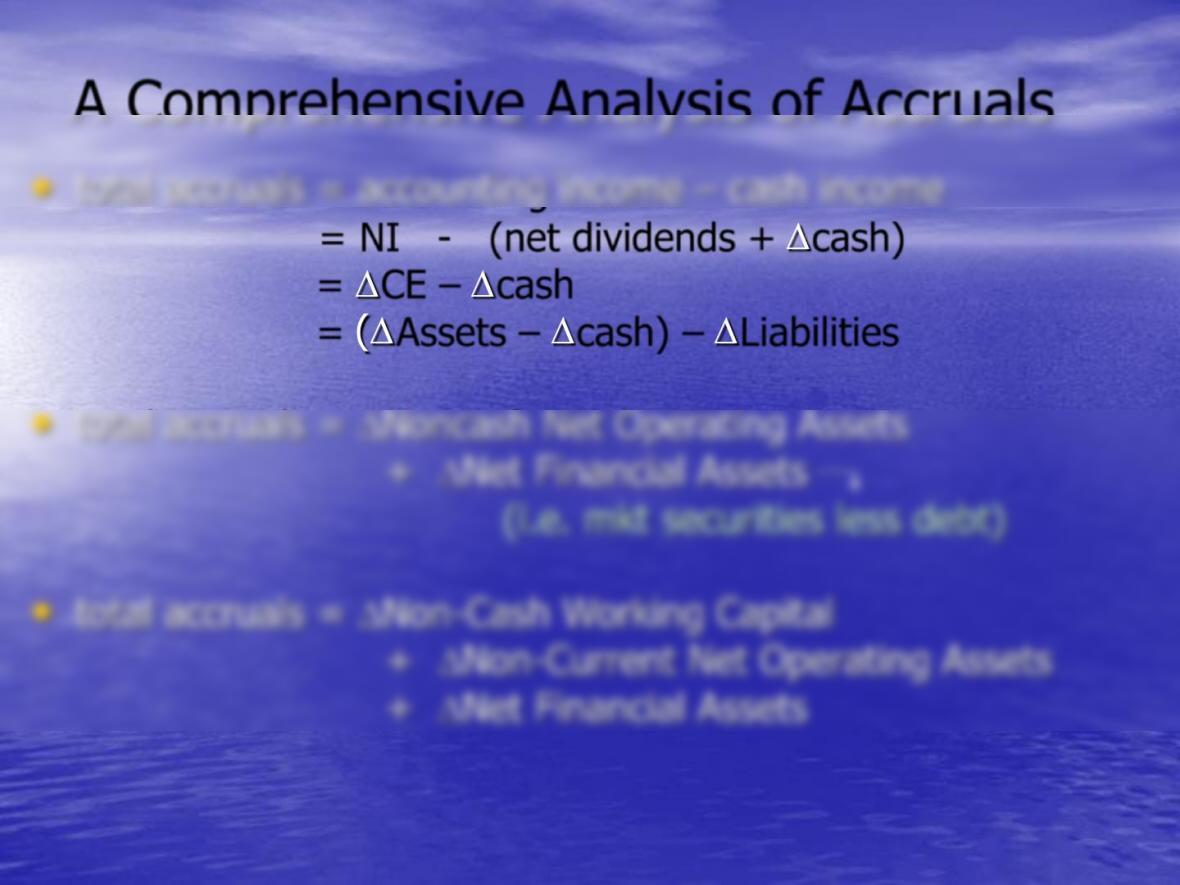
= NI – (net dividends + Dcash)
= DCE –Dcash
= (DAssets –Dcash) –DLiabilities
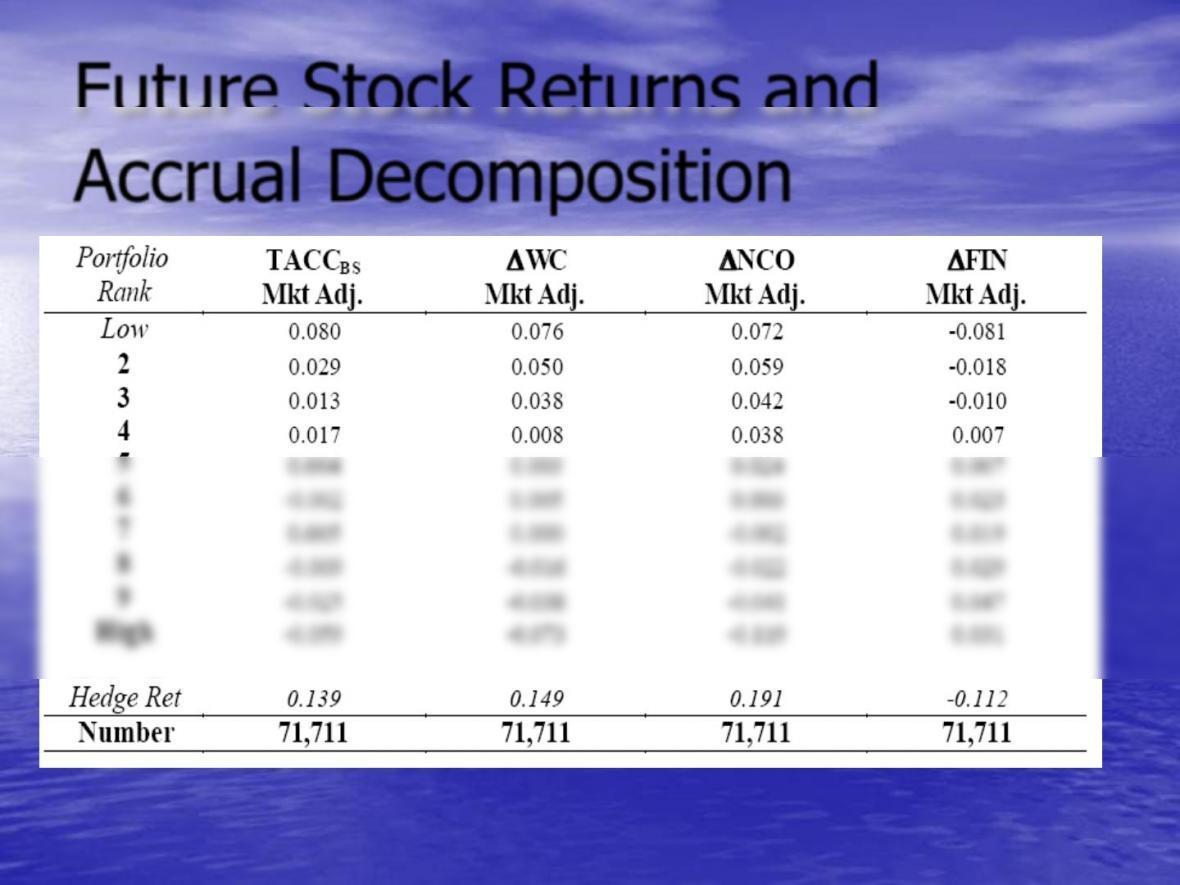
Accrual Decomposition
Richardson, Sloan, Soliman, Tuna (2002)
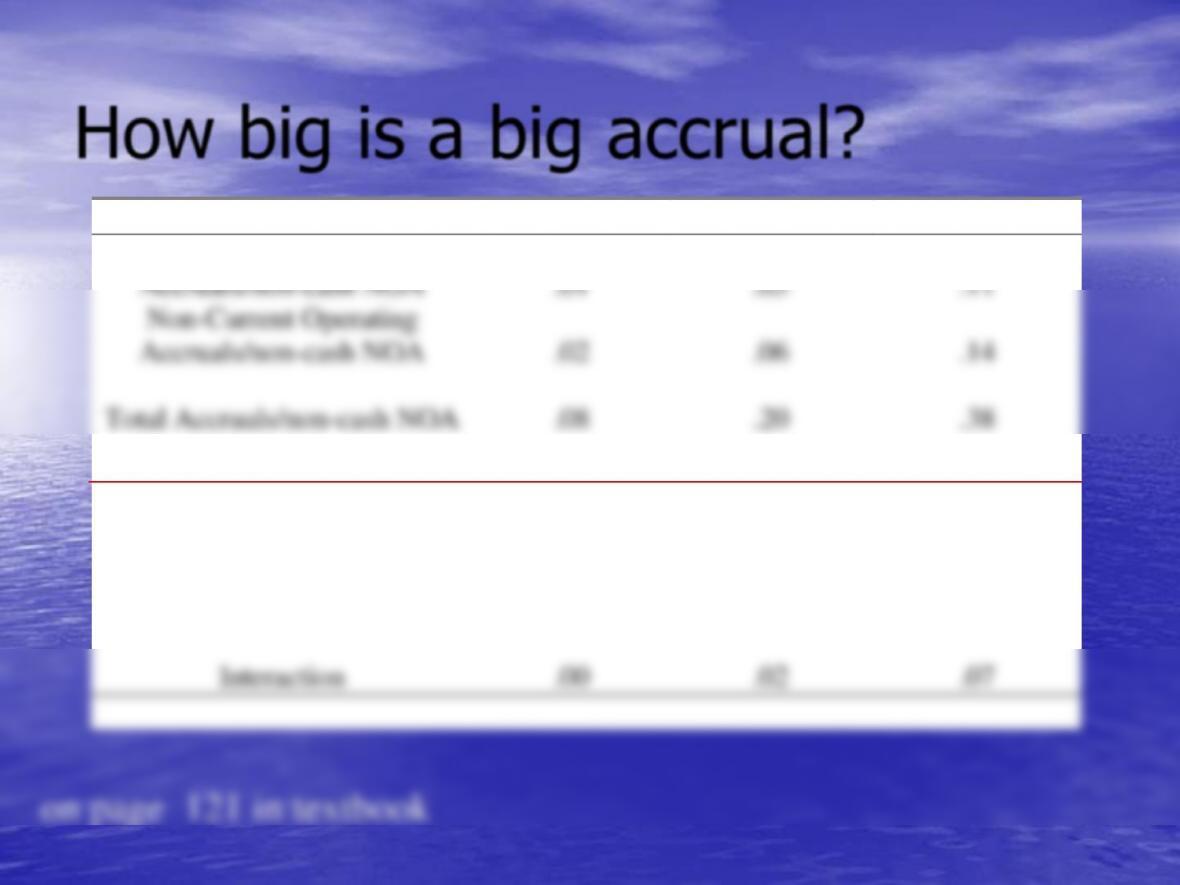
How big is a big accrual?
Accrual
50th percentile
75th percentile
90th percentile
Current Operating
Accruals/non-cash NOA
.01
.05
.11
Non-Current Operating
Accruals/non-cash NOA
.02
.06
.14
Total Accruals/non-cash NOA
.08
.20
.38
Increase in NOA turnover
.00
-.08
-.21
Interaction
.00
.02
.07
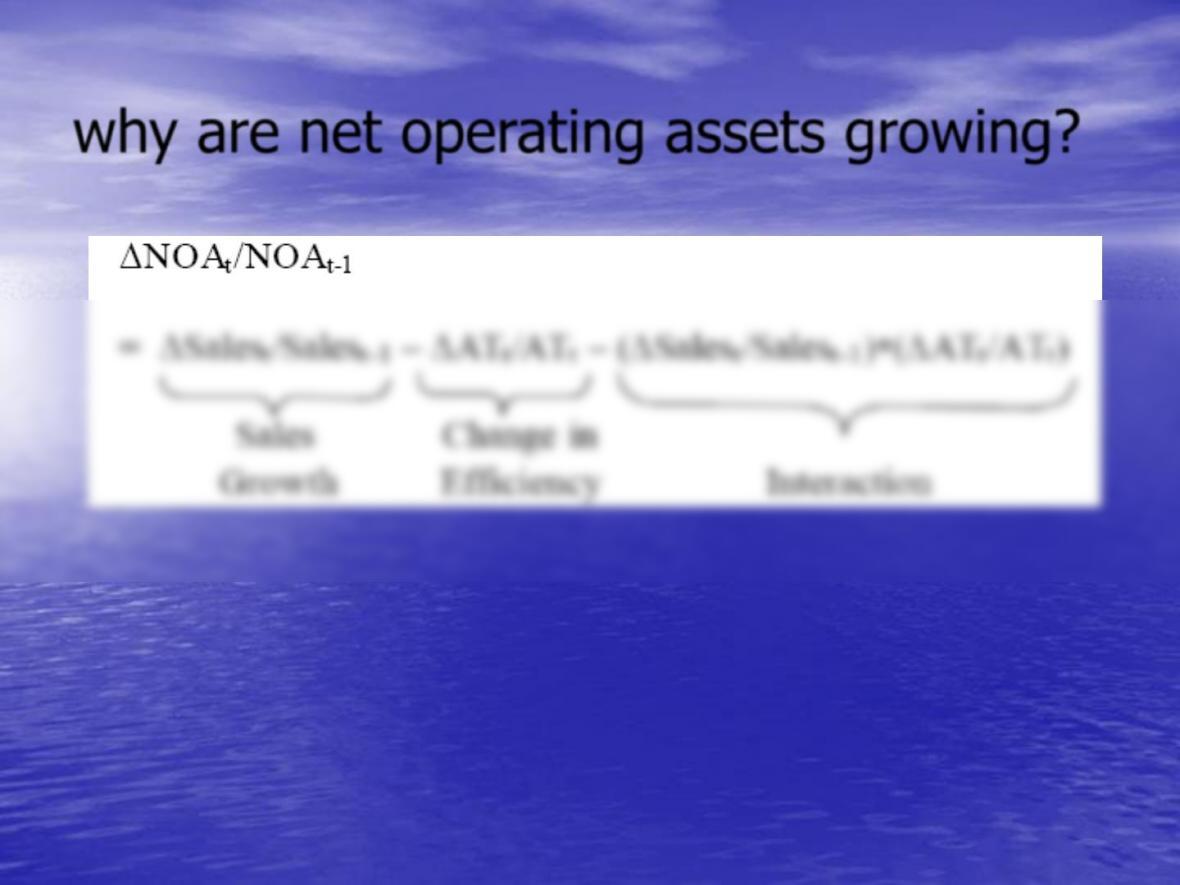
why are net operating assets growing?
which cause of NOA growth is best? which is the worst?
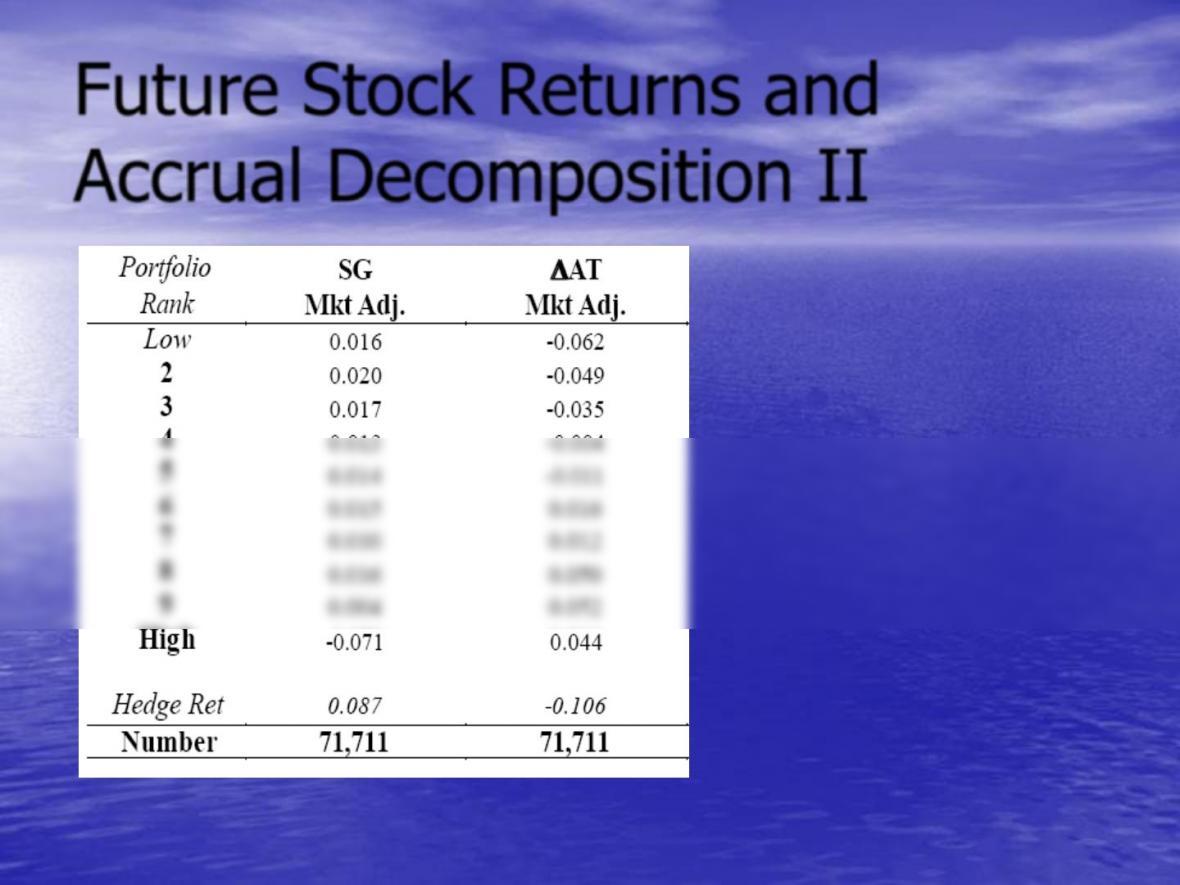
Future Stock Returns and
Accrual Decomposition II
Richardson, Sloan, Soliman, Tuna (2002)