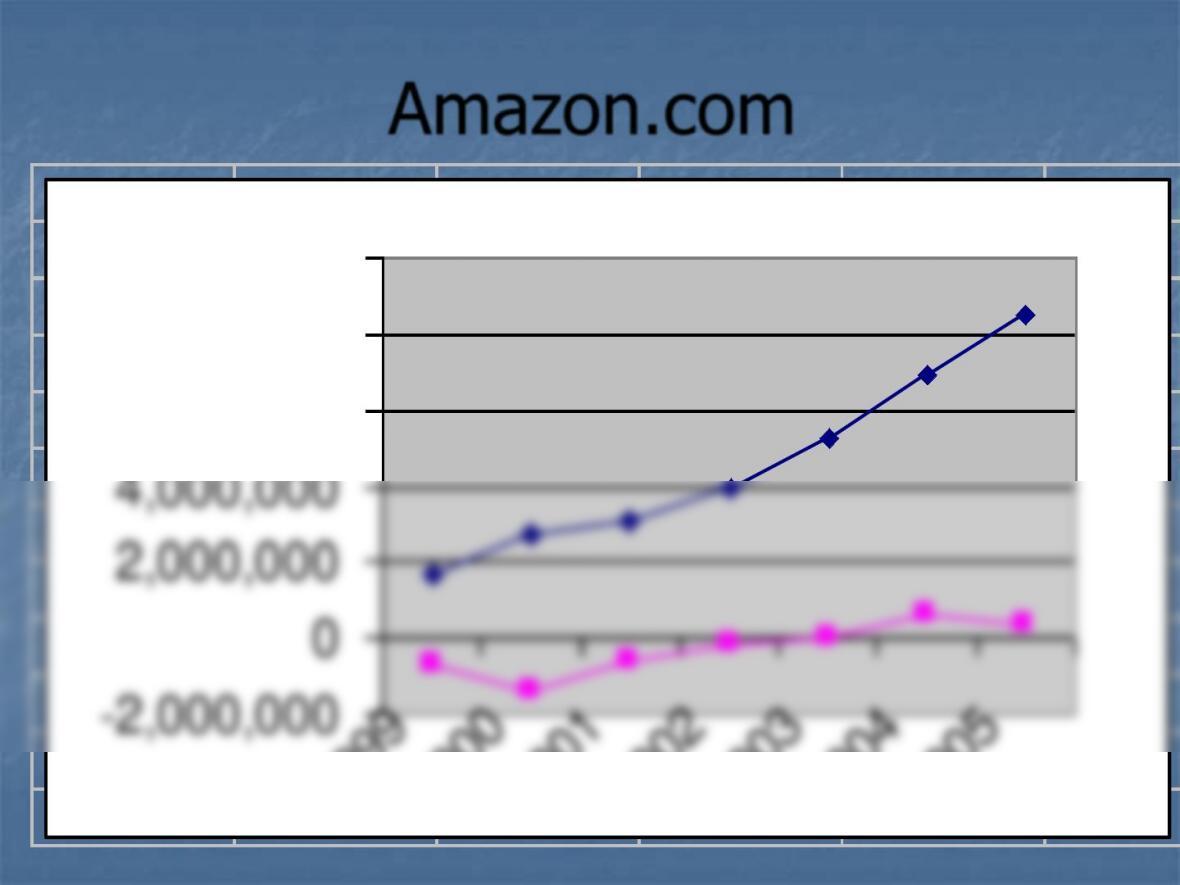
Amazon.com
–2,000,000
0
2,000,000
4,000,000
6,000,000
8,000,000
10,000,000
1999
2000
2001
2002
2003
2004
2005
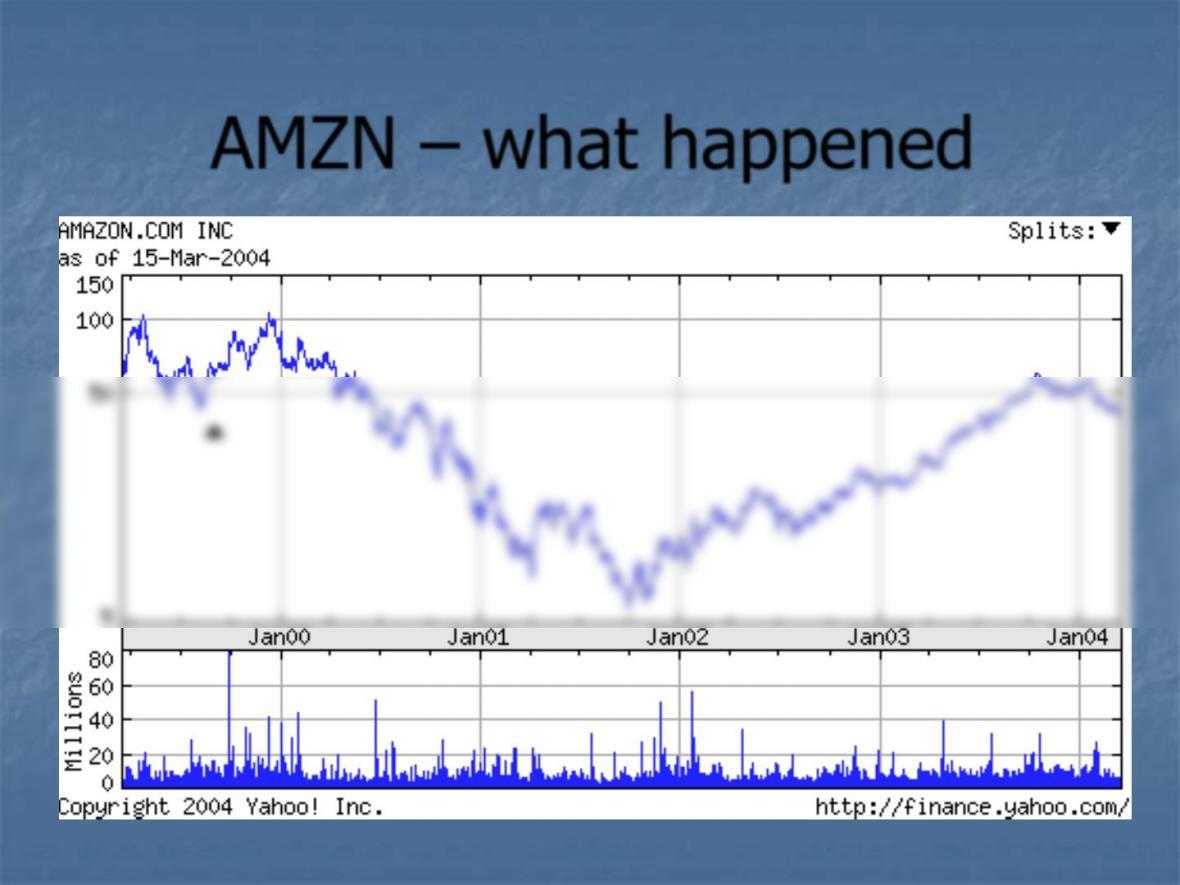
AMZN –what happened
Key takeaways from AMZN
◼ALWAYS forecast complete income
statements and balance sheets in order to
arrive at free cash flow forecasts.
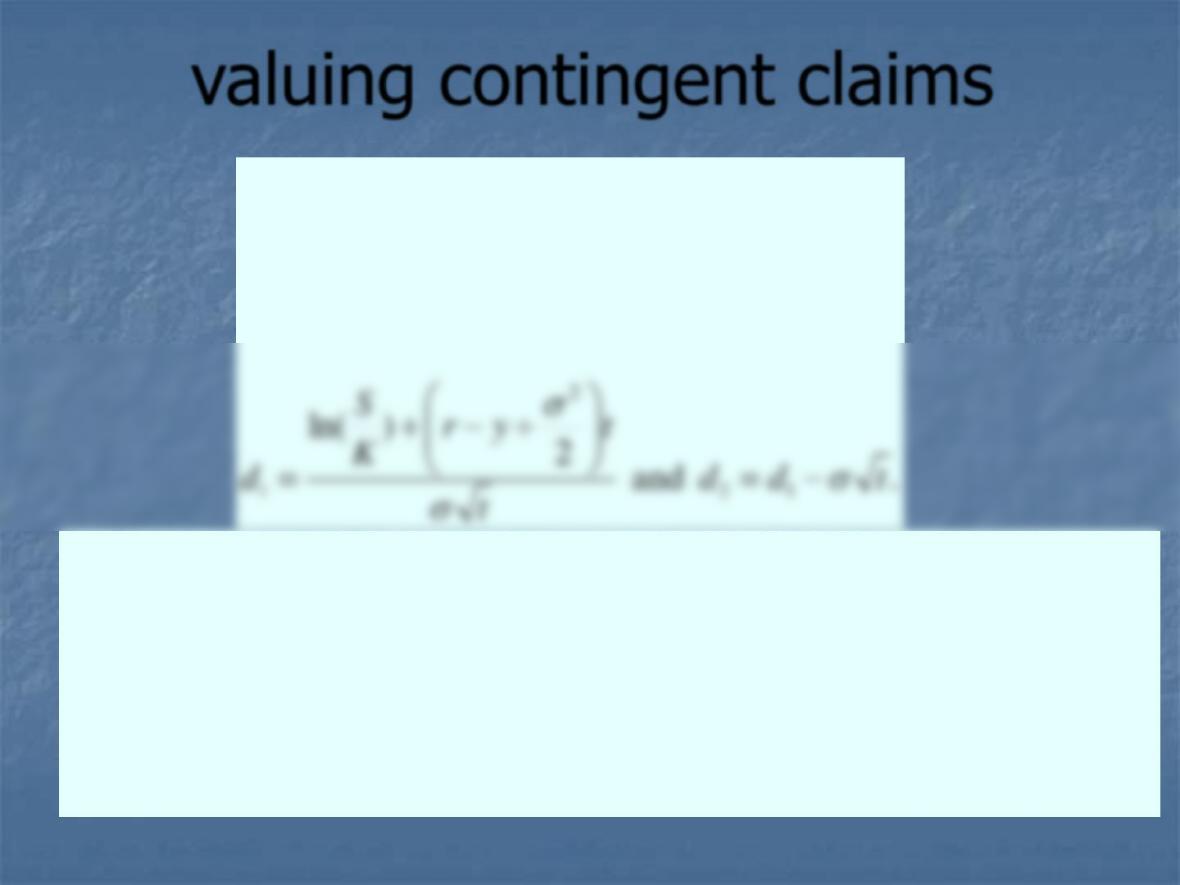
valuing contingent claims
. and
2
)ln(
)()(Se
12
2
1
21
–yt
tdd
t
tyr
K
S
d
where
dNKedNeoptionvalu rt
−=
+−+
=
−= −
S = the current stock price,
K = the exercise or “strike” price,
y = the long-term forecasted annual dividend yield,
r = the annual risk-free interest rate,
t = the number of years before the option expires,
= the standard deviation of the log of the value of the stock price, and
N(•) = the cumulative standard normal distribution function.
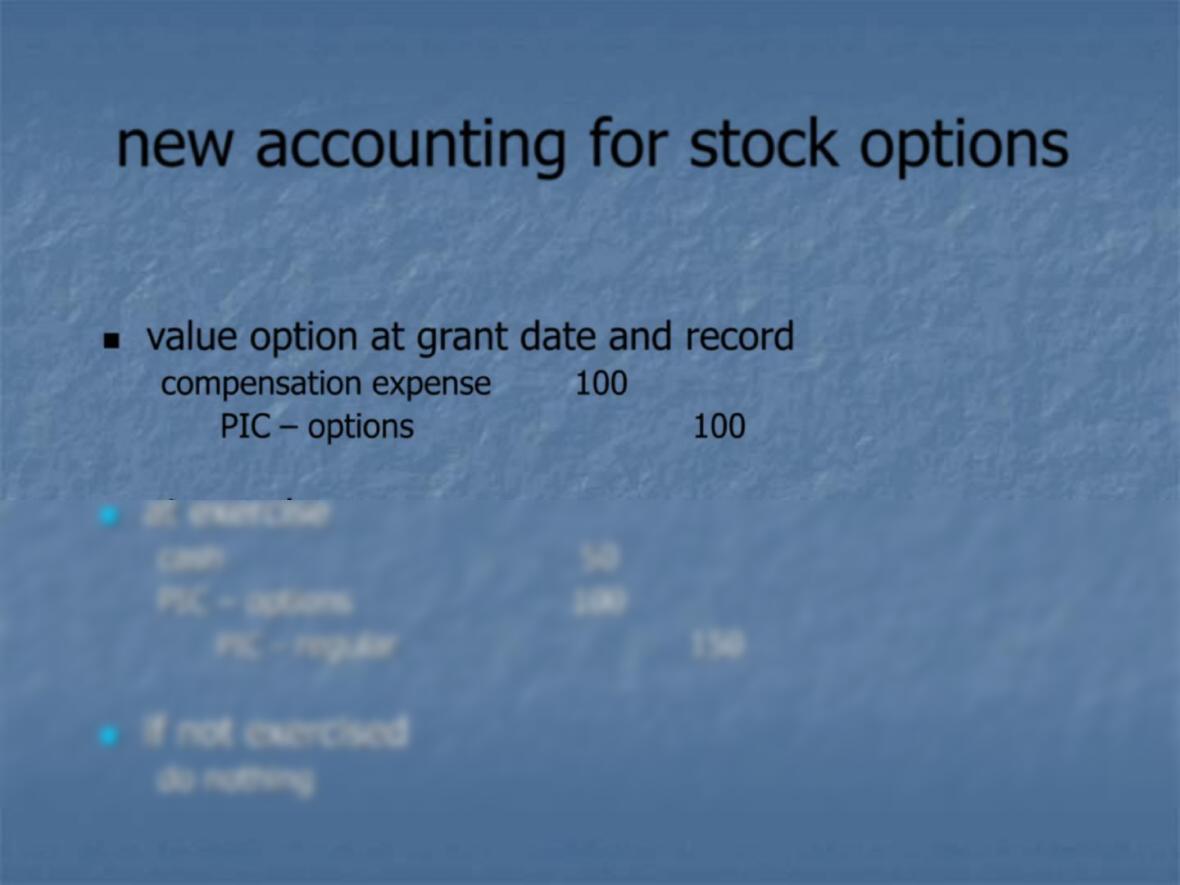
new accounting for stock options
◼value option at grant date and record
compensation expense 100
PIC –options 100
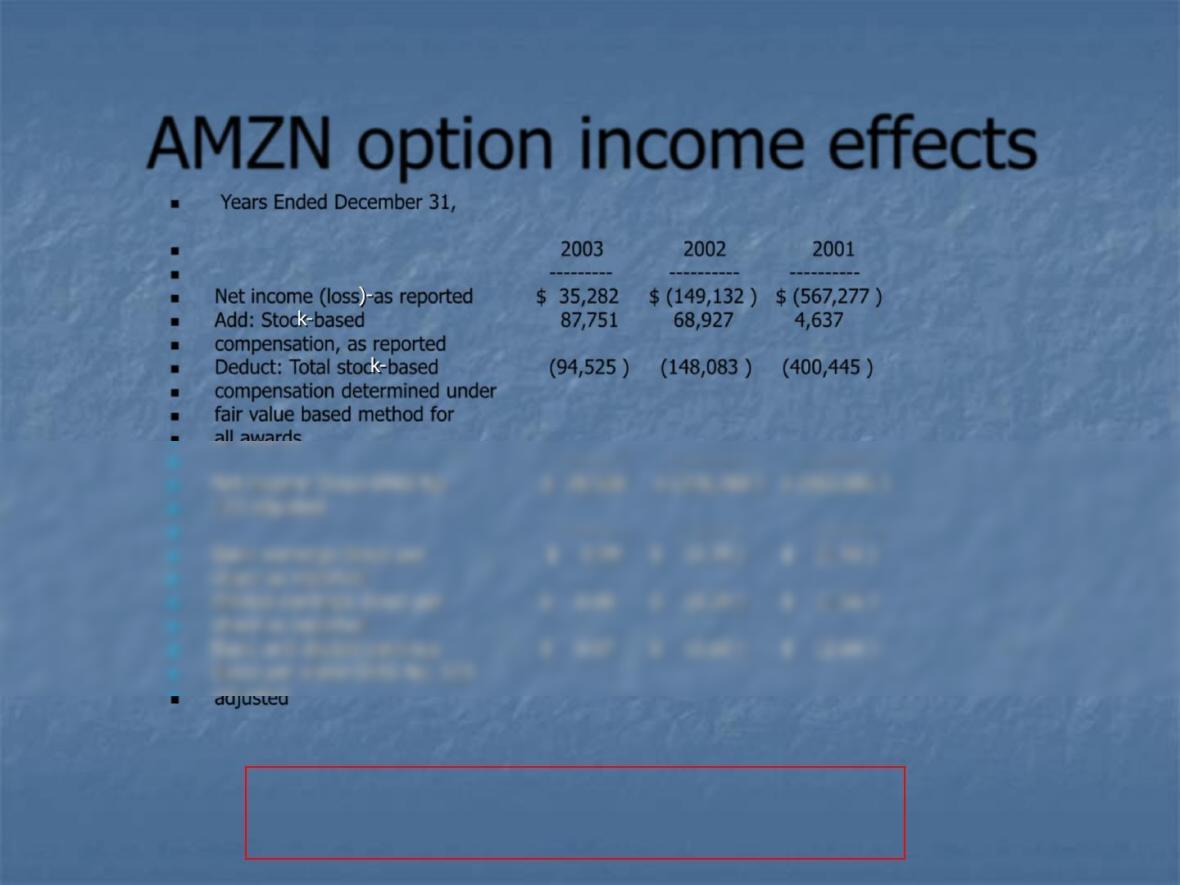
AMZN option income effects
◼Years Ended December 31,
◼2003 2002 2001
◼——— ———- ———-
◼Net income (loss)–as reported $ 35,282 $ (149,132 ) $ (567,277 )
◼Add: Stock–based 87,751 68,927 4,637
◼compensation, as reported
◼Deduct: Total stock–based (94,525 ) (148,083 ) (400,445 )
◼compensation determined under
◼fair value based method for
◼adjusted
For S&P 500, expensing options would lower
EPS by 20% in 2001. (Bear Stearns)