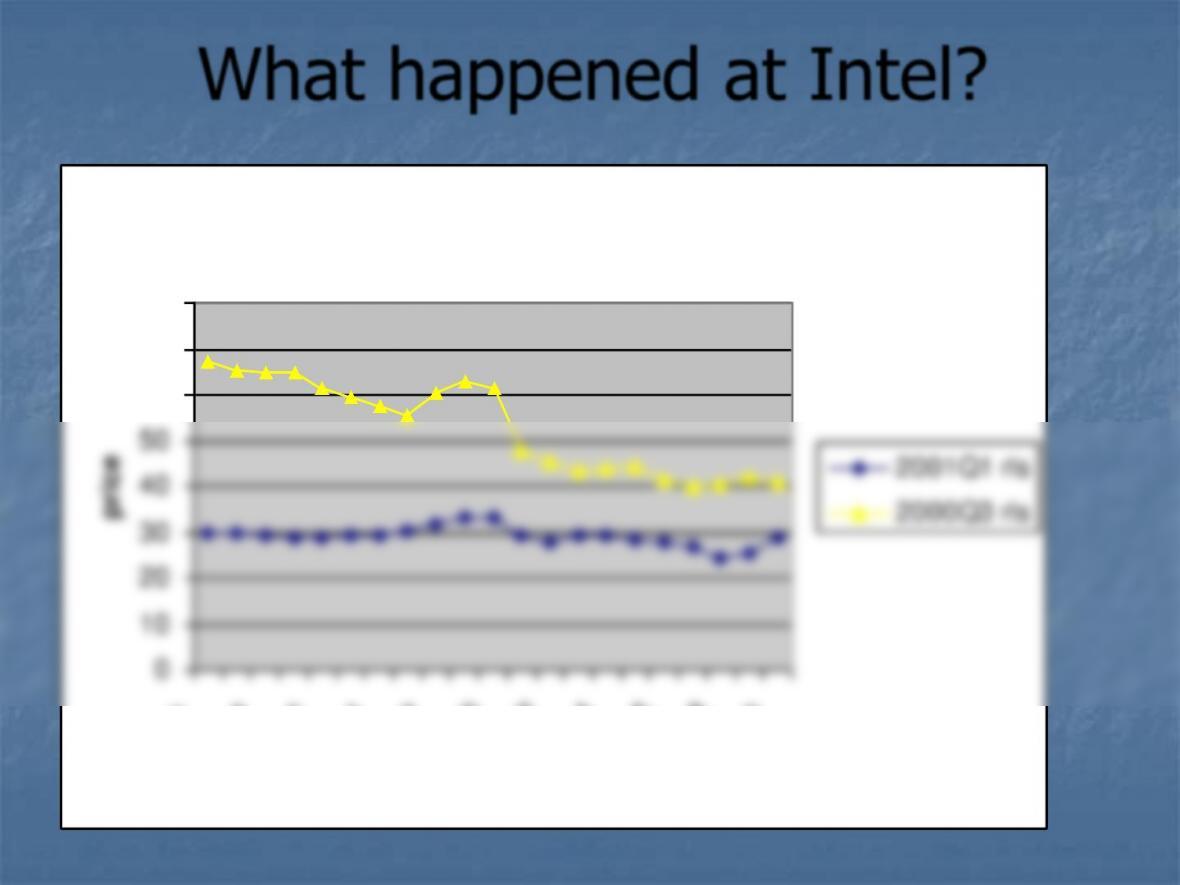
INTC earnings warnings
0
10
20
30
40
50
60
70
80
–10
-8
-6
-4
-2
0
2
4
6
8
10
days relative to announcement
price
2001Q1 rls
2000Q3 rls
What happened at Intel?
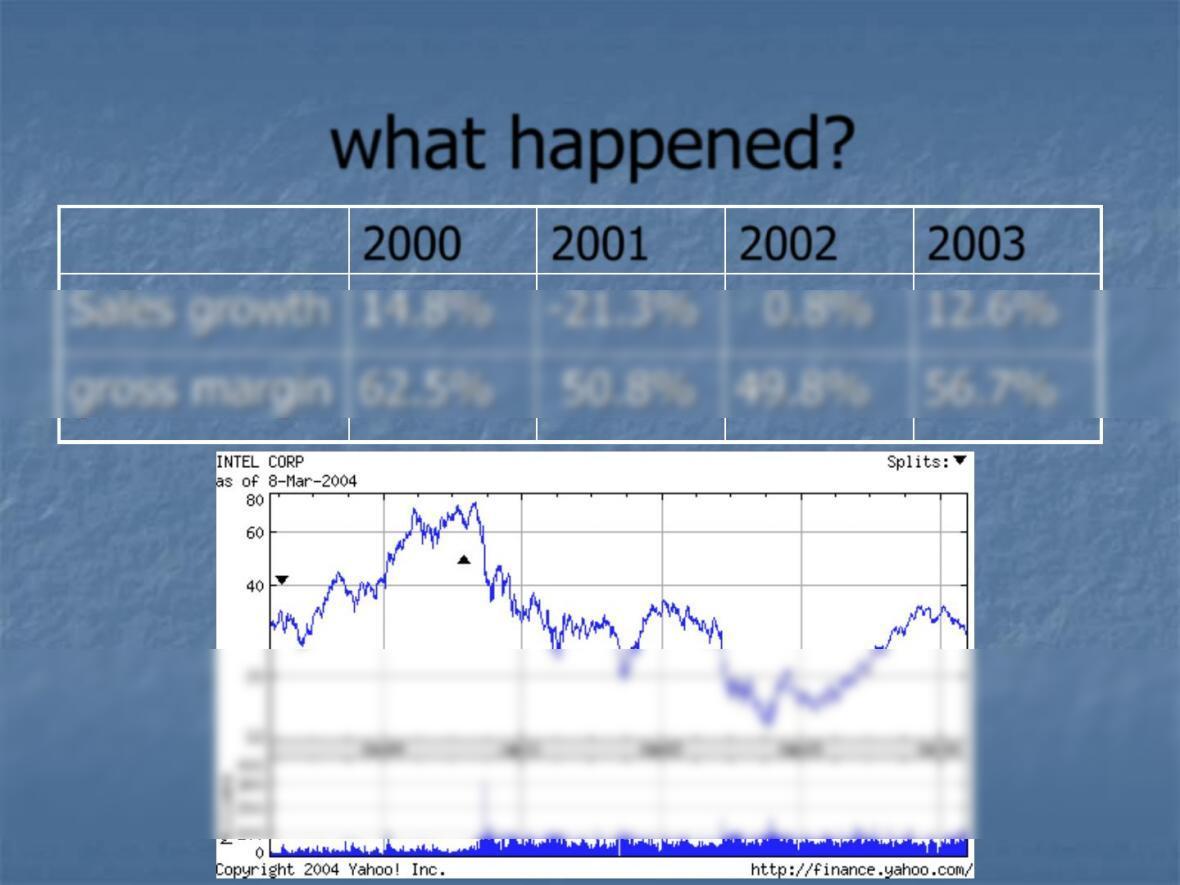
what happened?
2000 2001 2002 2003
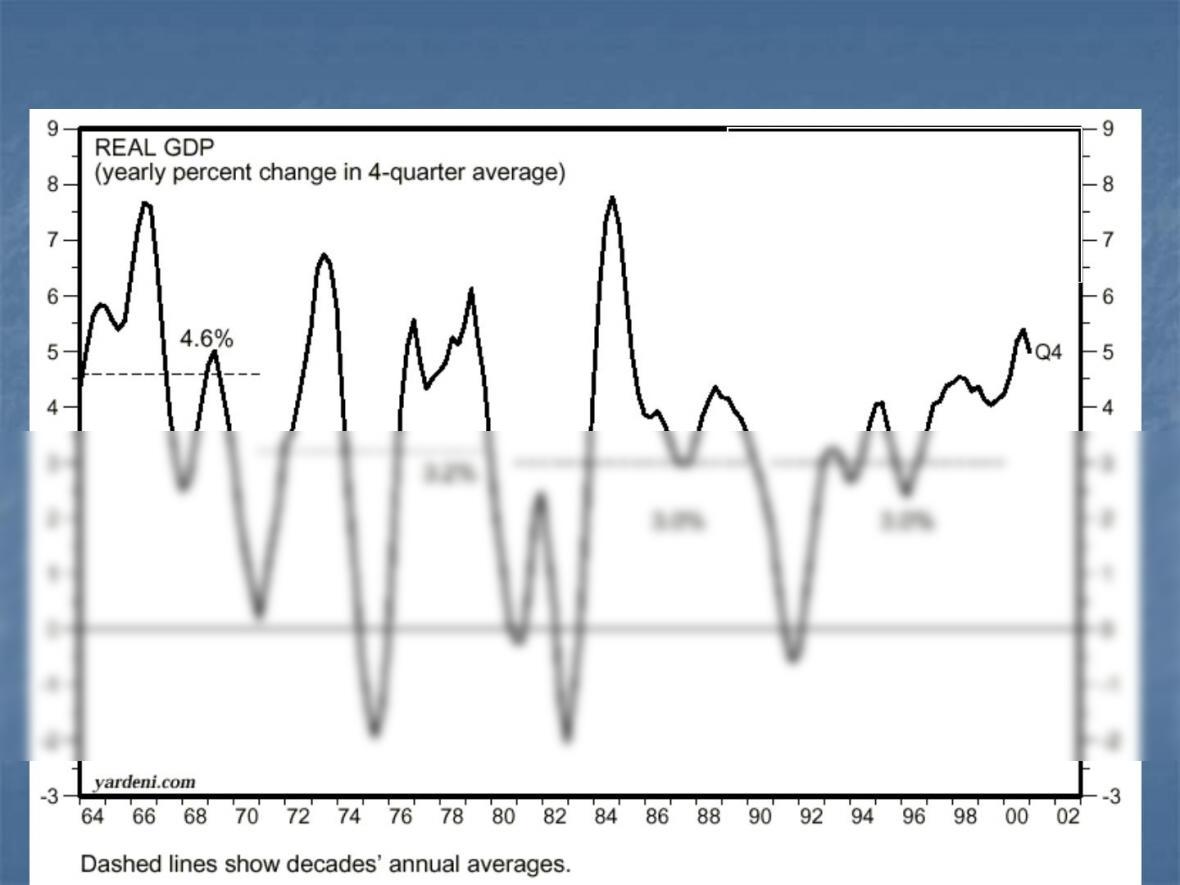
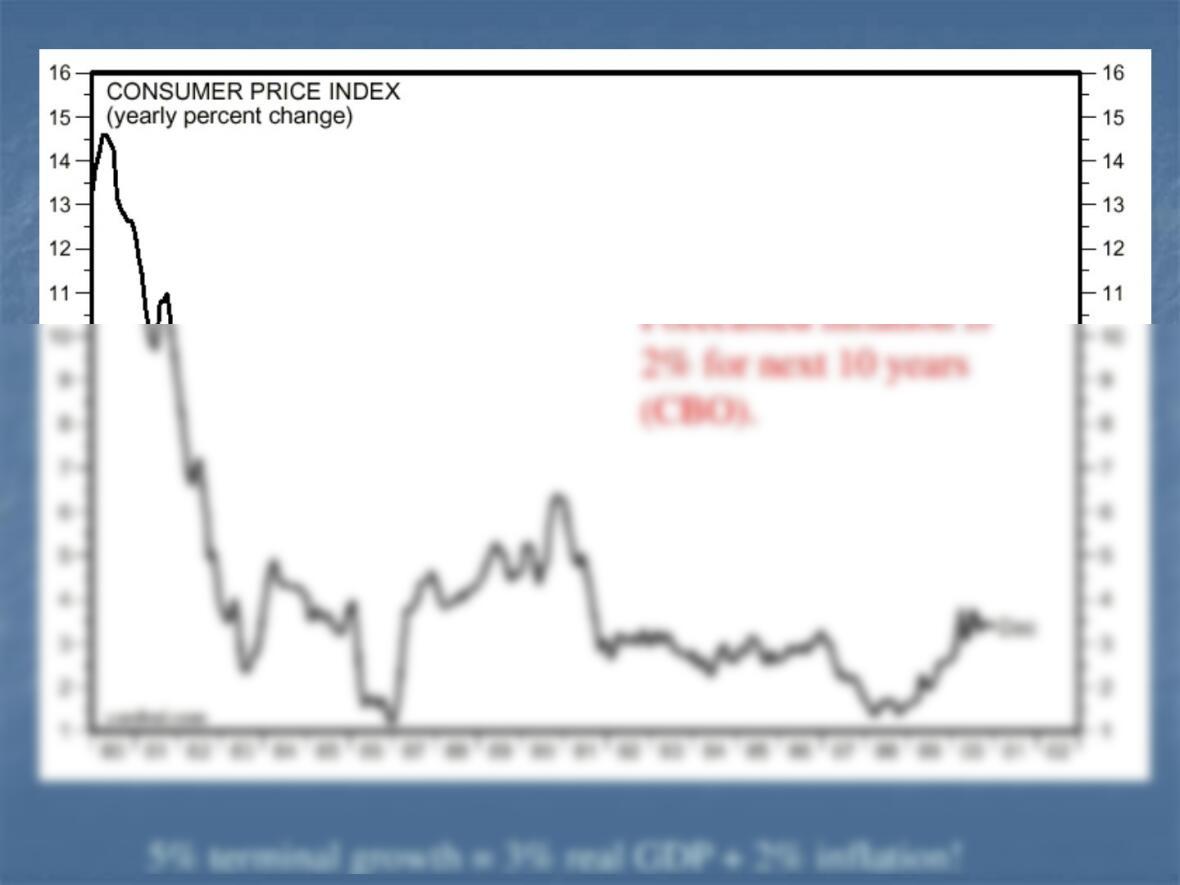
forecasted real
growth for next 10
years is 3% (CBO)
Why is the terminal sales growth 5% in eVal?
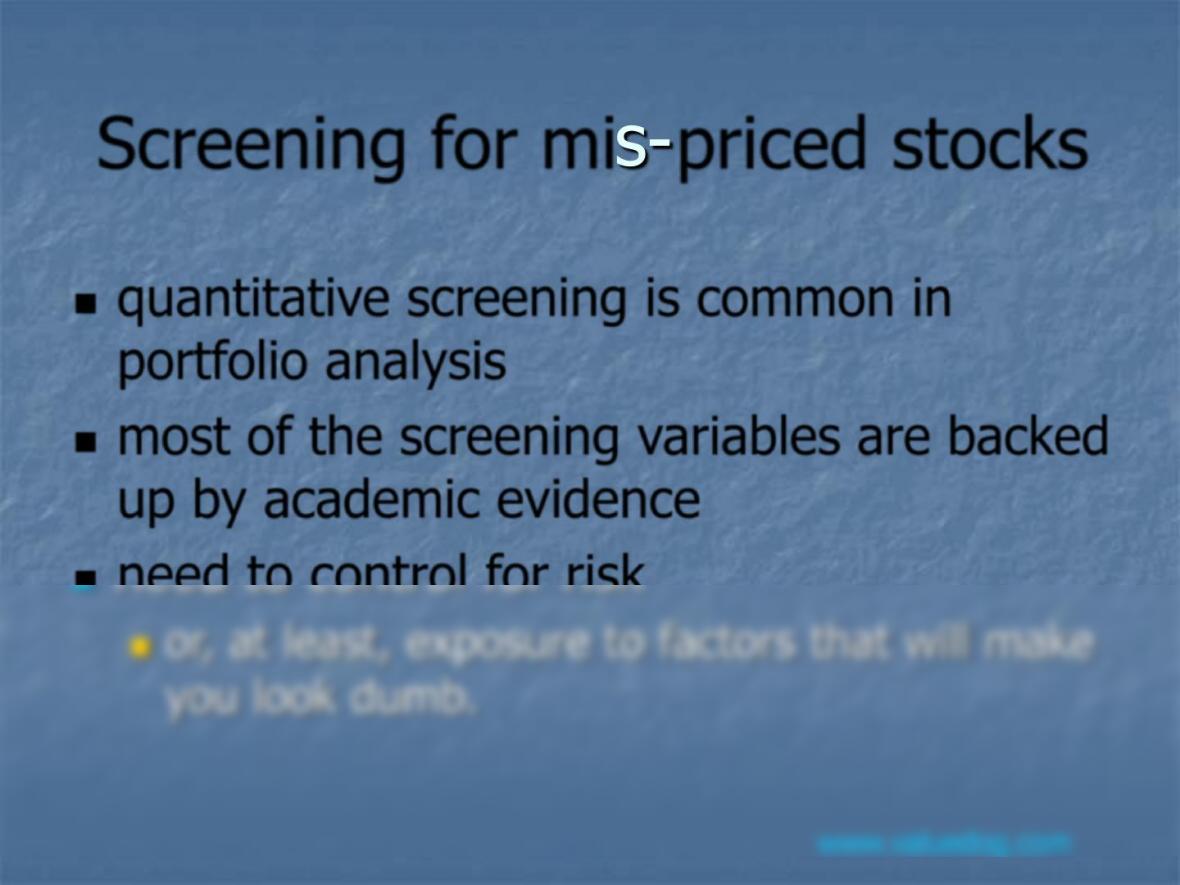
Screening for mis–priced stocks
◼quantitative screening is common in
portfolio analysis
◼most of the screening variables are backed
up by academic evidence
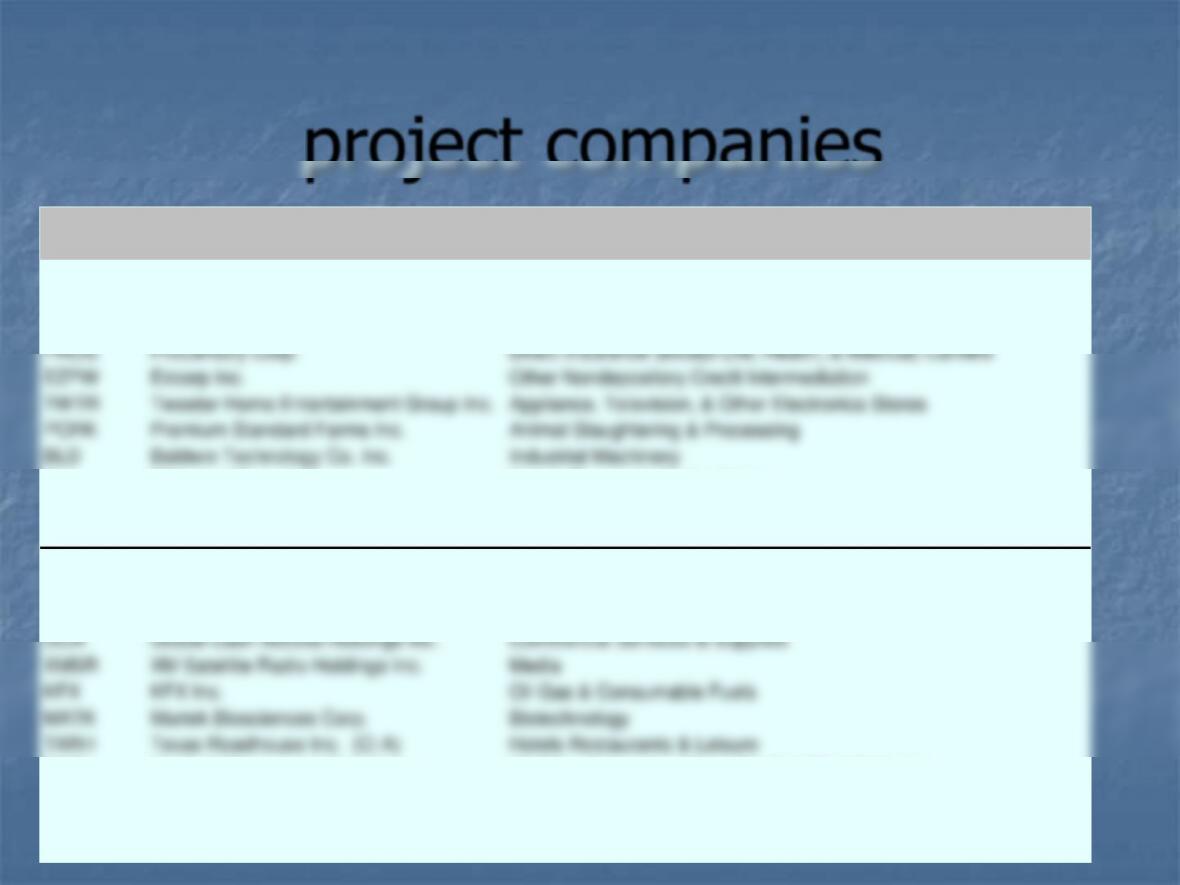
Company NAICS
Symbol Company Name Ind
IIIN Insteel Industries Inc. Spring & Wire Product Manufacturing
PRLS Peerless Systems Corp. Software Publishers
MWRK Mothers Work Inc. Women’s Clothing Stores
PROS ProCentury Corp. Direct Insurance (except Life, Health, & Medical) Carriers
BAMM Books-A-Million Inc. Specialty Retail
GMR General Maritime Corp. Deep Sea, Coastal, & Great Lakes Water Transportation
JBLU JetBlue Airways Corp. Airlines
RMBS Rambus Inc. Consumer Finance
GCA Global Cash Access Holdings Inc. Commercial Services & Supplies
CYBX Cyberonics Inc. Navigational, Meas, Electromedical, & Control Instruments Manufactu
HRB H&R Block Inc. Accounting, Tax Preparation, Bookkeeping, & Payroll Services
NLS Nautilus Inc. Sporting & Athletic Goods Manufacturing
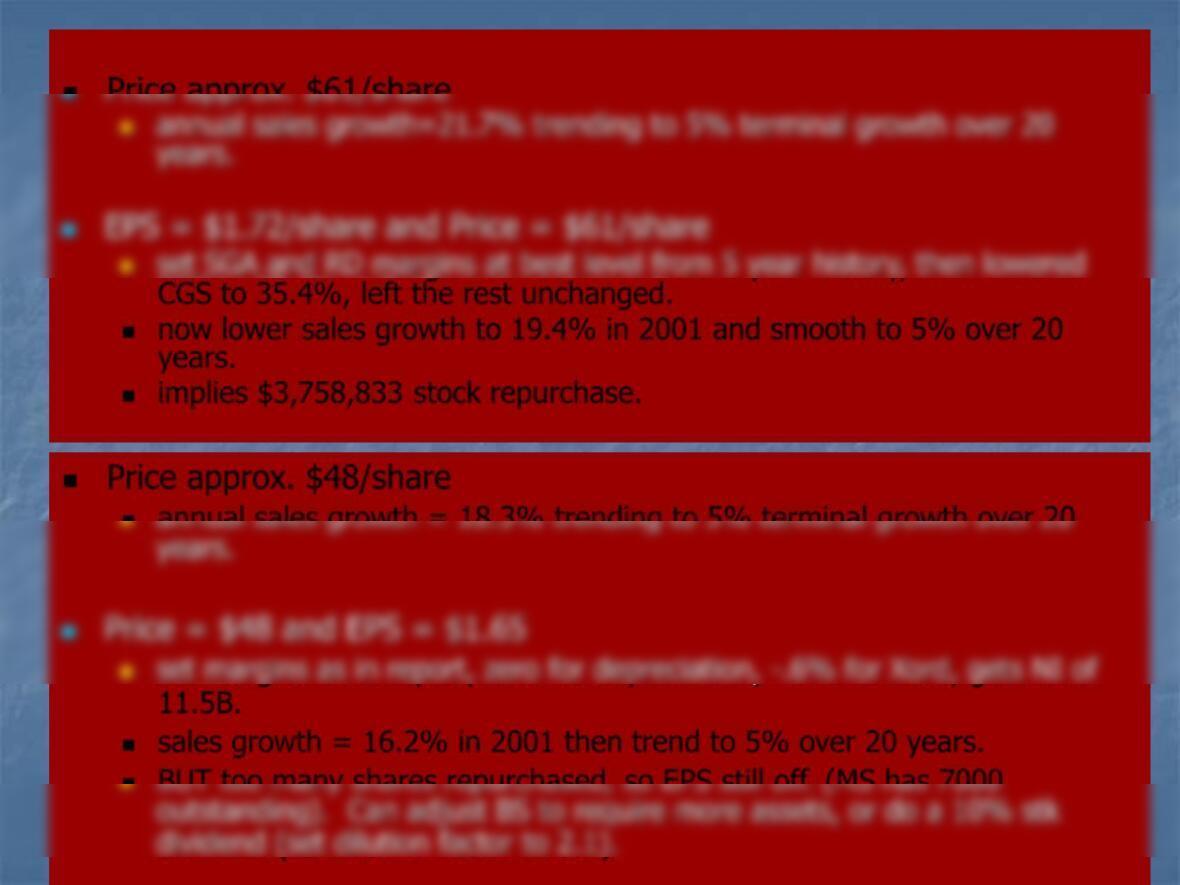
CGS to 35.4%, left the rest unchanged.
◼now lower sales growth to 19.4% in 2001 and smooth to 5% over 20
years.
◼implies $3,758,833 stock repurchase.
◼Price approx. $48/share
11.5B.
◼sales growth = 16.2% in 2001 then trend to 5% over 20 years.
My Intel Inputs