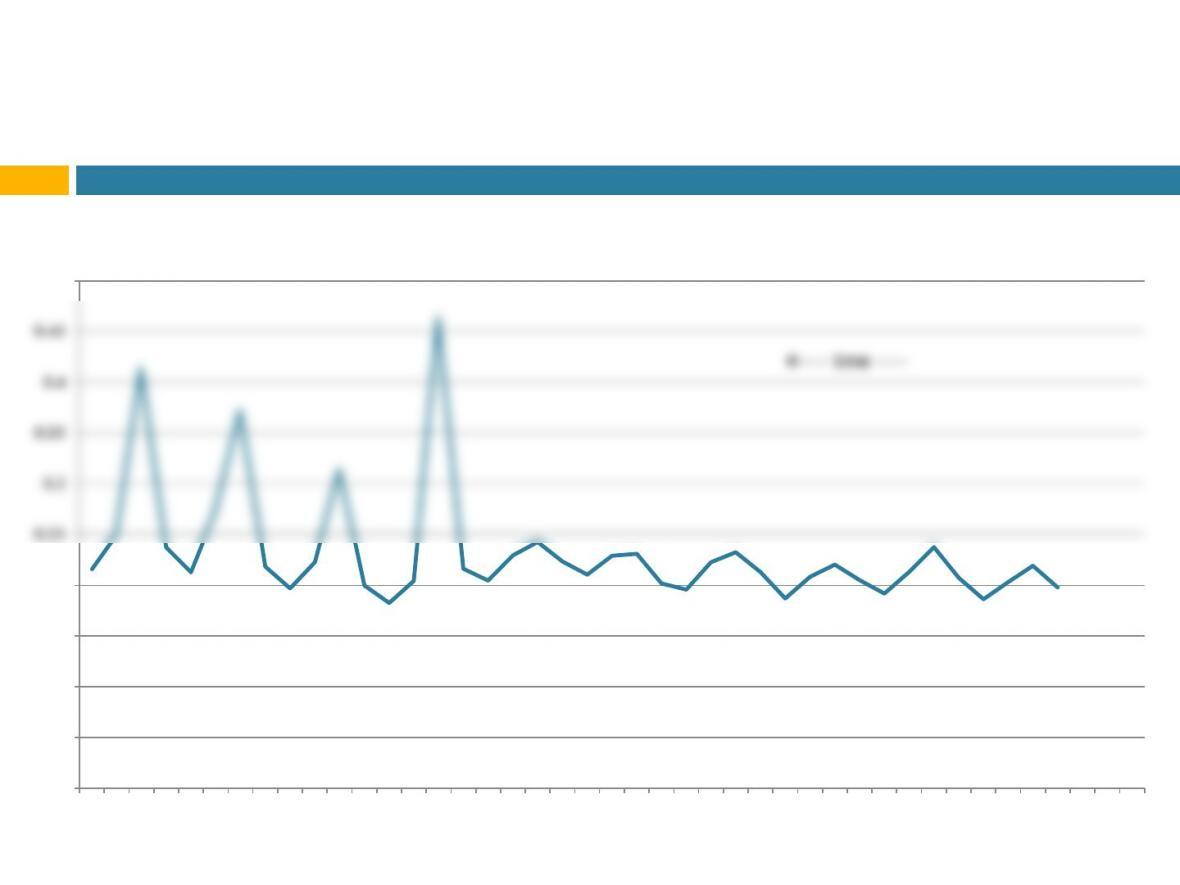
seasonality in SGA/Sales (HD)?
0
0.05
0.1
0.15
0.2
0.25
0.3
0.35
0.4
0.45
0.5
8/2/09 8/3/08 7/29/07 7/30/06 7/31/05 8/1/04 8/3/03 8/4/02 7/29/01 7/30/00
sga/sales
—- time —–
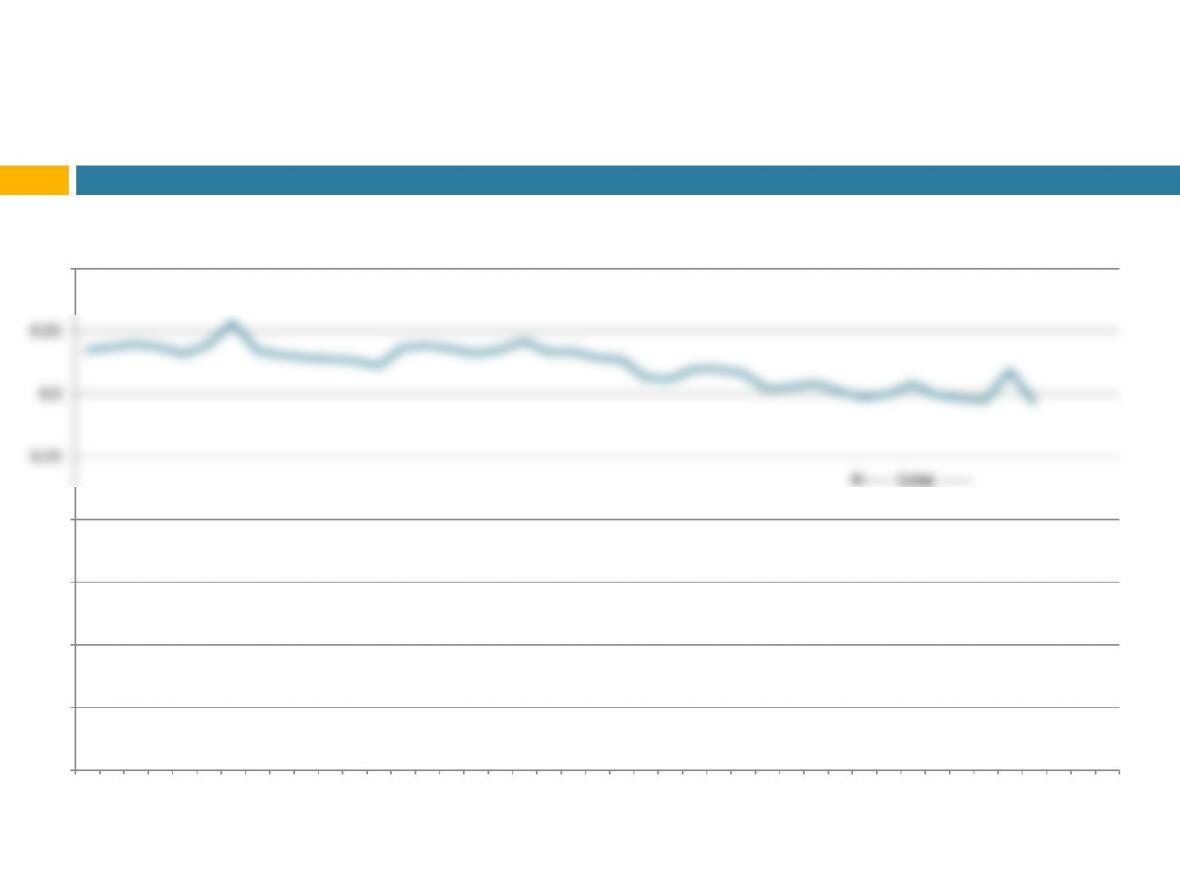
seasonality in gross margin (HD)?
0
0.05
0.1
0.15
0.2
0.25
0.3
0.35
0.4
8/2/09 8/3/08 7/29/07 7/30/06 7/31/05 8/1/04 8/3/03 8/4/02 7/29/01 7/30/00
gross margin
—- time —–
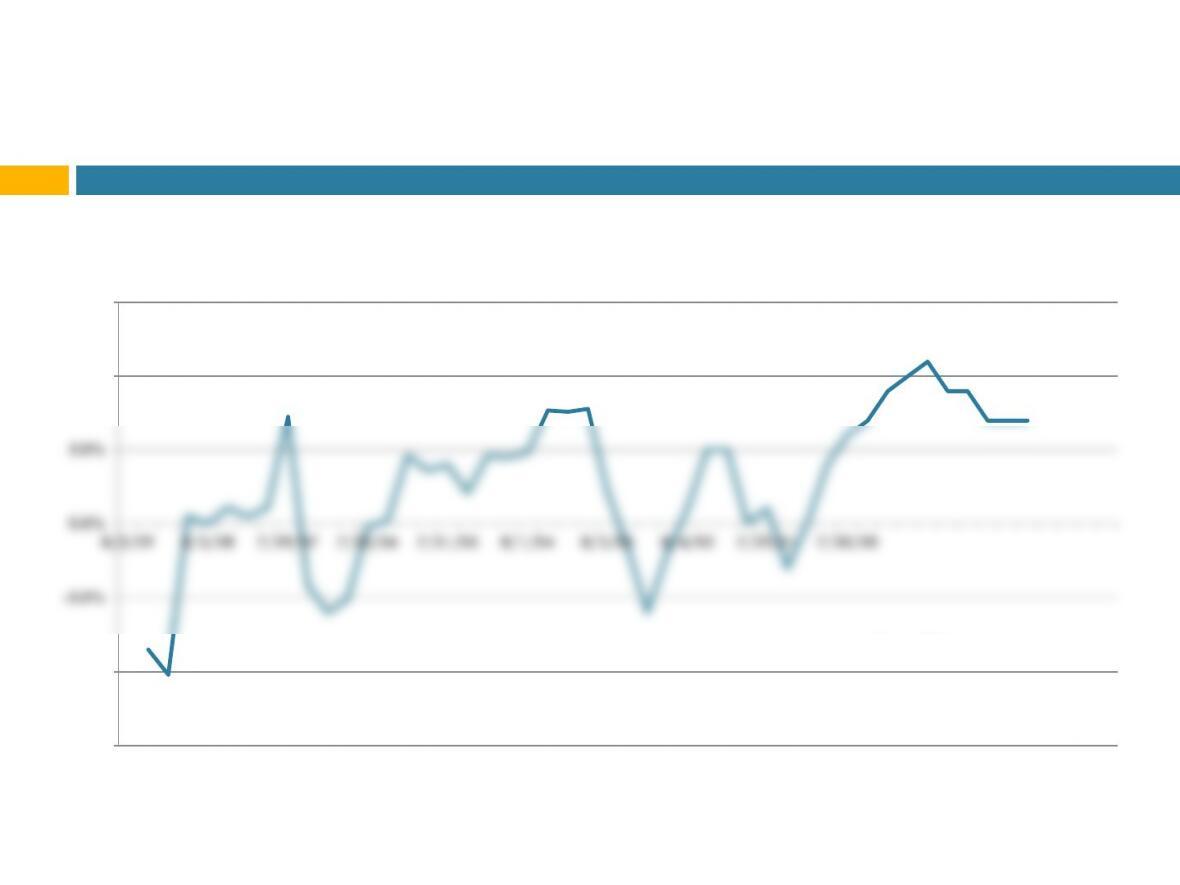
seasonality in comps (HD)?
-15.0%
-10.0%
-5.0%
0.0%
5.0%
10.0%
15.0%
8/2/09 8/3/08 7/29/07 7/30/06 7/31/05 8/1/04 8/3/03 8/4/02 7/29/01 7/30/00
Comparable store sales growth
—- time —–
80 (now 60) minute forecast!
eVal4_quarterly w THI 2012-q2.xls
Tim Hortons 10 yr financials
4 Teams
4 Teams
Sales Team deliverable: total revenue for Q3.
◼Prepare your answer as a % growth
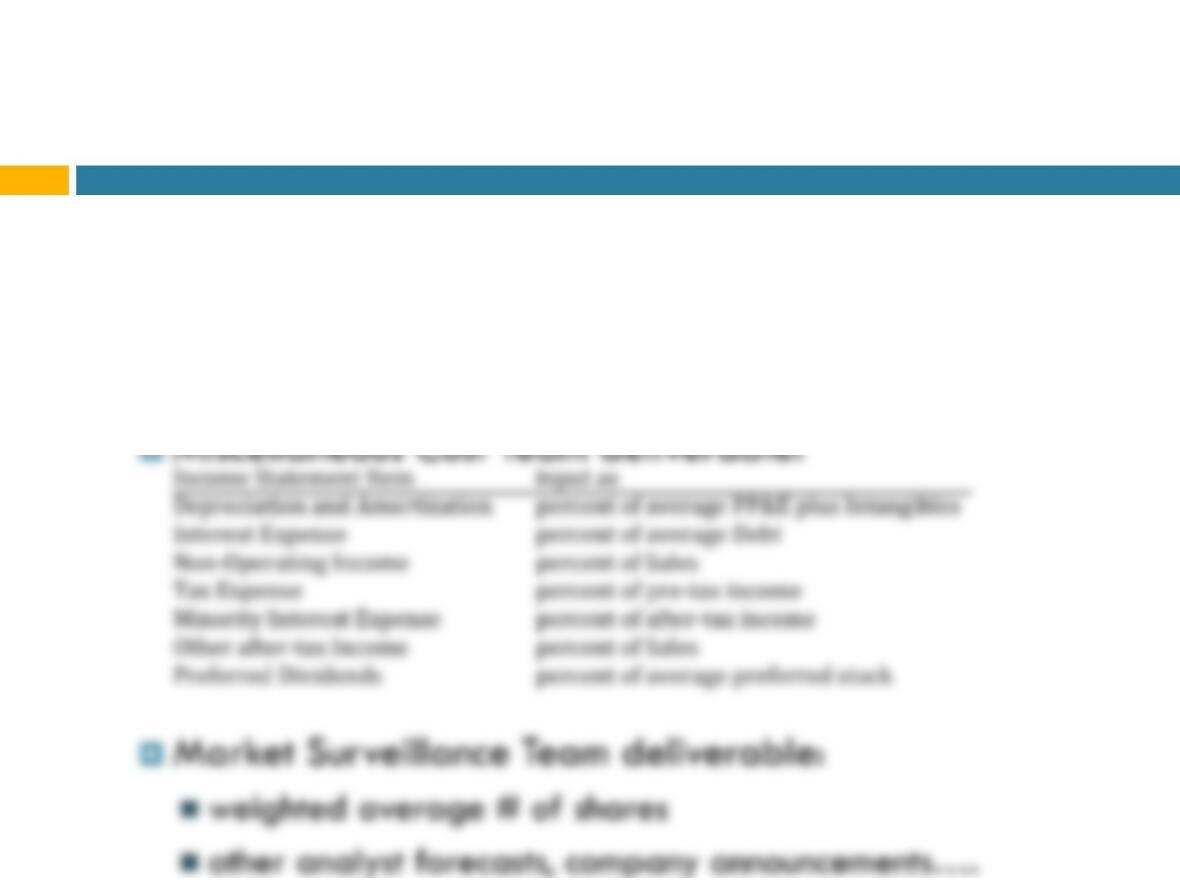
Major Cost Team deliverable: as % of sales
◼CGS and SGA
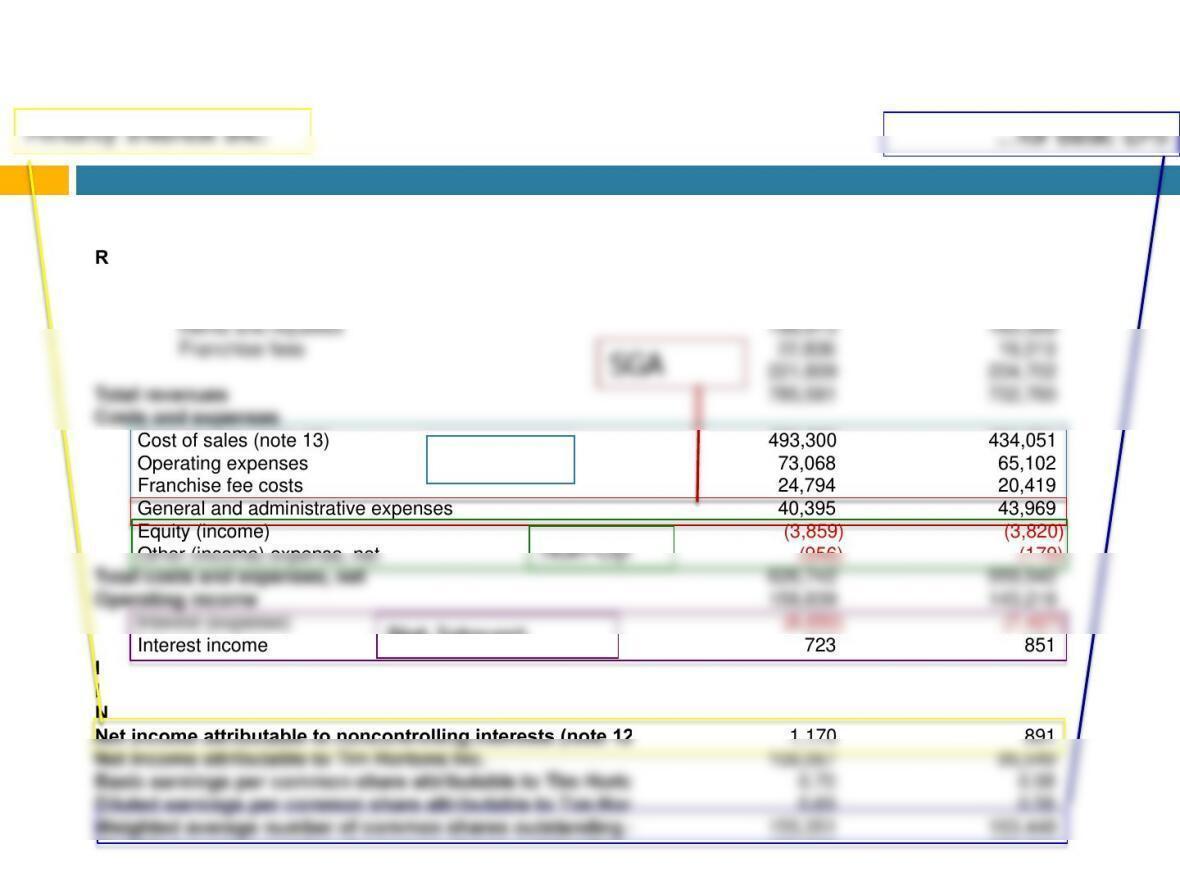
Second quarter ended Second quarter ended
July 1, 2012 July 3, 2011
Revenues
Sales (note 13) 563,772 498,058
Franchise revenues
Interest income 723 851
Income before income taxes 150,912 136,642
Income taxes (note 2) 41,675 40,202
Net income 109,237 96,440
Net income attributable to noncontrolling interests (note 12
1,170 891
Net income attributable to Tim Hortons Inc. 108,067 95,549
Basic earnings per common share attributable to Tim Horto
0.70 0.58
Diluted earnings per common share attributable to Tim Hor
0.69 0.58
Weighted average number of common shares outstanding (i
155,351 163,448
Weighted average number of common shares outstanding (i
155,995 163,961
Dividends per common share 0.21 0.17
Net Interest
next class
Credit Analysis and Default Prediction
Reading: Textbook Chapter 5, section 10