Suggested Solution to
Four Valuation Models – One Value Case
Part A: by hand computations
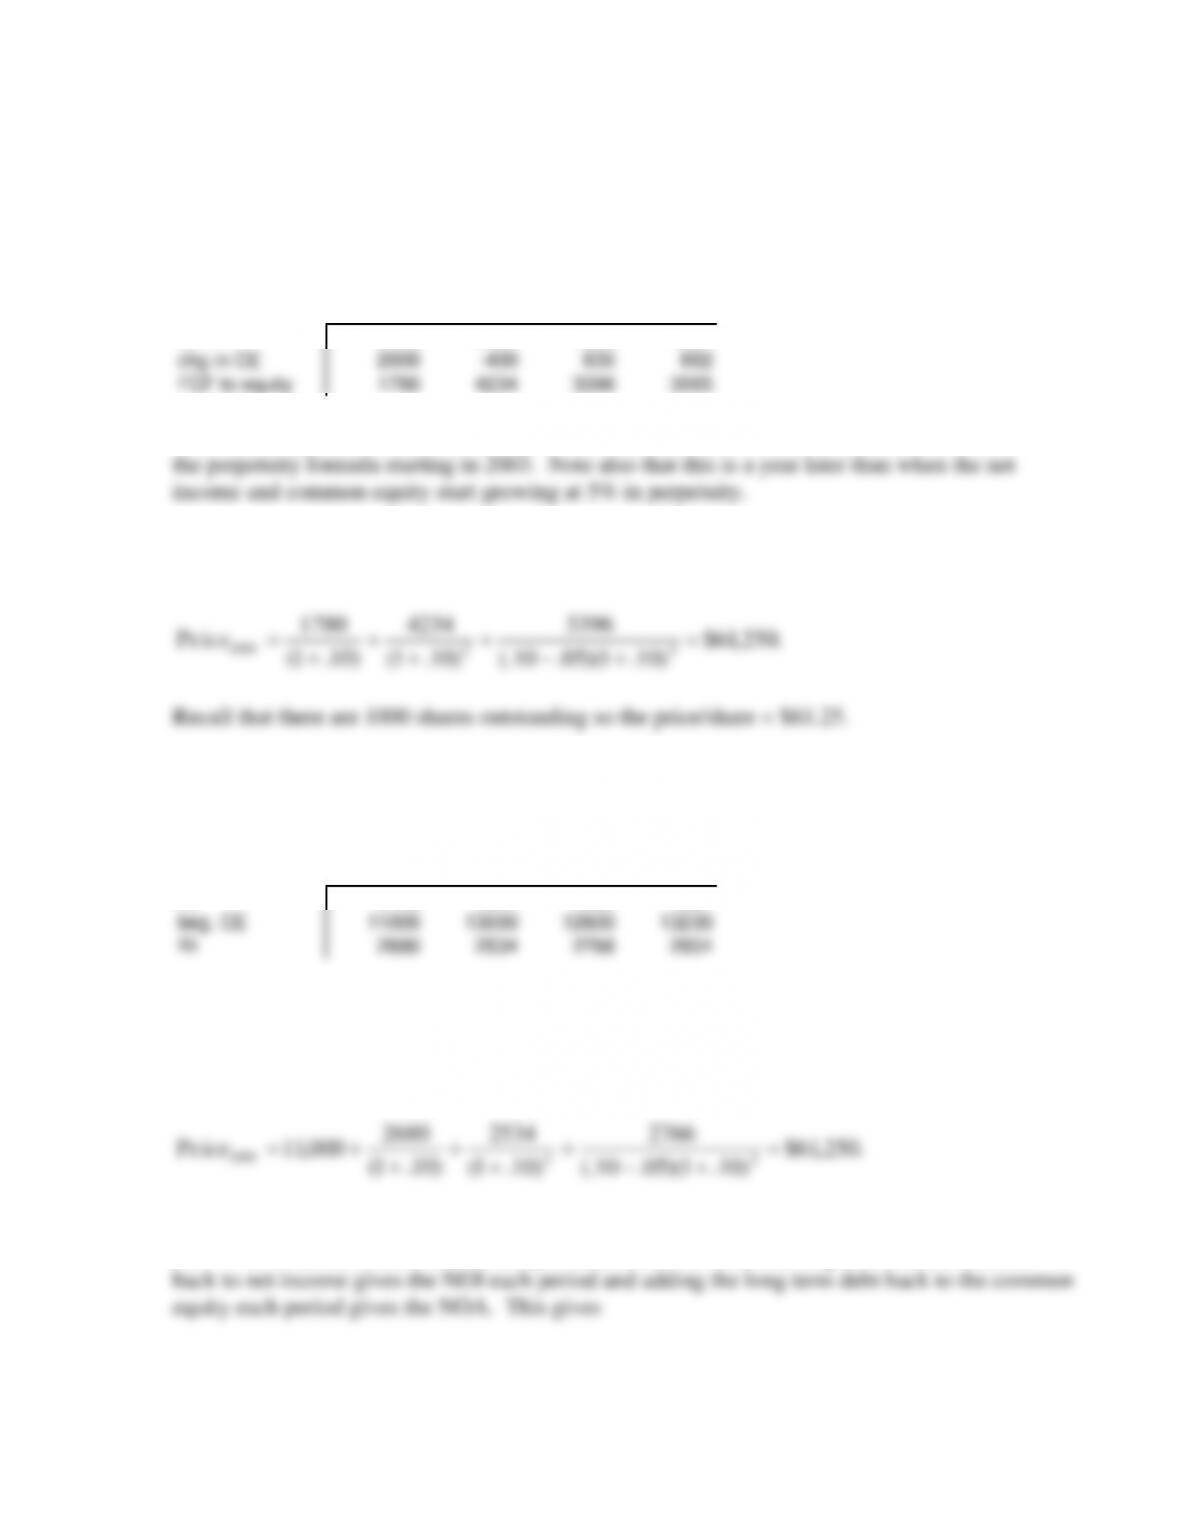
1) FCF to equity (i.e. net dividends) is computed as NIt – CEt. This gives
2001 2002 2003 2004
NI 3780 3834 4026 4227
chg in CE 2000 -400 630 662
FCF to equity 1780 4234 3396 3565
Note that the growth in FCF is exactly 5% between 2003 and 2004. This means that we can use
2) The present value of future FCF using a 10% cost of equity capital is
3) Residual income is computed as NIt – rCEt-1, where r is the cost of capital, or 10% in this
case. This gives
2001 2002 2003 2004
NI 3780 3834 4026 4227
beg. CE 11000 13000 12600 13230
RI 2680 2534 2766 2904
Note that RI grows at 5% between 2003 and 2004.
4) The present value of future residual income is
.250,61$
)10.1)(05.10(.
2766
)10.1(
2534
)10.1(
2680
000,11Pr 22
2000 =
+−
+
+
+
+
+=ice
5) The FCF to all investors is computed as NOIt – NOAt. Adding the after-tax interest
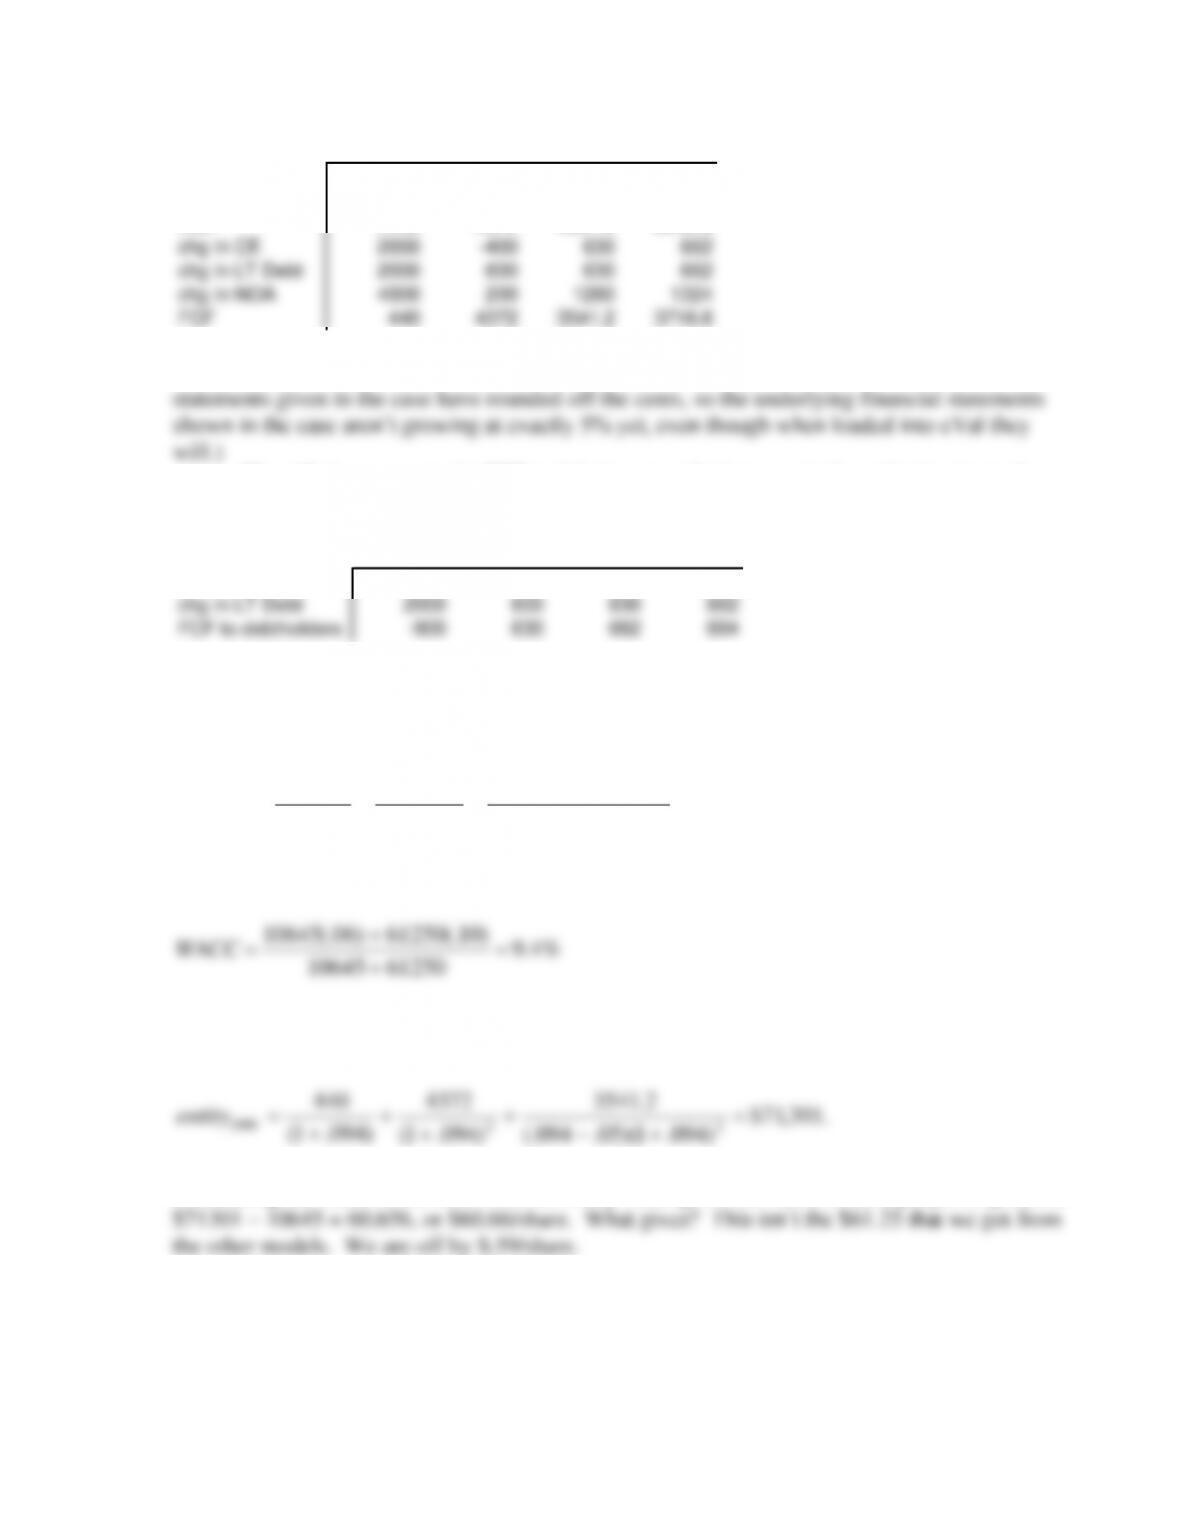
2001 2002 2003 2004
NI 3780 3834 4026 4227
(1-.40)interest 660 738 775.2 813.6
NOI 4440 4572 4801.2 5040.6
chg in CE 2000 -400 630 662
chg in LT Debt 2000 600 630 662
chg in NOA 4000 200 1260 1324
FCF 440 4372 3541.2 3716.6
Note that the FCF grows at 5% from 2003 to 2004. (This is approximate — the financial
We will also compute the FCF to debt investors for later use in the valuation (note that
the interest is pretax – this is what the debtholders experience).
2001 2002 2003 2004
interest (pretax) 1100 1230 1292 1356
chg in LT Debt 2000 600 630 662
FCF to debtholders -900 630 662 694
6) The weighted average cost of capital is a weighted average of the after-tax cost of debt,
which is (1-.40).10 = 6% and the cost of equity, which is 10%. The value of the debt, to the
debtholders, is computed pretax as
.645,10$
)10.1)(05.10(.
662
)10.1(
630
)10.1(
900
22
2000 =
+−
+
+
+
+
−
=debt
The value of the equity was already determined to be 61250, so the WACC is
6125010645
+
7) To compute the value of the equity using the indirect method of first valuing the entity
then subtracting the value of the debt, we get
)094.1)(05.094(.
)094.1(
)094.1(
22
2000 =
+−
+
+
Subtracting the value of the debt from the entity value gives the value of the equity, computed as
8) The trouble in 7) is with our WACC. We have used a fixed value, 9.4%, when our
capital structure is changing (recall that the debt/asset ratio goes from 47.6% to 50%).
Technically, we should either change our WACC to correspond with the capital structure change,

the rounding in the financial statements, as noted above).
9) The residual income to all investors model computes the value of the whole entity and
then subtracts the value of the debt, just like the free cash flow model. Further, the estimated
value of each piece is the same regardless of which model you use. The algebra that
10) Based on Haggar’s income statement and balance sheet in 2002, FCF to equity is NI of
-7549 less the increase in common equity of -8378 (its decreasing) = 829. This reconciles with
11) The net operating income is the net income of -7549 plus the after-tax interest expense.
The effective tax rate is 5823/13836 = 42%, so NOI = -7549 + (1-.42)3600 = -5461. The net
financial obligations are made up of the current and long term portions of debt, which total
25085 in 2002 and 53359 in 2001. Adding the change in long term debt to the change in equity
Part B: Verifying your calculations
Part C: Accounting Distortions
Hint: to get a fresh version of the eVal default forecasting assumptions, hit the “Change Forecast
Horizon” button and re-pick 5 years.
1-3) The revised financial statements are shown in the figure below:
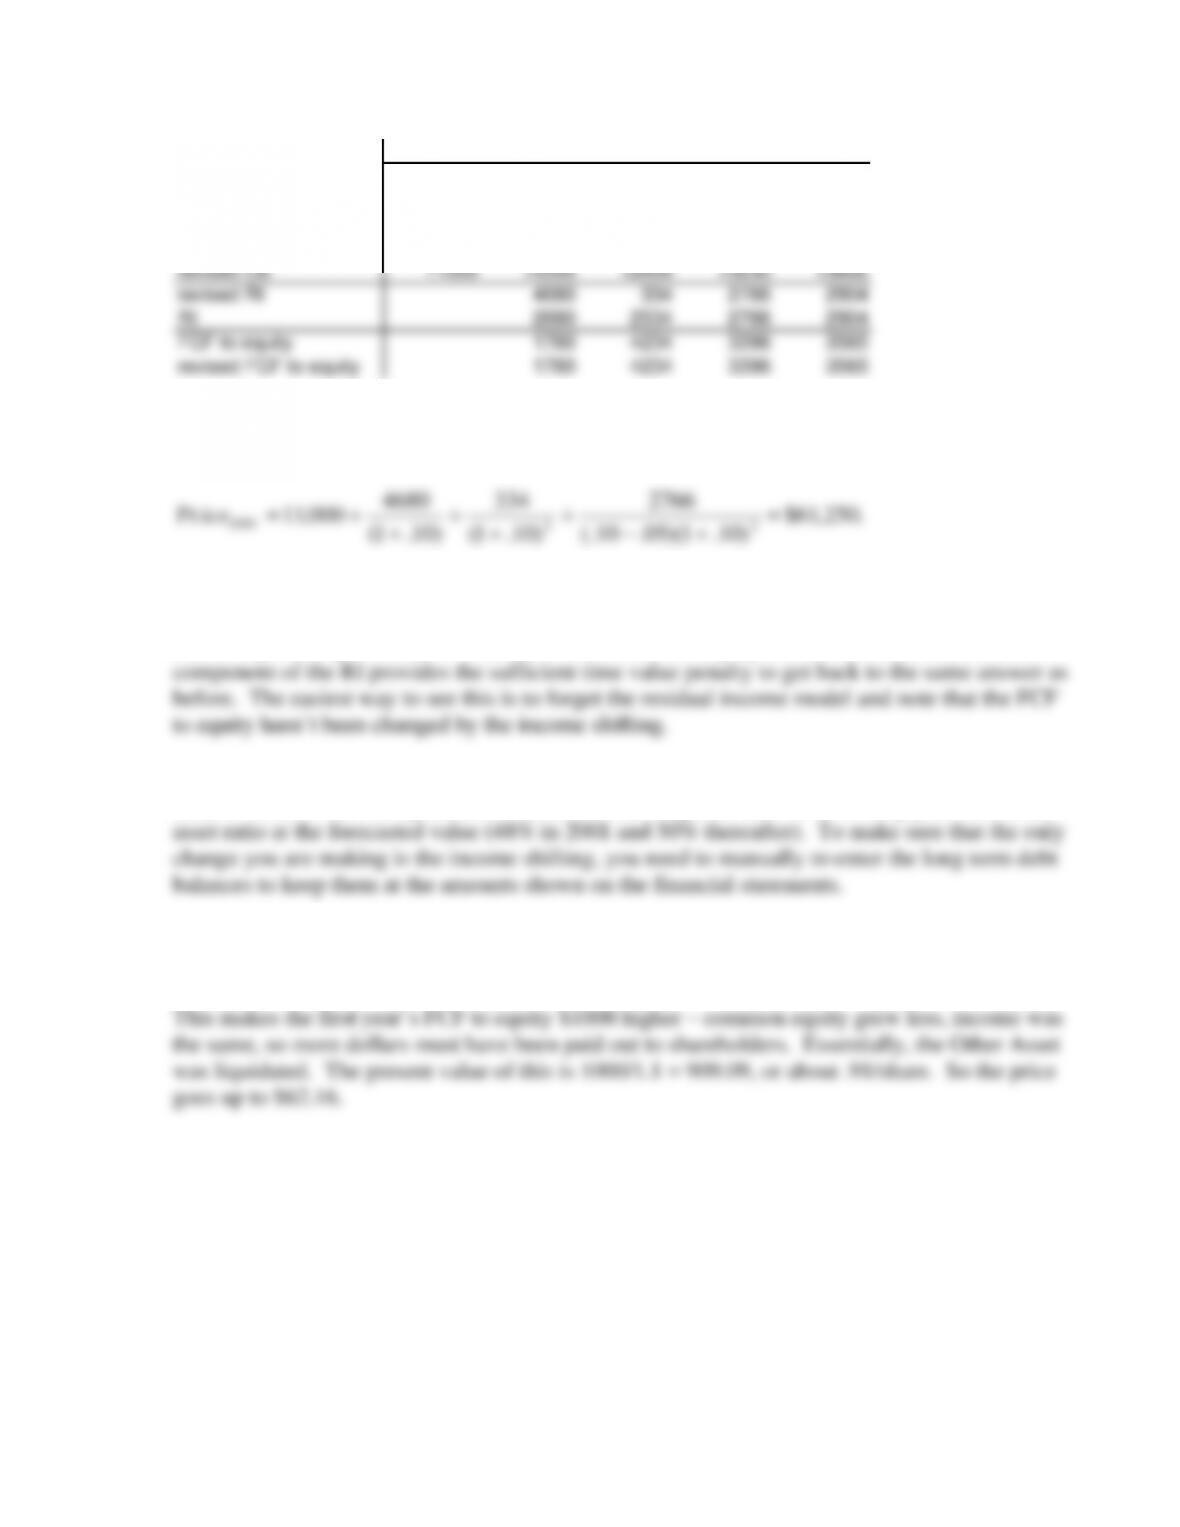
2000 2001 2002 2003 2004
NI 3780 3834 4026 4227
shifted income 2000 -2000 0 0
revised NI 5780 1834 4026 4227
CE 11000 13000 12600 13230 13892
revised CE 11000 15000 12600 13230 13892
revised RI 4680 334 2766 2904
RI 2680 2534 2766 2904
FCF to equity 1780 4234 3396 3565
revised FCF to equity 1780 4234 3396 3565
Note that residual income has changed. However, if you compute the value based on the residual
income model you get
.250,61$
)10.1)(05.10(.
2766
)10.1(
334
)10.1(
4680
000,11Pr 22
2000 =
+−
+
+
+
+
+=ice
Why do we get the same answer both times? Doesn’t money have time value so that shifting
income forward in time will raise the value? Note that RI2001 is 2000 higher but RI2002 is 2200
lower. By shifting income forward in time, the common equity balance increases, so the rCE
4) The only tricky part of this is to note that when you put Other Assets of $2000 on the
balance sheet, eVal will by default issue additional long term debt so as to keep your debt/total
5) If you just change the past financial statements to have an additional $1000 in Other
Assets and in Retained Earnings, then you have increased the beginning balance of common
equity by $1000 and haven’t changed the forecasted amounts of common equity or net income.