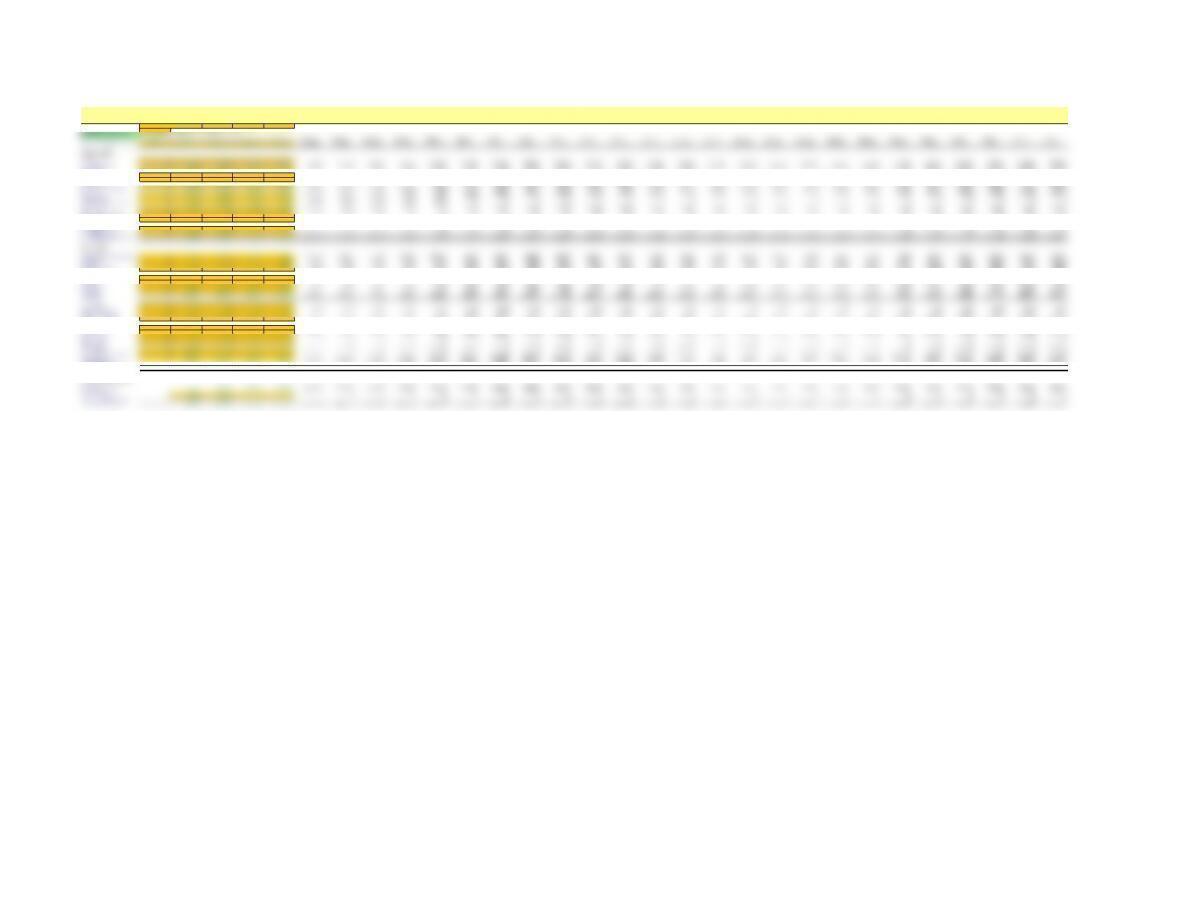
Financial Statements ($000s)
inactive
Ticker Industry Code Sector Code
Company Name SIRI MG724 MG7
Common Shares Outstanding 1,346,227 (in 000s at most recent fiscal year end)
Estimated Price/Share=$2.13
Actual Actual Actual Actual Actual Forecast Forecast Forecast Forecast Forecast Forecast Forecast Forecast Forecast Forecast Forecast Forecast Forecast Forecast Forecast Forecast Forecast Forecast Forecast Forecast Forecast Forecast Forecast Forecast Forecast
Fiscal Year End (MM/DD/YYYY ) 1/0/1900 12/31/2002 12/31/2003 12/31/2004 12/31/2005 12/31/2006 12/31/2007 12/31/2008 12/31/2009 12/31/2010 12/31/2011 12/31/2012 12/31/2013 12/31/2014 12/31/2015 12/31/2016 12/31/2017 12/31/2018 12/31/2019 12/31/2020 12/31/2021 12/31/2022 12/31/2023 12/31/2024 12/31/2025 12/31/2026 12/31/2027 12/31/2028 12/31/2029 12/31/2030
Income Statement
Sales (Net) 0805 12,872 66,854 242,245 627,415 1,035,234 1,604,613 2,182,273 2,662,373 2,795,492 2,935,267 3,082,030 3,236,132 3,397,938 3,567,835 3,746,227 3,933,538 4,130,215 4,336,726 4,553,562 4,781,240 5,020,302 5,271,317 5,534,883 5,811,627 6,102,209 6,407,319 6,727,685 7,064,069
Cost of Goods Sold 0 (57,987) (86,774) (120,914) (184,943) (368,292) (469,996) (577,661) (665,593) (737,477) (774,351) (813,069) (853,722) (896,408) (941,229) (988,290) (1,037,705) (1,089,590) (1,144,070) (1,201,273) (1,261,337) (1,324,404) (1,390,624) (1,460,155) (1,533,163) (1,609,821) (1,690,312) (1,774,827) (1,863,569) (1,956,747)
Gross Profit 0 (57,182) (73,902) (54,060) 57,302 259,122 565,238 1,026,952 1,516,680 1,924,896 2,021,141 2,122,198 2,228,308 2,339,723 2,456,709 2,579,545 2,708,522 2,843,948 2,986,145 3,135,453 3,292,225 3,456,837 3,629,678 3,811,162 4,001,720 4,201,807 4,411,897 4,632,492 4,864,116 5,107,322
R&D Expense 0 (30,087) (24,534) (30,520) (44,745) 0 0 0 0 0 0 0 0 0 0 0 0 0 0 0 0 0 0 0 0 0 0 0 0 0
SG&A Expense 0 (131,200) (243,741) (498,354) (743,142) (1,257,258) (993,826) (1,084,750) (1,250,692) (1,469,983) (1,543,482) (1,620,656) (1,701,689) (1,786,773) (1,876,112) (1,969,918) (2,068,414) (2,171,834) (2,280,426) (2,394,447) (2,514,170) (2,639,878) (2,771,872) (2,910,466) (3,055,989) (3,208,788) (3,369,228) (3,537,689) (3,714,574) (3,900,302)
EBITDA 0 (218,469) (342,177) (582,934) (730,585) (998,136) (428,589) (57,798) 265,988 454,913 477,659 501,542 526,619 552,950 580,597 609,627 640,108 672,114 705,720 741,005 778,056 816,959 857,806 900,697 945,732 993,018 1,042,669 1,094,803 1,149,543 1,207,020
Depreciation & Amortization 0 (94,658) (95,353) (95,370) (98,555) (95,767) (95,758) (95,747) (95,689) (95,690) (97,912) (102,588) (107,718) (113,104) (118,759) (124,697) (130,931) (137,478) (144,352) (151,570) (159,148) (167,105) (175,461) (184,234) (193,445) (203,118) (213,274) (223,937) (235,134) (246,891)
EBIT 0 (313,127) (437,530) (678,304) (829,140) (1,093,903) (524,347) (153,545) 170,299 359,223 379,746 398,953 418,901 439,846 461,838 484,930 509,177 534,636 561,368 589,436 618,908 649,853 682,346 716,463 752,286 789,901 829,396 870,865 914,409 960,129
Interest Expense 0 (106,163) (50,510) (41,386) (45,361) (64,484) (71,618) (65,644) (49,818) (27,287) (7,720) 0 0 0 0 0 0 0 0 0 0 0 0 0 0 0 0 0 0 0
Non-Operating Income (Loss) 0 (3,191) 261,825 11,729 13,815 29,817 39,359 45,755 41,484 25,305 0 0 0 0 0 0 0 0 0 0 0 0 0 0 0 0 0 0 0 0
EBT 0 (422,481) (226,215) (707,961) (860,686) (1,128,570) (556,605) (173,434) 161,965 357,241 372,026 398,953 418,901 439,846 461,838 484,930 509,177 534,636 561,368 589,436 618,908 649,853 682,346 716,463 752,286 789,901 829,396 870,865 914,409 960,129
Income Taxes 0 0 0 (4,201) (2,311) (3,030) (1,495) (466) 435 959 999 1,071 1,125 1,181 1,240 1,302 1,367 1,436 1,507 1,583 1,662 1,745 1,832 1,924 2,020 2,121 2,227 2,338 2,455 2,578
Minority Interest in Earnings 000000 0 0 0 0 0 0 0 0 0 0 0 0 0 0 0 0 0 0 0 0 0 0 0 0
Other Income (Loss) 000000 0 0 0 0 0 0 0 0 0 0 0 0 0 0 0 0 0 0 0 0 0 0 0 0
Net Income Before Ext. Items 0 (422,481) (226,215) (712,162) (862,997) (1,131,600) (558,100) (173,900) 162,400 358,200 373,025 400,025 420,026 441,027 463,079 486,232 510,544 536,071 562,875 591,019 620,570 651,598 684,178 718,387 754,306 792,021 831,623 873,204 916,864 962,707
Ext. Items & Disc. Ops. 000000 0 0 0 0 0 0 0 0 0 0 0 0 0 0 0 0 0 0 0 0 0 0 0 0
Preferred Dividends 0 (45,985) (88,208) 0 0 0 0 0 0 0 0 0 0 0 0 0 0 0 0 0 0 0 0 0 0 0 0 0 0 0
Net Income (available to common) 0 (468,466) (314,423) (712,162) (862,997) (1,131,600) (558,100) (173,900) 162,400 358,200 373,025 400,025 420,026 441,027 463,079 486,232 510,544 536,071 562,875 591,019 620,570 651,598 684,178 718,387 754,306 792,021 831,623 873,204 916,864 962,707
Balance Sheet
Operating Cash and Market. Sec. 0 173,702 549,883 763,874 904,422 1,962,501 2,611,206 3,075,642 2,861,325 1,878,527 279,549 293,527 308,203 323,613 339,794 356,784 374,623 393,354 413,021 433,673 455,356 478,124 502,030 527,132 553,488 581,163 610,221 640,732 672,769 706,407
Receivables 0 0 0 0 31,688 82,072 135,419 209,899 285,463 348,264 365,678 383,961 403,159 423,317 444,483 466,707 490,043 514,545 540,272 567,286 595,650 625,433 656,704 689,540 724,016 760,217 798,228 838,140 880,047 924,049
Inventories 0 0 0 0 14,256 28,389 36,229 44,528 51,306 56,847 59,689 62,674 65,808 69,098 72,553 76,181 79,990 83,989 88,189 92,598 97,228 102,089 107,194 112,553 118,181 124,090 130,295 136,809 143,650 150,832
Other Current Assets 0 25,907 29,781 47,166 61,082 61,082 61,082 61,082 61,082 61,082 61,082 64,136 67,343 70,710 74,246 77,958 81,856 85,949 90,246 94,758 99,496 104,471 109,694 115,179 120,938 126,985 133,334 140,001 147,001 154,351
Total Current Assets 0 199,609 579,664 811,040 1,011,448 2,134,044 2,843,936 3,391,151 3,259,175 2,344,720 765,998 804,298 844,513 886,739 931,076 977,629 1,026,511 1,077,836 1,131,728 1,188,315 1,247,730 1,310,117 1,375,623 1,444,404 1,516,624 1,592,455 1,672,078 1,755,682 1,843,466 1,935,639
PP&E (Net) 0 1,032,874 941,052 881,280 828,357 828,187 828,187 827,980 827,082 827,998 869,398 912,868 958,511 1,006,437 1,056,759 1,109,597 1,165,077 1,223,330 1,284,497 1,348,722 1,416,158 1,486,966 1,561,314 1,639,380 1,721,349 1,807,416 1,897,787 1,992,676 2,092,310 2,196,926
Investments 000000 0 0 0 0 0 0 0 0 0 0 0 0 0 0 0 0 0 0 0 0 0 0 0 0
Intangibles 0 83,654 83,654 83,654 83,654 83,654 83,654 83,654 83,654 83,654 83,654 87,837 92,229 96,840 101,682 106,766 112,104 117,710 123,595 129,775 136,264 143,077 150,231 157,742 165,629 173,911 182,606 191,737 201,323 211,389
Other Assets 0 24,803 12,947 181,639 161,903 161,903 161,903 161,903 161,903 161,903 161,903 169,998 178,498 187,423 196,794 206,634 216,966 227,814 239,204 251,165 263,723 276,909 290,755 305,292 320,557 336,585 353,414 371,085 389,639 409,121
Total Assets 0 1,340,940 1,617,317 1,957,613 2,085,362 3,207,788 3,917,680 4,464,688 4,331,814 3,418,275 1,880,953 1,975,001 2,073,751 2,177,439 2,286,310 2,400,626 2,520,657 2,646,690 2,779,025 2,917,976 3,063,875 3,217,068 3,377,922 3,546,818 3,724,159 3,910,367 4,105,885 4,311,179 4,526,738 4,753,075
Current Debt 000000 0 0 0 0 0 0 0 0 0 0 0 0 0 0 0 0 0 0 0 0 0 0 0 0
Accounts Payable 0 45,086 1,630 5,525 6,829 13,599 17,355 21,330 24,577 27,231 28,593 30,022 31,524 33,100 34,755 36,493 38,317 40,233 42,245 44,357 46,575 48,903 51,349 53,916 56,612 59,442 62,415 65,535 68,812 72,253
Income Taxes Payable 000000 0 0 0 0 0 0 0 0 0 0 0 0 0 0 0 0 0 0 0 0 0 0 0 0
Other Current Liabilities 0 3,234 80,373 263,989 600,138 600,138 600,138 600,138 600,138 600,138 600,138 630,145 661,652 694,735 729,471 765,945 804,242 844,454 886,677 931,011 977,562 1,026,440 1,077,762 1,131,650 1,188,232 1,247,644 1,310,026 1,375,527 1,444,304 1,516,519
Total Current Liabilities 0 48,320 82,003 269,514 606,967 613,737 617,493 621,468 624,715 627,369 628,731 660,167 693,176 727,835 764,226 802,438 842,559 884,687 928,922 975,368 1,024,136 1,075,343 1,129,110 1,185,566 1,244,844 1,307,086 1,372,441 1,441,063 1,513,116 1,588,772
Long-Term Debt 0 670,357 194,803 656,274 1,084,437 1,390,104 1,358,190 1,160,871 750,882 296,264 0 0 0 0 0 0 0 0 0 0 0 0 0 0 0 0 0 0 0 0
Other Liabilities 0 54,264 15,317 31,192 68,990 178,684 294,829 456,985 621,499 758,229 796,140 835,947 877,745 921,632 967,713 1,016,099 1,066,904 1,120,249 1,176,262 1,235,075 1,296,829 1,361,670 1,429,754 1,501,241 1,576,303 1,655,118 1,737,874 1,824,768 1,916,006 2,011,807
Deferred Taxes 000000 0 0 0 0 0 0 0 0 0 0 0 0 0 0 0 0 0 0 0 0 0 0 0 0
Minority Interest 000000 0 0 0 0 0 0 0 0 0 0 0 0 0 0 0 0 0 0 0 0 0 0 0 0
Total Liabilities 0 772,941 292,123 956,980 1,760,394 2,182,525 2,270,511 2,239,324 1,997,096 1,681,862 1,424,871 1,496,115 1,570,920 1,649,466 1,731,940 1,818,537 1,909,464 2,004,937 2,105,184 2,210,443 2,320,965 2,437,013 2,558,864 2,686,807 2,821,147 2,962,205 3,110,315 3,265,831 3,429,122 3,600,578
Preferred Stock 0 531,153 0 0 0 0 0 0 0 0 0 0 0 0 0 0 0 0 0 0 0 0 0 0 0 0 0 0 0 0
Paid in Common Capital (Net) 0 964,325 2,478,888 2,866,489 3,053,821 4,885,716 6,065,721 6,817,818 6,764,772 5,808,266 4,154,910 3,777,690 3,381,608 2,965,722 2,529,042 2,070,528 1,589,089 1,083,577 552,790 (4,537) (589,730) (1,204,182) (1,849,357) (2,526,791) (3,238,097) (3,984,968) (4,769,182) (5,592,607) (6,457,204) (7,365,030)
Retained Earnings 0 (927,479) (1,153,694) (1,865,856) (2,728,853) (3,860,453) (4,418,553) (4,592,453) (4,430,053) (4,071,853) (3,698,828) (3,298,803) (2,878,777) (2,437,750) (1,974,672) (1,488,439) (977,895) (441,824) 121,051 712,070 1,332,639 1,984,237 2,668,415 3,386,802 4,141,108 4,933,130 5,764,752 6,637,956 7,554,820 8,517,527
Total Common Equity 0 36,846 1,325,194 1,000,633 324,968 1,025,263 1,647,168 2,225,365 2,334,719 1,736,413 456,082 478,886 502,831 527,972 554,371 582,089 611,194 641,753 673,841 707,533 742,910 780,055 819,058 860,011 903,011 948,162 995,570 1,045,349 1,097,616 1,152,497
Total Liabilities and Equity 0 1,340,940 1,617,317 1,957,613 2,085,362 3,207,788 3,917,680 4,464,688 4,331,814 3,418,275 1,880,953 1,975,001 2,073,751 2,177,439 2,286,310 2,400,626 2,520,657 2,646,690 2,779,025 2,917,976 3,063,875 3,217,068 3,377,922 3,546,818 3,724,159 3,910,367 4,105,885 4,311,179 4,526,738 4,753,075
Statement of Retained Earnings
Beg. Retained Earnings 0 (927,479) (1,153,694) (1,865,856) (2,728,853) (3,860,453) (4,418,553) (4,592,453) (4,430,053) (4,071,853) (3,698,828) (3,298,803) (2,878,777) (2,437,750) (1,974,672) (1,488,439) (977,895) (441,824) 121,051 712,070 1,332,639 1,984,237 2,668,415 3,386,802 4,141,108 4,933,130 5,764,752 6,637,956 7,554,820
+Net Income (468,466) (314,423) (712,162) (862,997) (1,131,600) (558,100) (173,900) 162,400 358,200 373,025 400,025 420,026 441,027 463,079 486,232 510,544 536,071 562,875 591,019 620,570 651,598 684,178 718,387 754,306 792,021 831,623 873,204 916,864 962,707
-Common Dividends (45,985) (88,208) 0 0 0 0 0 0 0 0 0 0 0 0 0 0 0 0 0 0 0 0 0 0 0 0 0 0 0
+/-Clean Surplus Plug (Ignore) (413,028) 176,416 0 0 0 0 0 0 0 0 0 0 0 0 0 0 0 0 0 0 0 0 0 0 0 0 0 0 0
=End. Retained Earnings 0 (927,479) (1,153,694) (1,865,856) (2,728,853) (3,860,453) (4,418,553) (4,592,453) (4,430,053) (4,071,853) (3,698,828) (3,298,803) (2,878,777) (2,437,750) (1,974,672) (1,488,439) (977,895) (441,824) 121,051 712,070 1,332,639 1,984,237 2,668,415 3,386,802 4,141,108 4,933,130 5,764,752 6,637,956 7,554,820 8,517,527
SIRIUS SATELLITE RADIO
Industry/Sector Code LookUp
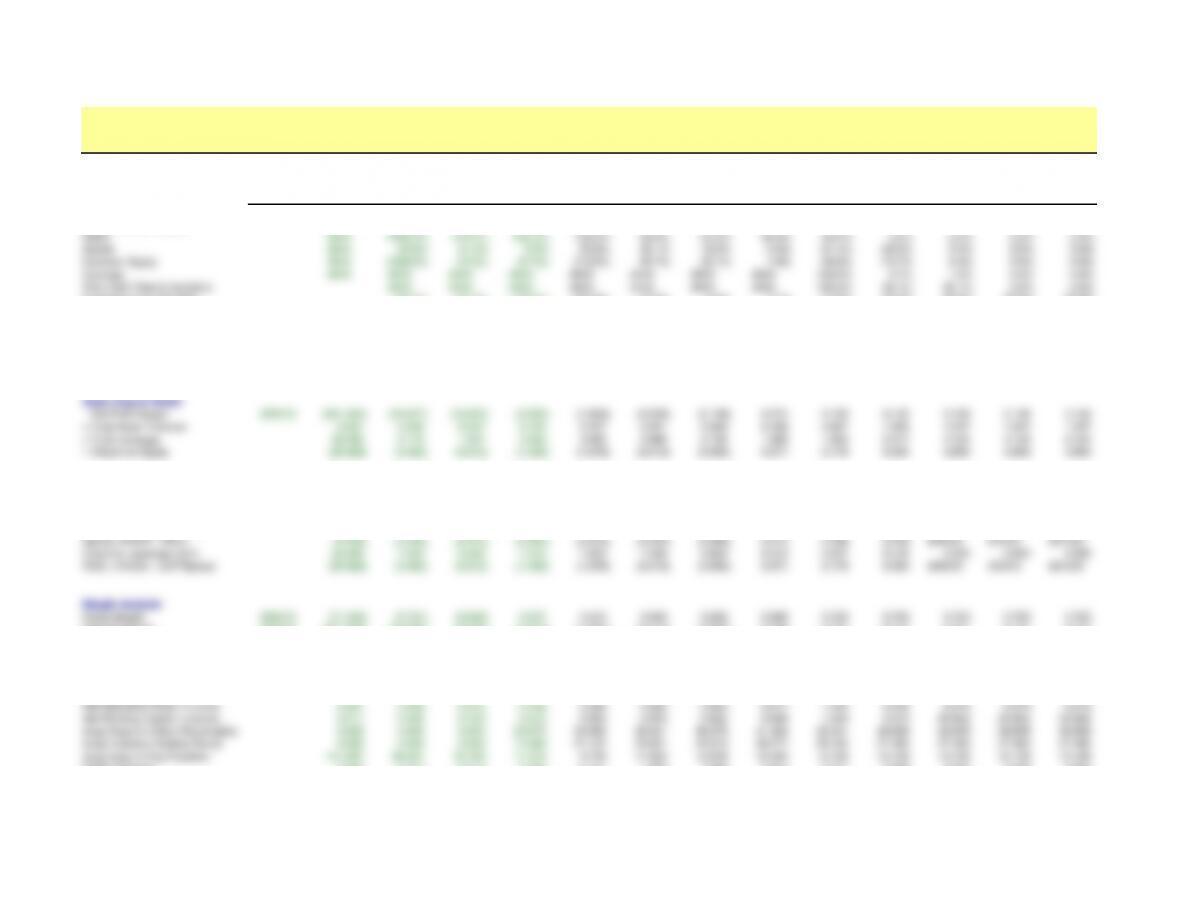
Ratio Analysis
Company Name SIRIUS SATELLITE RADIO
Actual Actual Actual Actual Actual Forecast Forecast Forecast Forecast Forecast Forecast Forecast Forecast Forecast
Fiscal Year End Date 1/0/1900 12/31/2002 12/31/2003 12/31/2004 12/31/2005 12/31/2006 12/31/2007 12/31/2008 12/31/2009 12/31/2010 12/31/2011 12/31/2012 12/31/2013 12/31/2014
Annual Growth Rates
Sales #N/A 1499.0% 419.4% 262.3% 159.0% 65.0% 55.0% 36.0% 22.0% 5.0% 5.0% 5.0% 5.0%
Assets #N/A 20.6% 21.0% 6.5% 53.8% 22.1% 14.0% -3.0% -21.1% -45.0% 5.0% 5.0% 5.0%
Common Equity #N/A 3496.6% -24.5% -67.5% 215.5% 60.7% 35.1% 4.9% -25.6% -73.7% 5.0% 5.0% 5.0%
Earnings #N/A #N/A #N/A #N/A #N/A #N/A #N/A #N/A 120.6% 4.1% 7.2% 5.0% 5.0%
Free Cash Flow to Investors #N/A #N/A #N/A #N/A #N/A #N/A #N/A 180.4% 36.1% -80.7% 5.0% 5.0%
Sustainable Growth Rate -59.1% -61.2% -130.2% –167.6% -41.8% -9.0% 7.1% 17.6% 34.0% 85.6% 85.6% 85.6%
Profitability
Return on Equity (25.428) (0.462) (0.612) (1.302) (1.676) (0.418) (0.090) 0.071 0.176 0.340 0.856 0.856 0.856
Return on Equity (b4 non-recurring) (25.255) (0.846) (0.623) (1.323) (1.720) (0.447) (0.114) 0.053 0.164 0.340 0.856 0.856 0.856
Return on Net Operating Assets (0.511) (0.127) (0.422) (0.533) (0.558) (0.179) (0.034) 0.066 0.151 0.306 0.856 0.856 0.856
Basic Dupont Model
Net Profit Margin #DIV/0! (581.945) (24.427) (10.652) (3.562) (1.804) (0.539) (0.108) 0.074 0.135 0.133 0.136 0.136 0.136
x Total Asset Turnover 0.001 0.009 0.037 0.120 0.237 0.291 0.383 0.496 0.687 1.055 1.522 1.522 1.522
x Total Leverage 36.393 2.172 1.537 3.050 3.920 2.666 2.165 1.929 1.904 2.417 4.124 4.124 4.124
= Return on Equity (25.428) (0.462) (0.612) (1.302) (1.676) (0.418) (0.090) 0.071 0.176 0.340 0.856 0.856 0.856
Advanced Dupont Model
Net Operating Margin #DIV/0! (392.942) (13.650) (10.030) (3.375) (1.701) (0.470) (0.067) 0.097 0.145 0.136 0.136 0.136 0.136
x Net Operating Asset Turnover 0.001 0.009 0.042 0.158 0.328 0.382 0.502 0.674 1.040 2.246 6.279 6.279 6.279
= Return on Net Operating Assets (0.511) (0.127) (0.422) (0.533) (0.558) (0.179) (0.034) 0.066 0.151 0.306 0.856 0.856 0.856
Net Borrowing Cost (NBC) 0.253 0.199 0.098 0.052 0.052 0.052 0.052 0.052 0.052 0.052 #DIV/0! #DIV/0! #DIV/0!
Spread (RNOA – NBC) (0.764) (0.326) (0.520) (0.585) (0.610) (0.232) (0.086) 0.013 0.098 0.254 #DIV/0! #DIV/0! #DIV/0!
Financial Leverage (LEV) 32.609 1.025 0.366 1.313 1.833 1.028 0.650 0.419 0.257 0.135 0.000 0.000 0.000
ROE = RNOA + LEV*Spread (25.428) (0.462) (0.612) (1.302) (1.676) (0.418) (0.090) 0.071 0.176 0.340 #DIV/0! #DIV/0! #DIV/0!
Margin Analysis
Gross Margin #DIV/0! (71.034) (5.741) (0.809) 0.237 0.413 0.546 0.640 0.695 0.723 0.723 0.723 0.723 0.723
EBITDA Margin #DIV/0! (271.390) (26.583) (8.720) (3.016) (1.591) (0.414) (0.036) 0.122 0.171 0.171 0.171 0.171 0.171
EBIT Margin #DIV/0! (388.978) (33.991) (10.146) (3.423) (1.744) (0.507) (0.096) 0.078 0.135 0.136 0.136 0.136 0.136
Net Operating Margin (b4 non-rec.) #DIV/0! (388.978) (33.991) (10.206) (3.432) (1.748) (0.508) (0.096) 0.078 0.135 0.136 0.136 0.136 0.136
Net Operating Margin #DIV/0! (392.942) (13.650) (10.030) (3.375) (1.701) (0.470) (0.067) 0.097 0.145 0.136 0.136 0.136 0.136
Turnover Analysis
Net Operating Asset Turnover 0.001 0.009 0.042 0.158 0.328 0.382 0.502 0.674 1.040 2.246 6.279 6.279 6.279
Net Working Capital Turnover 0.011 0.040 0.129 0.512 0.652 0.553 0.642 0.808 1.224 3.015 20.862 20.862 20.862
Avge Days to Collect Receivables 0.000 0.000 0.000 23.873 33.090 38.341 39.275 41.426 43.441 46.609 46.609 46.609 46.609
Avge Inventory Holding Period 0.000 0.000 0.000 14.068 21.132 25.091 25.513 26.277 26.764 27.465 27.465 27.465 27.465
Avge Days to Pay Payables 141.897 98.251 10.799 11.318 9.749 11.822 12.049 12.460 12.725 13.109 13.109 13.109 13.109
PP&E Turnover 0.002 0.013 0.073 0.283 0.757 1.250 1.938 2.637 3.217 3.294 3.294 3.294 3.294
Analysis of Leverage

-Long-Term Capital Structure
Debt to Equity Ratio #DIV/0! 18.193 0.147 0.656 3.337 1.356 0.825 0.522 0.322 0.171 0.000 0.000 0.000 0.000
FFO to Total Debt (0.816) (0.393) (1.412) (0.835) (0.749) (0.252) 0.067 0.442 1.128 3.435 #DIV/0! #DIV/0! #DIV/0!
CFO to Total Debt (0.749) (0.324) (1.012) (0.516) (0.795) (0.294) 0.004 0.359 1.003 3.308 #DIV/0! #DIV/0! #DIV/0!
Analysis of Leverage
– Short-Term Liquidity
Current Ratio #DIV/0! 4.131 7.069 3.009 1.666 3.477 4.606 5.457 5.217 3.737 1.218 1.218 1.218 1.218
Quick Ratio #DIV/0! 3.595 6.706 2.834 1.542 3.331 4.448 5.287 5.037 3.549 1.026 1.026 1.026 1.026
EBIT Interest Coverage #DIV/0! (2.949) (8.662) (16.390) (18.279) (16.964) (7.321) (2.339) 3.418 13.164 49.188 #DIV/0! #DIV/0! #DIV/0!
EBITDA Interest Coverage #DIV/0! (2.058) (6.774) (14.085) (16.106) (15.479) (5.984) (0.880) 5.339 16.671 61.870 #DIV/0! #DIV/0! #DIV/0!
Analysis of Credit Risk
Net Income to Total Assets #DIV/0! -0.315 -0.140 -0.364 -0.414 –0.353 -0.142 -0.039 0.037 0.105 0.198 0.203 0.203 0.203
implied default probability #DIV/0! 8.0% 7.2% 8.0% 8.0% 8.0% 7.2% 5.5% 3.0% 2.0% 2.0% 2.0% 2.0% 2.0%
Total Liabilities to Total Assets #DIV/0! 0.576 0.181 0.489 0.844 0.680 0.580 0.502 0.461 0.492 0.758 0.758 0.758 0.758
implied default probability #DIV/0! 4.5% 2.2% 3.5% 9.0% 5.5% 4.5% 3.5% 3.0% 3.5% 7.0% 7.0% 7.0% 7.0%
Quick Ratio #DIV/0! 3.595 6.706 2.834 1.542 3.331 4.448 5.287 5.037 3.549 1.026 1.026 1.026 1.026
implied default probability #DIV/0! 1.5% 1.0% 1.5% 2.5% 1.5% 1.5% 1.0% 1.0% 1.5% 4.0% 4.0% 4.0% 4.0%
EBIT to Interest Expense #DIV/0! (2.95) (8.66) (16.39) (18.28) (16.96) (7.32) (2.34) 3.42 13.16 49.19 #DIV/0! #DIV/0! #DIV/0!
implied default probability 1.0% 8.5% 9.0% 9.0% 7.5% 9.0% 9.0% 8.5% 2.1% 1.5% 1.0% 1.0% 1.0% 1.0%
Inventory Holding Period #DIV/0! 0.00 0.00 0.00 28.14 28.14 28.14 28.14 28.14 28.14 28.14 28.14 28.14 28.14
implied default probability #DIV/0! 3.0% 3.0% 3.0% 4.0% 4.0% 4.0% 4.0% 4.0% 4.0% 4.0% 4.0% 4.0% 4.0%
Annual Sales Growth #N/A 1499.0% 419.4% 262.3% 159.0% 65.0% 55.0% 36.0% 22.0% 5.0% 5.0% 5.0% 5.0%
implied default probability #N/A 6.5% 6.5% 6.5% 6.5% 5.0% 5.0% 4.2% 3.2% 3.0% 3.0% 3.0% 3.0%
Average Implied Default Probability #N/A 4.8% 5.3% 6.3% 5.8% 5.2% 4.6% 2.9% 2.6% 3.5% 3.5% 3.5% 3.5%
Fiscal Year 1899 2002 2003 2004 2005 2006 2007 2008 2009 2010 2011 2012 2013 2014

Forecast Forecast Forecast Forecast Forecast Forecast Forecast Forecast Forecast Forecast Forecast Forecast Forecast Forecast Forecast Forecast
12/31/2015 12/31/2016 12/31/2017 12/31/2018 12/31/2019 12/31/2020 12/31/2021 12/31/2022 12/31/2023 12/31/2024 12/31/2025 12/31/2026 12/31/2027 12/31/2028 12/31/2029 12/31/2030
5.0% 5.0% 5.0% 5.0% 5.0% 5.0% 5.0% 5.0% 5.0% 5.0% 5.0% 5.0% 5.0% 5.0% 5.0% 5.0%
5.0% 5.0% 5.0% 5.0% 5.0% 5.0% 5.0% 5.0% 5.0% 5.0% 5.0% 5.0% 5.0% 5.0% 5.0% 5.0%
5.0% 5.0% 5.0% 5.0% 5.0% 5.0% 5.0% 5.0% 5.0% 5.0% 5.0% 5.0% 5.0% 5.0% 5.0% 5.0%
5.0% 5.0% 5.0% 5.0% 5.0% 5.0% 5.0% 5.0% 5.0% 5.0% 5.0% 5.0% 5.0% 5.0% 5.0% 5.0%
5.0% 5.0% 5.0% 5.0% 5.0% 5.0% 5.0% 5.0% 5.0% 5.0% 5.0% 5.0% 5.0% 5.0% 5.0% 5.0%
85.6% 85.6% 85.6% 85.6% 85.6% 85.6% 85.6% 85.6% 85.6% 85.6% 85.6% 85.6% 85.6% 85.6% 85.6% 85.6%
0.856 0.856 0.856 0.856 0.856 0.856 0.856 0.856 0.856 0.856 0.856 0.856 0.856 0.856 0.856 0.856
0.856 0.856 0.856 0.856 0.856 0.856 0.856 0.856 0.856 0.856 0.856 0.856 0.856 0.856 0.856 0.856
0.856 0.856 0.856 0.856 0.856 0.856 0.856 0.856 0.856 0.856 0.856 0.856 0.856 0.856 0.856 0.856
0.136 0.136 0.136 0.136 0.136 0.136 0.136 0.136 0.136 0.136 0.136 0.136 0.136 0.136 0.136 0.136
1.522 1.522 1.522 1.522 1.522 1.522 1.522 1.522 1.522 1.522 1.522 1.522 1.522 1.522 1.522 1.522
4.124 4.124 4.124 4.124 4.124 4.124 4.124 4.124 4.124 4.124 4.124 4.124 4.124 4.124 4.124 4.124
0.856 0.856 0.856 0.856 0.856 0.856 0.856 0.856 0.856 0.856 0.856 0.856 0.856 0.856 0.856 0.856
0.136 0.136 0.136 0.136 0.136 0.136 0.136 0.136 0.136 0.136 0.136 0.136 0.136 0.136 0.136 0.136
6.279 6.279 6.279 6.279 6.279 6.279 6.279 6.279 6.279 6.279 6.279 6.279 6.279 6.279 6.279 6.279
0.856 0.856 0.856 0.856 0.856 0.856 0.856 0.856 0.856 0.856 0.856 0.856 0.856 0.856 0.856 0.856
#DIV/0! #DIV/0! #DIV/0! #DIV/0! #DIV/0! #DIV/0! #DIV/0! #DIV/0! #DIV/0! #DIV/0! #DIV/0! #DIV/0! #DIV/0! #DIV/0! #DIV/0! #DIV/0!
#DIV/0! #DIV/0! #DIV/0! #DIV/0! #DIV/0! #DIV/0! #DIV/0! #DIV/0! #DIV/0! #DIV/0! #DIV/0! #DIV/0! #DIV/0! #DIV/0! #DIV/0! #DIV/0!
0.000 0.000 0.000 0.000 0.000 0.000 0.000 0.000 0.000 0.000 0.000 0.000 0.000 0.000 0.000 0.000
#DIV/0! #DIV/0! #DIV/0! #DIV/0! #DIV/0! #DIV/0! #DIV/0! #DIV/0! #DIV/0! #DIV/0! #DIV/0! #DIV/0! #DIV/0! #DIV/0! #DIV/0! #DIV/0!
0.723 0.723 0.723 0.723 0.723 0.723 0.723 0.723 0.723 0.723 0.723 0.723 0.723 0.723 0.723 0.723
0.171 0.171 0.171 0.171 0.171 0.171 0.171 0.171 0.171 0.171 0.171 0.171 0.171 0.171 0.171 0.171
0.136 0.136 0.136 0.136 0.136 0.136 0.136 0.136 0.136 0.136 0.136 0.136 0.136 0.136 0.136 0.136
0.136 0.136 0.136 0.136 0.136 0.136 0.136 0.136 0.136 0.136 0.136 0.136 0.136 0.136 0.136 0.136
0.136 0.136 0.136 0.136 0.136 0.136 0.136 0.136 0.136 0.136 0.136 0.136 0.136 0.136 0.136 0.136
6.279 6.279 6.279 6.279 6.279 6.279 6.279 6.279 6.279 6.279 6.279 6.279 6.279 6.279 6.279 6.279
20.862 20.862 20.862 20.862 20.862 20.862 20.862 20.862 20.862 20.862 20.862 20.862 20.862 20.862 20.862 20.862
46.609 46.609 46.609 46.609 46.609 46.609 46.609 46.609 46.609 46.609 46.609 46.609 46.609 46.609 46.609 46.609
27.465 27.465 27.465 27.465 27.465 27.465 27.465 27.465 27.465 27.465 27.465 27.465 27.465 27.465 27.465 27.465
13.109 13.109 13.109 13.109 13.109 13.109 13.109 13.109 13.109 13.109 13.109 13.109 13.109 13.109 13.109 13.109
3.294 3.294 3.294 3.294 3.294 3.294 3.294 3.294 3.294 3.294 3.294 3.294 3.294 3.294 3.294 3.294

0.000 0.000 0.000 0.000 0.000 0.000 0.000 0.000 0.000 0.000 0.000 0.000 0.000 0.000 0.000 0.000
#DIV/0! #DIV/0! #DIV/0! #DIV/0! #DIV/0! #DIV/0! #DIV/0! #DIV/0! #DIV/0! #DIV/0! #DIV/0! #DIV/0! #DIV/0! #DIV/0! #DIV/0! #DIV/0!
#DIV/0! #DIV/0! #DIV/0! #DIV/0! #DIV/0! #DIV/0! #DIV/0! #DIV/0! #DIV/0! #DIV/0! #DIV/0! #DIV/0! #DIV/0! #DIV/0! #DIV/0! #DIV/0!
1.218 1.218 1.218 1.218 1.218 1.218 1.218 1.218 1.218 1.218 1.218 1.218 1.218 1.218 1.218 1.218
1.026 1.026 1.026 1.026 1.026 1.026 1.026 1.026 1.026 1.026 1.026 1.026 1.026 1.026 1.026 1.026
#DIV/0! #DIV/0! #DIV/0! #DIV/0! #DIV/0! #DIV/0! #DIV/0! #DIV/0! #DIV/0! #DIV/0! #DIV/0! #DIV/0! #DIV/0! #DIV/0! #DIV/0! #DIV/0!
#DIV/0! #DIV/0! #DIV/0! #DIV/0! #DIV/0! #DIV/0! #DIV/0! #DIV/0! #DIV/0! #DIV/0! #DIV/0! #DIV/0! #DIV/0! #DIV/0! #DIV/0! #DIV/0!
0.203 0.203 0.203 0.203 0.203 0.203 0.203 0.203 0.203 0.203 0.203 0.203 0.203 0.203 0.203 0.203
2.0% 2.0% 2.0% 2.0% 2.0% 2.0% 2.0% 2.0% 2.0% 2.0% 2.0% 2.0% 2.0% 2.0% 2.0% 2.0%
0.758 0.758 0.758 0.758 0.758 0.758 0.758 0.758 0.758 0.758 0.758 0.758 0.758 0.758 0.758 0.758
7.0% 7.0% 7.0% 7.0% 7.0% 7.0% 7.0% 7.0% 7.0% 7.0% 7.0% 7.0% 7.0% 7.0% 7.0% 7.0%
1.026 1.026 1.026 1.026 1.026 1.026 1.026 1.026 1.026 1.026 1.026 1.026 1.026 1.026 1.026 1.026
4.0% 4.0% 4.0% 4.0% 4.0% 4.0% 4.0% 4.0% 4.0% 4.0% 4.0% 4.0% 4.0% 4.0% 4.0% 4.0%
#DIV/0! #DIV/0! #DIV/0! #DIV/0! #DIV/0! #DIV/0! #DIV/0! #DIV/0! #DIV/0! #DIV/0! #DIV/0! #DIV/0! #DIV/0! #DIV/0! #DIV/0! #DIV/0!
1.0% 1.0% 1.0% 1.0% 1.0% 1.0% 1.0% 1.0% 1.0% 1.0% 1.0% 1.0% 1.0% 1.0% 1.0% 1.0%
28.14 28.14 28.14 28.14 28.14 28.14 28.14 28.14 28.14 28.14 28.14 28.14 28.14 28.14 28.14 28.14
4.0% 4.0% 4.0% 4.0% 4.0% 4.0% 4.0% 4.0% 4.0% 4.0% 4.0% 4.0% 4.0% 4.0% 4.0% 4.0%
5.0% 5.0% 5.0% 5.0% 5.0% 5.0% 5.0% 5.0% 5.0% 5.0% 5.0% 5.0% 5.0% 5.0% 5.0% 5.0%
3.0% 3.0% 3.0% 3.0% 3.0% 3.0% 3.0% 3.0% 3.0% 3.0% 3.0% 3.0% 3.0% 3.0% 3.0% 3.0%
3.5% 3.5% 3.5% 3.5% 3.5% 3.5% 3.5% 3.5% 3.5% 3.5% 3.5% 3.5% 3.5% 3.5% 3.5% 3.5%
2015 2016 2017 2018 2019 2020 2021 2022 2023 2024 2025 2026 2027 2028 2029 2030
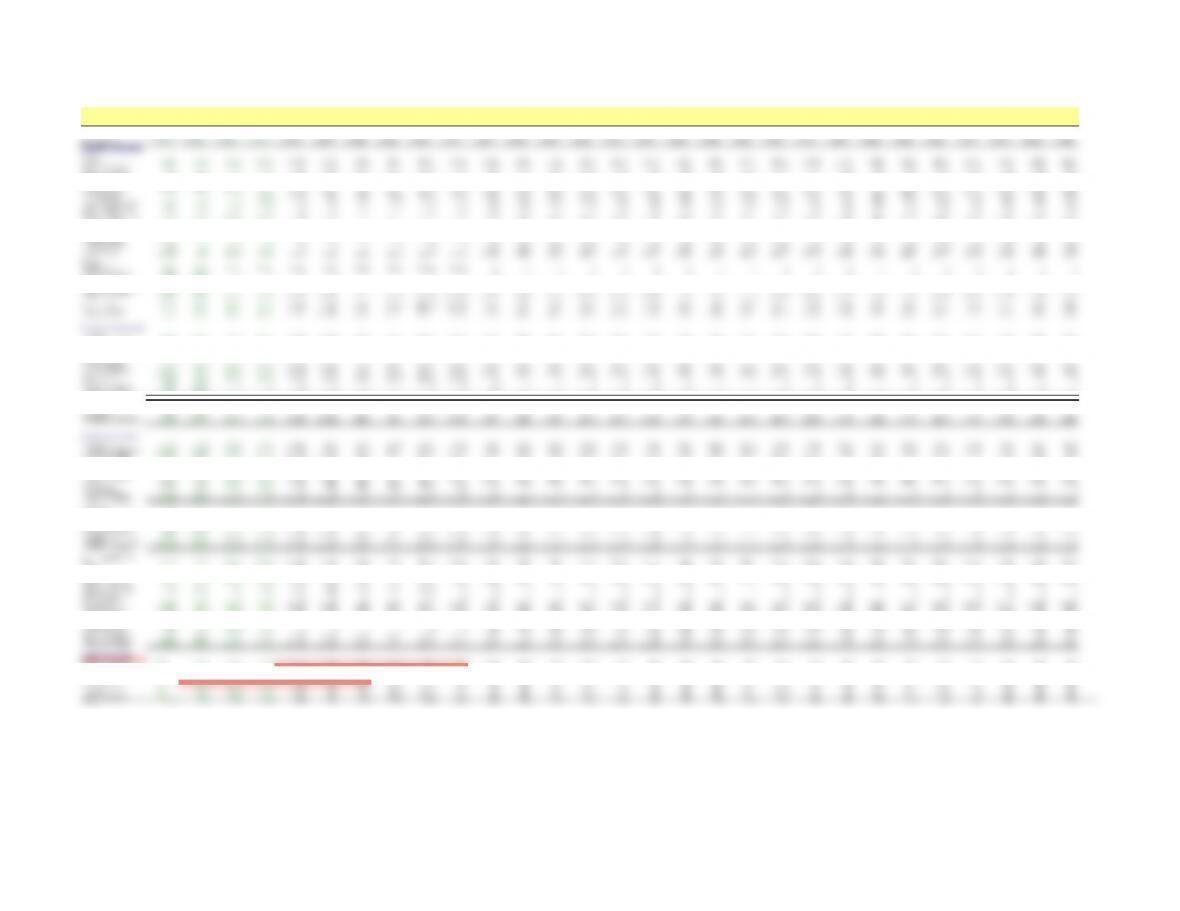
Cash Flow Analysis ($000)
Company Name SIRIUS SATELLITE RADIO
Actual Actual Actual Actual Forecast Forecast Forecast Forecast Forecast Forecast Forecast Forecast Forecast Forecast Forecast Forecast Forecast Forecast Forecast Forecast Forecast Forecast Forecast Forecast Forecast Forecast Forecast Forecast Forecast
Fiscal Year End Date 12/31/2002 12/31/2003 12/31/2004 12/31/2005 12/31/2006 12/31/2007 12/31/2008 12/31/2009 12/31/2010 12/31/2011 12/31/2012 12/31/2013 12/31/2014 12/31/2015 12/31/2016 12/31/2017 12/31/2018 12/31/2019 12/31/2020 12/31/2021 12/31/2022 12/31/2023 12/31/2024 12/31/2025 12/31/2026 12/31/2027 12/31/2028 12/31/2029 12/31/2030
Pro Forma Statement of Cash Flows
Operating:
Net Income (468,466) (314,423) (712,162) (862,997) (1,131,600) (558,100) (173,900) 162,400 358,200 373,025 400,025 420,026 441,027 463,079 486,232 510,544 536,071 562,875 591,019 620,570 651,598 684,178 718,387 754,306 792,021 831,623 873,204 916,864 962,707
+Depreciation & Amortization 94,658 95,353 95,370 98,555 95,767 95,758 95,747 95,689 95,690 97,912 102,588 107,718 113,104 118,759 124,697 130,931 137,478 144,352 151,570 159,148 167,105 175,461 184,234 193,445 203,118 213,274 223,937 235,134 246,891
+Increase in Deferred Taxes 00000000000000000000000000000
+Increase in Other Liabilities 54,264 (38,947) 15,875 37,798 109,694 116,145 162,156 164,514 136,730 37,911 39,807 41,797 43,887 46,082 48,386 50,805 53,345 56,012 58,813 61,754 64,841 68,084 71,488 75,062 78,815 82,756 86,894 91,238 95,800
+Increase in Minority Interest 00000000000000000000000000000
+Preferred Dividends 45,985 88,208 0 0 0000000000000000000000000
=Funds From Operations (273,559) (169,809) (600,917) (726,644) (926,139) (346,197) 84,003 422,604 590,620 508,849 542,420 569,541 598,018 627,919 659,315 692,281 726,895 763,239 801,401 841,471 883,545 927,722 974,108 1,022,814 1,073,954 1,127,652 1,184,035 1,243,236 1,305,398
-Increase in Receivables 0 0 0 (31,688) (50,384) (53,347) (74,480) (75,564) (62,802) (17,413) (18,284) (19,198) (20,158) (21,166) (22,224) (23,335) (24,502) (25,727) (27,014) (28,364) (29,783) (31,272) (32,835) (34,477) (36,201) (38,011) (39,911) (41,907) (44,002)
-Increase in Inventory 0 0 0 (14,256) (14,133) (7,840) (8,299) (6,778) (5,541) (2,842) (2,984) (3,134) (3,290) (3,455) (3,628) (3,809) (3,999) (4,199) (4,409) (4,630) (4,861) (5,104) (5,360) (5,628) (5,909) (6,205) (6,515) (6,840) (7,182)
-Increase in Other Current Assets (25,907) (3,874) (17,385) (13,916) 0 0 0 (0) (0) 0 (3,054) (3,207) (3,367) (3,536) (3,712) (3,898) (4,093) (4,297) (4,512) (4,738) (4,975) (5,224) (5,485) (5,759) (6,047) (6,349) (6,667) (7,000) (7,350)
+Increase in Accounts Payable 45,086 (43,456) 3,895 1,304 6,770 3,755 3,975 3,247 2,654 1,362 1,430 1,501 1,576 1,655 1,738 1,825 1,916 2,012 2,112 2,218 2,329 2,445 2,567 2,696 2,831 2,972 3,121 3,277 3,441
+Increase in Taxes Payable 00000000000000000000000000000
+Increase in Other Curr. Liabilities 3,234 77,139 183,616 336,149 (0) 0 0 0 0 0 30,007 31,507 33,083 34,737 36,474 38,297 40,212 42,223 44,334 46,551 48,878 51,322 53,888 56,582 59,412 62,382 65,501 68,776 72,215
=Cash From Operations (251,146) (140,000) (430,791) (449,051) (983,886) (403,628) 5,199 343,509 524,932 489,955 549,534 577,011 605,861 636,154 667,962 701,360 736,428 773,250 811,912 852,508 895,133 939,890 986,884 1,036,228 1,088,040 1,142,442 1,199,564 1,259,542 1,322,519
Investing:
-Capital Expenditures (1,127,532) (3,531) (35,598) (45,632) (95,597) (95,758) (95,540) (94,791) (96,607) (139,312) (146,058) (153,361) (161,029) (169,081) (177,535) (186,411) (195,732) (205,518) (215,794) (226,584) (237,913) (249,809) (262,299) (275,414) (289,185) (303,644) (318,827) (334,768) (351,506)
-Increase in Investments 00000000000000000000000000000
-Purchases of Intangibles (83,654) 0 0 0 0 0 0 (0) (0) 0 (4,183) (4,392) (4,611) (4,842) (5,084) (5,338) (5,605) (5,885) (6,180) (6,489) (6,813) (7,154) (7,512) (7,887) (8,281) (8,696) (9,130) (9,587) (10,066)
-Increase in Other Assets (24,803) 11,856 (168,692) 19,736 0 0 0 0 (0) 0 (8,095) (8,500) (8,925) (9,371) (9,840) (10,332) (10,848) (11,391) (11,960) (12,558) (13,186) (13,845) (14,538) (15,265) (16,028) (16,829) (17,671) (18,554) (19,482)
=Cash From Investing (1,235,989) 8,325 (204,290) (25,896) (95,597) (95,758) (95,540) (94,791) (96,607) (139,312) (158,336) (166,253) (174,565) (183,294) (192,458) (202,081) (212,185) (222,795) (233,934) (245,631) (257,913) (270,808) (284,349) (298,566) (313,494) (329,169) (345,628) (362,909) (381,054)
Financing:
+Increase in Debt 670,357 (475,554) 461,471 428,163 305,667 (31,914) (197,319) (409,990) (454,618) (296,264) 0 0 0 0 0 0 0 0 0 0 0 0 0 0 0 0 0 0 0
-Dividends Paid on Preferred (45,985) (88,208) 0 0 0000000000000000000000000
+Increase in Pref. Stock 531,153 (531,153) 0 0 0000000000000000000000000
-Dividends Paid on Common (45,985) (88,208) 0 0 0000000000000000000000000
+/-Net Issuance of Common Stock 964,325 1,514,563 387,601 187,332 1,831,895 1,180,005 752,096 (53,046) (956,505) (1,653,356) (377,221) (396,082) (415,886) (436,680) (458,514) (481,440) (505,512) (530,787) (557,327) (585,193) (614,453) (645,175) (677,434) (711,306) (746,871) (784,214) (823,425) (864,596) (907,826)
+/-Clean Surplus Plug (Ignore) (413,028) 176,416 0 0 0000000000000000000000000
=Cash From Financing 1,660,837 507,856 849,072 615,495 2,137,562 1,148,091 554,777 (463,036) (1,411,123) (1,949,620) (377,221) (396,082) (415,886) (436,680) (458,514) (481,440) (505,512) (530,787) (557,327) (585,193) (614,453) (645,175) (677,434) (711,306) (746,871) (784,214) (823,425) (864,596) (907,826)
Net Change in Cash 173,702 376,181 213,991 140,548 1,058,079 648,705 464,436 (214,318) (982,798) (1,598,978) 13,977 14,676 15,410 16,181 16,990 17,839 18,731 19,668 20,651 21,684 22,768 23,906 25,102 26,357 27,674 29,058 30,511 32,037 33,638
+ Beginning Cash Balance 0 173,702 549,883 763,874 904,422 1,962,501 2,611,206 3,075,642 2,861,325 1,878,527 279,549 293,527 308,203 323,613 339,794 356,784 374,623 393,354 413,021 433,673 455,356 478,124 502,030 527,132 553,488 581,163 610,221 640,732 672,769
= Ending Cash Balance 173,702 549,883 763,874 904,422 1,962,501 2,611,206 3,075,642 2,861,325 1,878,527 279,549 293,527 308,203 323,613 339,794 356,784 374,623 393,354 413,021 433,673 455,356 478,124 502,030 527,132 553,488 581,163 610,221 640,732 672,769 706,407
Net Income (468,466) (314,423) (712,162) (862,997) (1,131,600) (558,100) (173,900) 162,400 358,200 373,025 400,025 420,026 441,027 463,079 486,232 510,544 536,071 562,875 591,019 620,570 651,598 684,178 718,387 754,306 792,021 831,623 873,204 916,864 962,707
-Dividends Paid on Preferred (45,985) (88,208) 0 0 0000000000000000000000000
+Increase in Preferred Stock 531,153 (531,153) 0 0 0000000000000000000000000
+/-Clean Surplus Plug (Ignore) (413,028) 176,416 0 0 0000000000000000000000000
=Free Cash Flow to Common Equity (918,340) (1,426,355) (387,601) (187,332) (1,831,895) (1,180,005) (752,096) 53,046 956,505 1,653,356 377,221 396,082 415,886 436,680 458,514 481,440 505,512 530,787 557,327 585,193 614,453 645,175 677,434 711,306 746,871 784,214 823,425 864,596 907,826
= Free Cash Flow to Common Equity (918,340) (1,426,355) (387,601) (187,332) (1,831,895) (1,180,005) (752,096) 53,046 956,505 1,653,356 377,221 396,082 415,886 436,680 458,514 481,440 505,512 530,787 557,327 585,193 614,453 645,175 677,434 711,306 746,871 784,214 823,425 864,596 907,826
Net Operating Income -316,318 -175,705 -670,530 -817,514 -1,066,943 -486,290 -108,080 212,352 385,561 380,766 400,025 420,026 441,027 463,079 486,232 510,544 536,071 562,875 591,019 620,570 651,598 684,178 718,387 754,306 792,021 831,623 873,204 916,864 962,707
+Interest Expense 106,163 50,510 41,386 45,361 64,484 71,618 65,644 49,818 27,287 7,720 0 0 0 0 0 0 0 0 0 0 0 0 0 0 0 0 0 0 0
-Tax Shield on Interest 0 0 246 122 173 192 176 134 73 21 0000000000000000000
+/-Clean Surplus Plug (Ignore) (413,028) 176,416 0 0 0000000000000000000000000
=Free Cash Flow to Investors (1,967,702) (280,930) (807,440) (570,012) (2,072,905) (1,076,282) (488,957) 512,988 1,438,483 1,957,361 377,221 396,082 415,886 436,680 458,514 481,440 505,512 530,787 557,327 585,193 614,453 645,175 677,434 711,306 746,871 784,214 823,425 864,596 907,826
+Dividends on Preferred Stock 45,985 88,208 0 0 0000000000000000000000000
-Net Issuance of Common Stock (964,325) (1,514,563) (387,601) (187,332) (1,831,895) (1,180,005) (752,096) 53,046 956,505 1,653,356 377,221 396,082 415,886 436,680 458,514 481,440 505,512 530,787 557,327 585,193 614,453 645,175 677,434 711,306 746,871 784,214 823,425 864,596 907,826
-Net Issuance of Debt (670,357) 475,554 (461,471) (428,163) (305,667) 31,914 197,319 409,990 454,618 296,264 0 0 0 0 0 0 0 0 0 0 0 0 0 0 0 0 0 0 0
-Net Issuance of Preferred Stock (531,153) 531,153 0 0 0000000000000000000000000
=Free Cash Flow to Investors (1,967,702) (280,930) (807,440) (570,012) (2,072,905) (1,076,282) (488,957) 512,988 1,438,483 1,957,361 377,221 396,082 415,886 436,680 458,514 481,440 505,512 530,787 557,327 585,193 614,453 645,175 677,434 711,306 746,871 784,214 823,425 864,596 907,826
Traditional Computation of FCF:
EBIT (313,127) (437,530) (678,304) (829,140) (1,093,903) (524,347) (153,545) 170,299 359,223 379,746 398,953 418,901 439,846 461,838 484,930 509,177 534,636 561,368 589,436 618,908 649,853 682,346 716,463 752,286 789,901 829,396 870,865 914,409 960,129
=Gross Cash Flow (221,660) (80,352) (575,160) (718,959) (971,176) (390,532) (12,332) 308,041 481,251 478,678 502,613 527,744 554,131 581,837 610,929 641,476 673,549 707,227 742,588 779,718 818,703 859,639 902,621 947,752 995,139 1,044,896 1,097,141 1,151,998 1,209,598
-Increase in Working Capital (151,289) (346,372) (43,865) 137,045 (1,115,826) (706,136) (543,240) 135,223 917,110 1,580,084 (6,863) (7,207) (7,567) (7,945) (8,342) (8,760) (9,198) (9,657) (10,140) (10,647) (11,180) (11,739) (12,326) (12,942) (13,589) (14,268) (14,982) (15,731) (16,518)
-Capital Expenditures (1,127,532) (3,531) (35,598) (45,632) (95,597) (95,758) (95,540) (94,791) (96,607) (139,312) (146,058) (153,361) (161,029) (169,081) (177,535) (186,411) (195,732) (205,518) (215,794) (226,584) (237,913) (249,809) (262,299) (275,414) (289,185) (303,644) (318,827) (334,768) (351,506)
+Increase in Minority Interest 00000000000000000000000000000
+Increase in Other Liabilities 54,264 (38,947) 15,875 37,798 109,694 116,145 162,156 164,514 136,730 37,911 39,807 41,797 43,887 46,082 48,386 50,805 53,345 56,012 58,813 61,754 64,841 68,084 71,488 75,062 78,815 82,756 86,894 91,238 95,800
+/-Clean Surplus Plug (Ignore) (413,028) 176,416 0 0 0000000000000000000000000
=Free Cash Flow to Investors (1,967,702) (280,930) (807,440) (570,012) (2,072,905) (1,076,282) (488,957) 512,988 1,438,483 1,957,361 377,221 396,082 415,886 436,680 458,514 481,440 505,512 530,787 557,327 585,193 614,453 645,175 677,434 711,306 746,871 784,214 823,425 864,596 907,826
+ Non-Current Op. Accruals/NOA #DIV/0! (0.061) 0.096 (0.124) (0.218) (0.256) (0.412) (0.533) (0.606) 0.023 0.090 0.090 0.090 0.090 0.090 0.090 0.090 0.090 0.090 0.090 0.090 0.090 0.090 0.090 0.090 0.090 0.090 0.090 0.090
= Operating Accruals/NOA #DIV/0! (0.089) (0.079) (0.435) (0.103) (0.130) (0.212) (0.278) (0.313) 0.145 0.050 0.050 0.050 0.050 0.050 0.050 0.050 0.050 0.050 0.050 0.050 0.050 0.050 0.050 0.050 0.050 0.050 0.050 0.050
Free Cash Flow to Common Equity
Free Cash Flow to all Investors
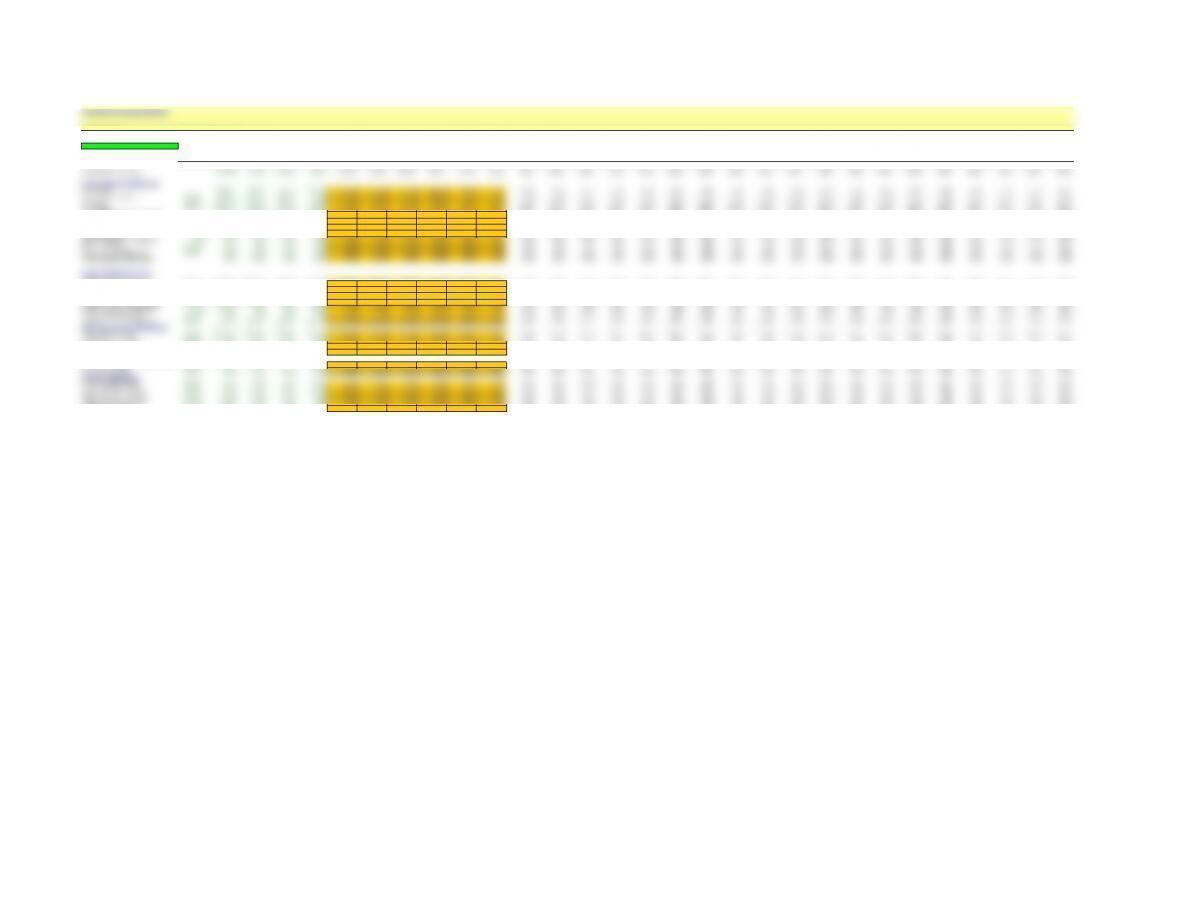
Forecasting Assumptions
Company Name SIRIUS SATELLITE RADIO
Forecast Horizon 5 Years TERMINAL
Estimated Price/Share=$2.13 YEAR
Actual Actual Actual Actual Actual Forecast Forecast Forecast Forecast Forecast Forecast Forecast Forecast Forecast Forecast Forecast Forecast Forecast Forecast Forecast Forecast Forecast Forecast Forecast Forecast Forecast Forecast Forecast Forecast Forecast
Fiscal Year End Date 1/0/1900 12/31/2002 12/31/2003 12/31/2004 12/31/2005 12/31/2006 12/31/2007 12/31/2008 12/31/2009 12/31/2010 12/31/2011 12/31/2012 12/31/2013 12/31/2014 12/31/2015 12/31/2016 12/31/2017 12/31/2018 12/31/2019 12/31/2020 12/31/2021 12/31/2022 12/31/2023 12/31/2024 12/31/2025 12/31/2026 12/31/2027 12/31/2028 12/31/2029 12/31/2030
Implied Return on Equity (25.428) (0.462) (0.612) (1.302) (1.676) (0.418) (0.090) 0.071 0.176 0.340 0.856 0.856 0.856 0.856 0.856 0.856 0.856 0.856 0.856 0.856 0.856 0.856 0.856 0.856 0.856 0.856 0.856 0.856 0.856
Income Statement Assumptions
Sales Growth #DIV/0! 1499.0% 419.4% 262.3% 159.0% 65.0% 55.0% 36.0% 22.0% 5.0% 5.0% 5.0% 5.0% 5.0% 5.0% 5.0% 5.0% 5.0% 5.0% 5.0% 5.0% 5.0% 5.0% 5.0% 5.0% 5.0% 5.0% 5.0% 5.0%
Cost of Goods Sold/Sales #DIV/0! 7203.4% 674.1% 180.9% 76.3% 58.7% 45.4% 36.0% 30.5% 27.7% 27.7% 27.7% 27.7% 27.7% 27.7% 27.7% 27.7% 27.7% 27.7% 27.7% 27.7% 27.7% 27.7% 27.7% 27.7% 27.7% 27.7% 27.7% 27.7% 27.7%
R&D/Sales #DIV/0! 3737.5% 190.6% 45.7% 18.5% 0.0% 0.0% 0.0% 0.0% 0.0% 0.0% 0.0% 0.0% 0.0% 0.0% 0.0% 0.0% 0.0% 0.0% 0.0% 0.0% 0.0% 0.0% 0.0% 0.0% 0.0% 0.0% 0.0% 0.0% 0.0%
SG&A/Sales #DIV/0! 16298.1% 1893.6% 745.4% 306.8% 200.4% 96.0% 67.6% 57.3% 55.2% 55.2% 55.2% 55.2% 55.2% 55.2% 55.2% 55.2% 55.2% 55.2% 55.2% 55.2% 55.2% 55.2% 55.2% 55.2% 55.2% 55.2% 55.2% 55.2% 55.2%
Dep&Amort/Avge PP&E and Intang. 17.0% 8.9% 9.6% 10.5% 10.5% 10.5% 10.5% 10.5% 10.5% 10.5% 10.5% 10.5% 10.5% 10.5% 10.5% 10.5% 10.5% 10.5% 10.5% 10.5% 10.5% 10.5% 10.5% 10.5% 10.5% 10.5% 10.5% 10.5% 10.5%
Interest Expense/Avge Debt 31.7% 11.7% 9.7% 5.2% 5.2% 5.2% 5.2% 5.2% 5.2% 5.2% 5.2% 5.2% 5.2% 5.2% 5.2% 5.2% 5.2% 5.2% 5.2% 5.2% 5.2% 5.2% 5.2% 5.2% 5.2% 5.2% 5.2% 5.2% 5.2%
Non-Operating Income/Sales #DIV/0! -396.4% 2034.1% 17.5% 5.7% 4.8% 3.8% 2.9% 1.9% 1.0% 0.0% 0.0% 0.0% 0.0% 0.0% 0.0% 0.0% 0.0% 0.0% 0.0% 0.0% 0.0% 0.0% 0.0% 0.0% 0.0% 0.0% 0.0% 0.0% 0.0%
Effective Tax Rate 0.0% 0.0% 0.0% -0.6% -0.3% -0.3% -0.3% -0.3% -0.3% -0.3% -0.3% -0.3% -0.3% -0.3% -0.3% -0.3% -0.3% -0.3% -0.3% -0.3% -0.3% -0.3% -0.3% -0.3% -0.3% -0.3% -0.3% -0.3% -0.3% -0.3%
Minority Interest/After Tax Income 0.0% 0.0% 0.0% 0.0% 0.0% 0.0% 0.0% 0.0% 0.0% 0.0% 0.0% 0.0% 0.0% 0.0% 0.0% 0.0% 0.0% 0.0% 0.0% 0.0% 0.0% 0.0% 0.0% 0.0% 0.0% 0.0% 0.0% 0.0% 0.0% 0.0%
Other Income/Sales #DIV/0! 0.0% 0.0% 0.0% 0.0% 0.0% 0.0% 0.0% 0.0% 0.0% 0.0% 0.0% 0.0% 0.0% 0.0% 0.0% 0.0% 0.0% 0.0% 0.0% 0.0% 0.0% 0.0% 0.0% 0.0% 0.0% 0.0% 0.0% 0.0% 0.0%
Ext. Items & Disc. Ops./Sales #DIV/0! 0.0% 0.0% 0.0% 0.0% 0.0% 0.0% 0.0% 0.0% 0.0% 0.0% 0.0% 0.0% 0.0% 0.0% 0.0% 0.0% 0.0% 0.0% 0.0% 0.0% 0.0% 0.0% 0.0% 0.0% 0.0% 0.0% 0.0% 0.0% 0.0%
Pref. Dividends/Avge Pref. Stock 17.3% 33.2% 0.0% 0.0% 0.0% 0.0% 0.0% 0.0% 0.0% 0.0% 0.0% 0.0% 0.0% 0.0% 0.0% 0.0% 0.0% 0.0% 0.0% 0.0% 0.0% 0.0% 0.0% 0.0% 0.0% 0.0% 0.0% 0.0% 0.0%
Balance Sheet Assumptions:
Working Capital Assumptions
Ending Operating Cash/Sales #DIV/0! 21577.9% 4271.9% 1142.6% 373.4% 312.8% 252.2% 191.7% 131.1% 70.6% 10.0% 10.0% 10.0% 10.0% 10.0% 10.0% 10.0% 10.0% 10.0% 10.0% 10.0% 10.0% 10.0% 10.0% 10.0% 10.0% 10.0% 10.0% 10.0% 10.0%
Ending Receivables/Sales #DIV/0! 0.0% 0.0% 0.0% 13.1% 13.1% 13.1% 13.1% 13.1% 13.1% 13.1% 13.1% 13.1% 13.1% 13.1% 13.1% 13.1% 13.1% 13.1% 13.1% 13.1% 13.1% 13.1% 13.1% 13.1% 13.1% 13.1% 13.1% 13.1% 13.1%
Ending Inventories/COGS 0.0% 0.0% 0.0% 0.0% 7.7% 7.7% 7.7% 7.7% 7.7% 7.7% 7.7% 7.7% 7.7% 7.7% 7.7% 7.7% 7.7% 7.7% 7.7% 7.7% 7.7% 7.7% 7.7% 7.7% 7.7% 7.7% 7.7% 7.7% 7.7% 7.7%
Ending Other Current Assets/Sales #DIV/0! 3218.3% 231.4% 70.6% 25.2% 9.7% 5.9% 3.8% 2.8% 2.3% 2.2% 2.2% 2.2% 2.2% 2.2% 2.2% 2.2% 2.2% 2.2% 2.2% 2.2% 2.2% 2.2% 2.2% 2.2% 2.2% 2.2% 2.2% 2.2% 2.2%
Ending Accounts Payable/COGS 0.0% 77.8% 1.9% 4.6% 3.7% 3.7% 3.7% 3.7% 3.7% 3.7% 3.7% 3.7% 3.7% 3.7% 3.7% 3.7% 3.7% 3.7% 3.7% 3.7% 3.7% 3.7% 3.7% 3.7% 3.7% 3.7% 3.7% 3.7% 3.7% 3.7%
Ending Taxes Payable/Sales #DIV/0! 0.0% 0.0% 0.0% 0.0% 0.0% 0.0% 0.0% 0.0% 0.0% 0.0% 0.0% 0.0% 0.0% 0.0% 0.0% 0.0% 0.0% 0.0% 0.0% 0.0% 0.0% 0.0% 0.0% 0.0% 0.0% 0.0% 0.0% 0.0% 0.0%
Ending Other Current Liabs/Sales #DIV/0! 401.7% 624.4% 394.9% 247.7% 95.7% 58.0% 37.4% 27.5% 22.5% 21.5% 21.5% 21.5% 21.5% 21.5% 21.5% 21.5% 21.5% 21.5% 21.5% 21.5% 21.5% 21.5% 21.5% 21.5% 21.5% 21.5% 21.5% 21.5% 21.5%
Other Operating Asset Assumptions
Ending Net PP&E/Sales #DIV/0! 128307.3% 7310.8% 1318.2% 342.0% 132.0% 80.0% 51.6% 37.9% 31.1% 31.1% 31.1% 31.1% 31.1% 31.1% 31.1% 31.1% 31.1% 31.1% 31.1% 31.1% 31.1% 31.1% 31.1% 31.1% 31.1% 31.1% 31.1% 31.1% 31.1%
Ending Investments/Sales #DIV/0! 0.0% 0.0% 0.0% 0.0% 0.0% 0.0% 0.0% 0.0% 0.0% 0.0% 0.0% 0.0% 0.0% 0.0% 0.0% 0.0% 0.0% 0.0% 0.0% 0.0% 0.0% 0.0% 0.0% 0.0% 0.0% 0.0% 0.0% 0.0% 0.0%
Ending Intangibles/Sales #DIV/0! 10391.8% 649.9% 125.1% 34.5% 13.3% 8.1% 5.2% 3.8% 3.1% 3.0% 3.0% 3.0% 3.0% 3.0% 3.0% 3.0% 3.0% 3.0% 3.0% 3.0% 3.0% 3.0% 3.0% 3.0% 3.0% 3.0% 3.0% 3.0% 3.0%
Ending Other Assets/Sales #DIV/0! 3081.1% 100.6% 271.7% 66.8% 25.8% 15.6% 10.1% 7.4% 6.1% 5.8% 5.8% 5.8% 5.8% 5.8% 5.8% 5.8% 5.8% 5.8% 5.8% 5.8% 5.8% 5.8% 5.8% 5.8% 5.8% 5.8% 5.8% 5.8% 5.8%
Other Operating Liability Assumptions
Other Liabilities/Sales #DIV/0! 6740.9% 119.0% 46.7% 28.5% 28.5% 28.5% 28.5% 28.5% 28.5% 28.5% 28.5% 28.5% 28.5% 28.5% 28.5% 28.5% 28.5% 28.5% 28.5% 28.5% 28.5% 28.5% 28.5% 28.5% 28.5% 28.5% 28.5% 28.5% 28.5%
Deferred Taxes/Sales #DIV/0! 0.0% 0.0% 0.0% 0.0% 0.0% 0.0% 0.0% 0.0% 0.0% 0.0% 0.0% 0.0% 0.0% 0.0% 0.0% 0.0% 0.0% 0.0% 0.0% 0.0% 0.0% 0.0% 0.0% 0.0% 0.0% 0.0% 0.0% 0.0% 0.0%
Financing Assumptions
Current Debt/Total Assets #DIV/0! 0.0% 0.0% 0.0% 0.0% 0.0% 0.0% 0.0% 0.0% 0.0% 0.0% 0.0% 0.0% 0.0% 0.0% 0.0% 0.0% 0.0% 0.0% 0.0% 0.0% 0.0% 0.0% 0.0% 0.0% 0.0% 0.0% 0.0% 0.0% 0.0%
Long-Term Debt/Total Assets #DIV/0! 50.0% 12.0% 33.5% 52.0% 43.3% 34.7% 26.0% 17.3% 8.7% 0.0% 0.0% 0.0% 0.0% 0.0% 0.0% 0.0% 0.0% 0.0% 0.0% 0.0% 0.0% 0.0% 0.0% 0.0% 0.0% 0.0% 0.0% 0.0% 0.0%
Minority Interest/Total Assets #DIV/0! 0.0% 0.0% 0.0% 0.0% 0.0% 0.0% 0.0% 0.0% 0.0% 0.0% 0.0% 0.0% 0.0% 0.0% 0.0% 0.0% 0.0% 0.0% 0.0% 0.0% 0.0% 0.0% 0.0% 0.0% 0.0% 0.0% 0.0% 0.0% 0.0%
Preferred Stock/Total Assets #DIV/0! 39.6% 0.0% 0.0% 0.0% 0.0% 0.0% 0.0% 0.0% 0.0% 0.0% 0.0% 0.0% 0.0% 0.0% 0.0% 0.0% 0.0% 0.0% 0.0% 0.0% 0.0% 0.0% 0.0% 0.0% 0.0% 0.0% 0.0% 0.0% 0.0%
Dividend Payout Ratio 0.0% -9.8% -28.1% 0.0% 0.0% 0.0% 0.0% 0.0% 0.0% 0.0% 0.0% 0.0% 0.0% 0.0% 0.0% 0.0% 0.0% 0.0% 0.0% 0.0% 0.0% 0.0% 0.0% 0.0% 0.0% 0.0% 0.0% 0.0% 0.0% 0.0%
Estimated Price/Share=$2.13
Company Name: SIRIUS SATELLITE RADIO
Required Valuation Parameters (to compute value of common equity):
10.00%
0
6/1/2006
1.00
Enter Cost of Debt: ———————————————————————————————-> 8.00%
Enter Cost of Preferred Stock: ————————-————————-————-————–> 9.00%
Implied Cost of Equity Calculator
This calculator solves for the cost of equity capital that generates a given price/share.
To use the calculator, enter a price, hit return and click the ‘Calculate’ button.
Price/Share = $2.13 1.000000
——————————————– ——————————–>
Enter Dilution Factor for Splits Occurring Since Latest Fiscal Year End:
————>
—————————————————————————–>
Optional Valuation Parameters (to compute value to all investors):
—————————->
Valuation Parameters
Enter Cost of Equity Capital:
Enter Date of Valuation:
Enter Value of Contingent Claims on Common Equity ($000):
Calculate

Contingent Claims Calculator
(Use this calculator to estimate the value of contingent claims on common equity,
such as employee stock options and convertible bonds)
Current Stock Price $40.00
Exercise Price $40.00
Years to Expiration 5
Standard Deviation of Annual Stock Return 30.00%