Key Insights from Analysis
⚫Overstock’s turnover looks a little slow
–High balance of cash and marketable securities slows down
aggregate turnover ratios
–Aggressive use of fulfillment partners combined with gross-
basis accounting for sales revenue should lead to higher turns
than Amazon.com
⚫Overstock’s margins are currently way too low
–Margins lag way behind competitors

Overstock.com:
Forecasting Analysis
(Using Q3 2005 –see spreadsheet for details)
Forecasting Overview
⚫Illustrates systematic framework for generating
financial statement forecasts
⚫eVal will walk you though this framework moving forward
⚫Starting point is historical financial statements
⚫Sales growth, margins, turnover ratios, leverage

Framework for Business Analysis
and Valuation
STEP 1
Understanding the Past
1. Information
Collection
STEP 2
Forecasting the Future
1. Structured
Forecasting
STEP 3
Valuation
1. Cost of Capital
Destruction though
Financing Transactions
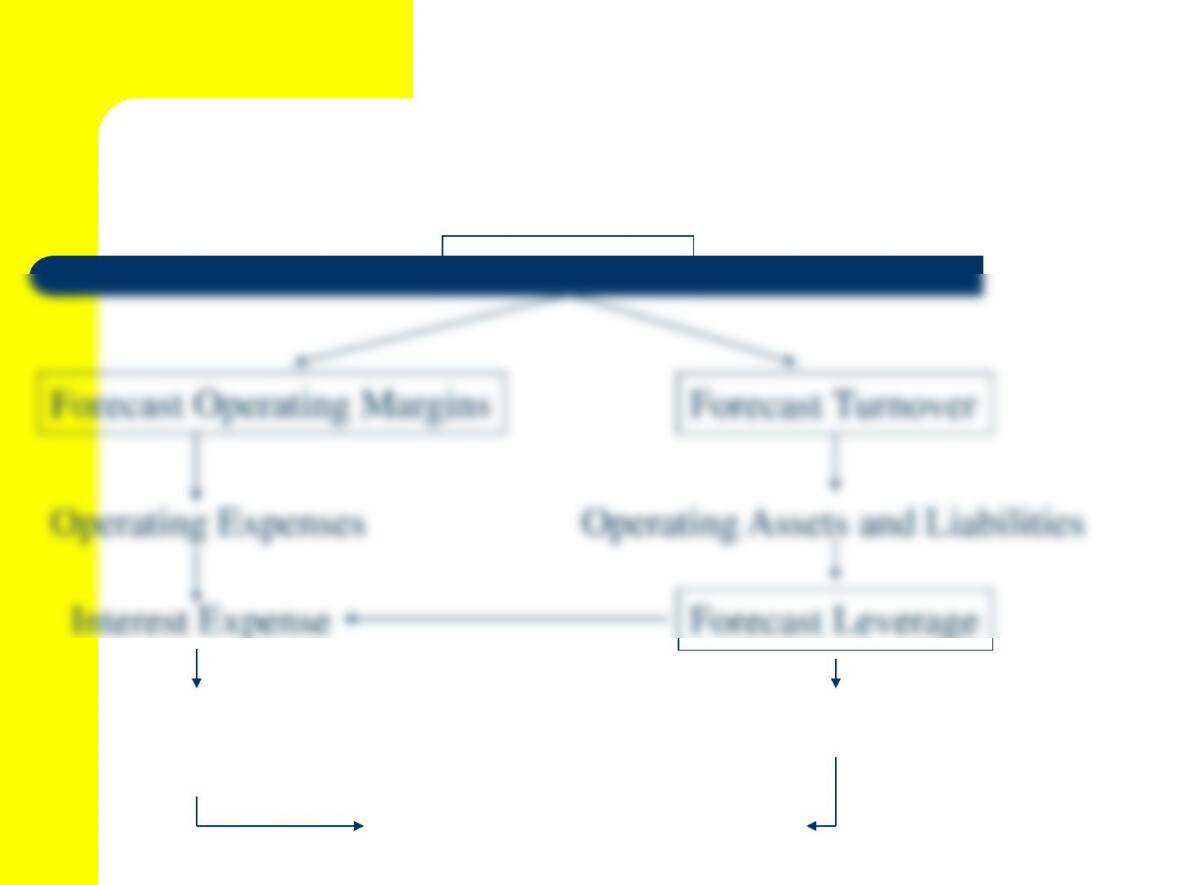
The Forecasting Process
Balance Sheet
Tax Expense
Income Statement
Statement of Cash Flows

Sales Growth
⚫Guidance in 9/16/2005 press release
“Investors should note that our restricted ability to post fresh
inventory slowed sales sharply, a caesura from which we are now
rebounding. In addition, the upgrade also caused inefficiencies
that, when combined with our extended dollar shipping promotion,

press release
⚫Technology expense higher due to information in press
release
⚫G&A expense higher due to information in press
release
press release

Leverage and the Balance Sheet Plug
⚫No indication that OSTK issued/repurchased
any common equity during Q3 ’05
⚫No indication OSTK issued/retired any debt

Overstock.com
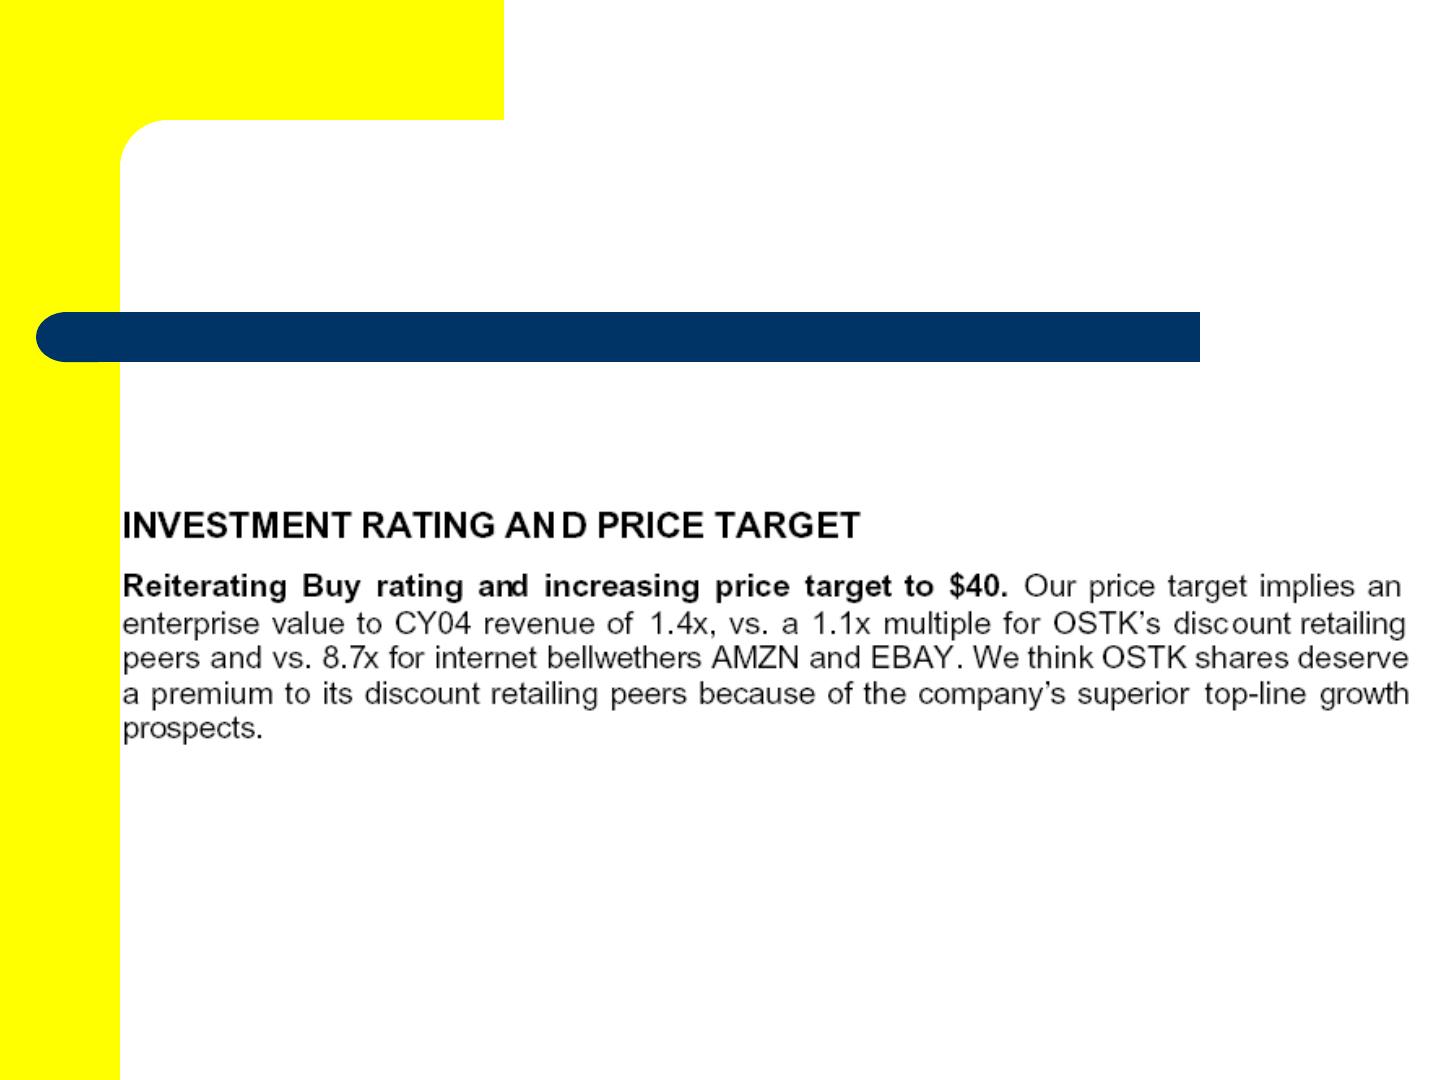
WR Hambrecht Valuation Method