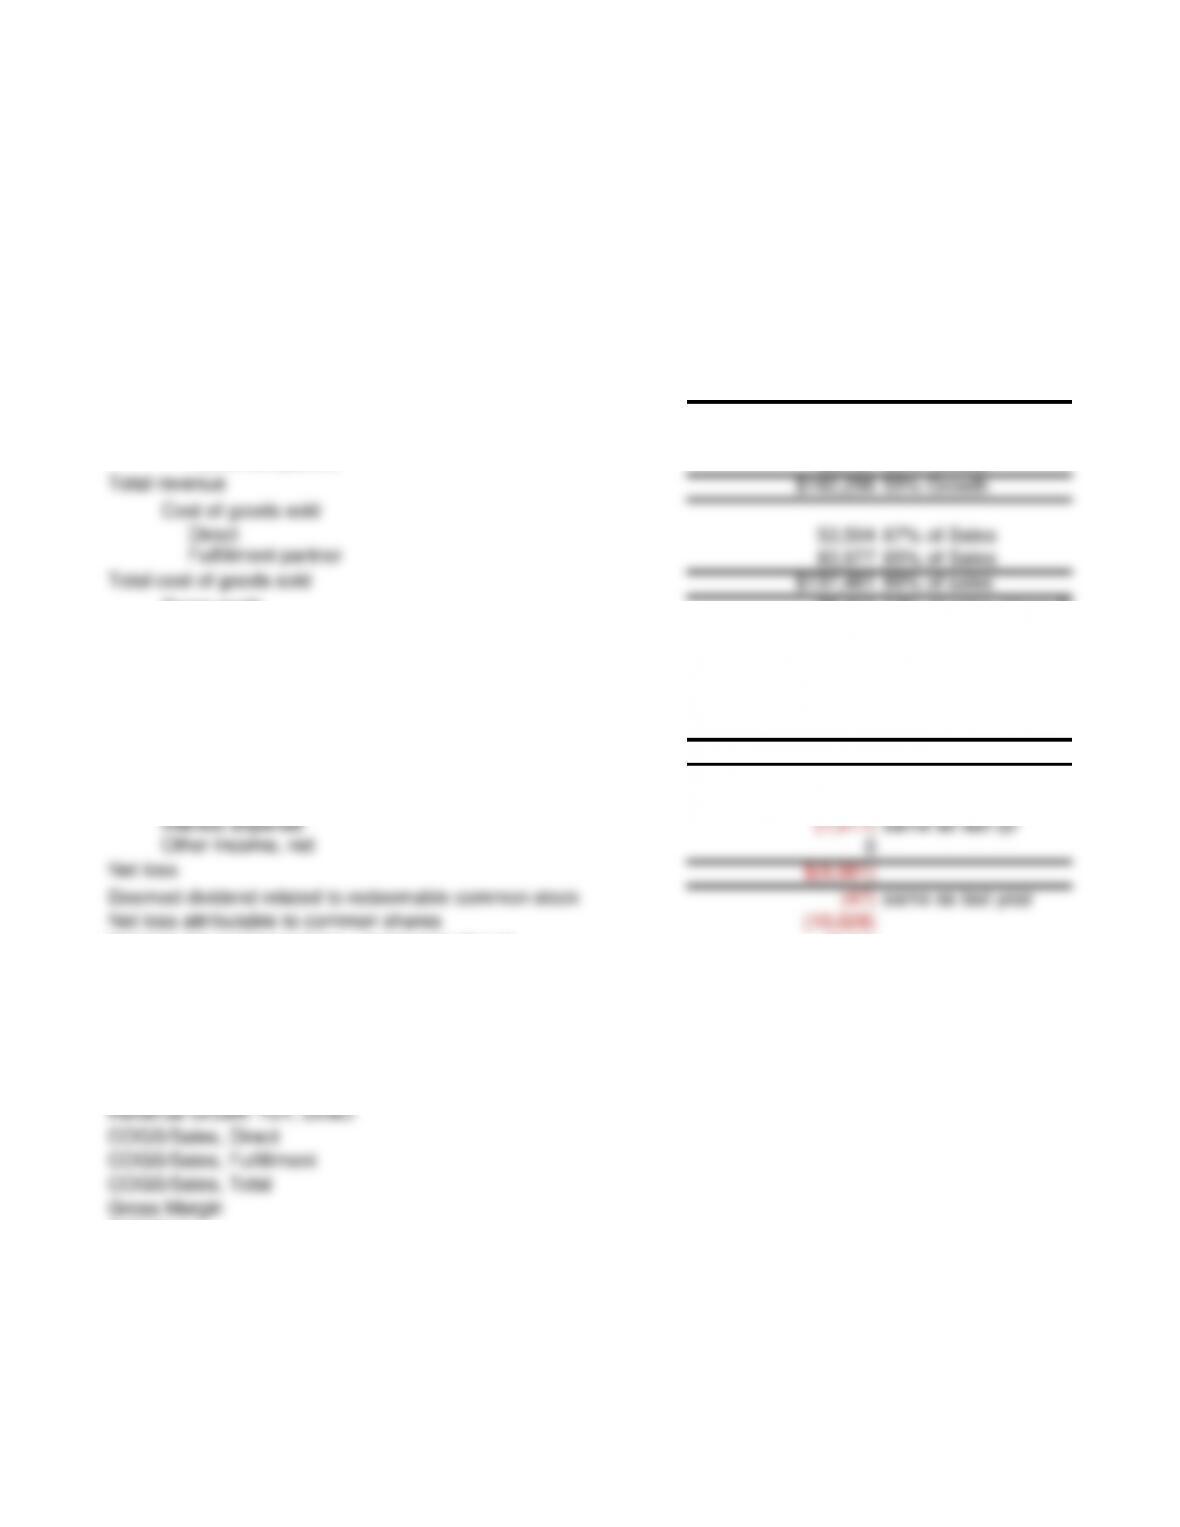
OVERSTOCK COM INC
Consolidated Statements of Income
In Thousands Except Per Share Amounts For Period Ended
Jun 30, 2005
09/30/05 3m Notes
Revenue
Direct 61,499 40% Growth
Fulfillment partner 98,797 66% Growth
Total revenue $160,296 55% Growth
Cost of goods sold
Direct 53,504 87% of Sales
Fulfillment partner 83,977 85% of Sales
Total cost of goods sold $137,481 86% of sales
Gross profit 22,441
14% of sales (down 68 b
Operating expenses:
Sales and marketing 15,420 9.62% of Sales
Technology 7,213
4.55% of Sales (up 50
General and administrative 8,816
5.5% of Sales (up 50 bp
Amortization of stock-based compensation 53 same as last qtr
Total operating expenses $31,503
Operating loss
Interest income 597
2/3 qtr, as Cash & MS do
Interest expense (1,517) same as last qtr
Other income, net 0
Net loss $(9,981)
Deemed dividend related to redeemable common stock (47) same as last year
Net loss attributable to common shares (10,028)
Net loss per common share — basic and diluted (0.51)
Weighted average common shares outstanding 19,709
Calculations
Revenue Growth YoY, Direct
Revenue Growth YoY, Direct
Revenue Growth YoY, Direct
COGS/Sales, Direct
COGS/Sales, Fulfillment
COGS/Sales, Total
Gross Margin
S&M/Sales
Tech/Sales
G&A/Sales
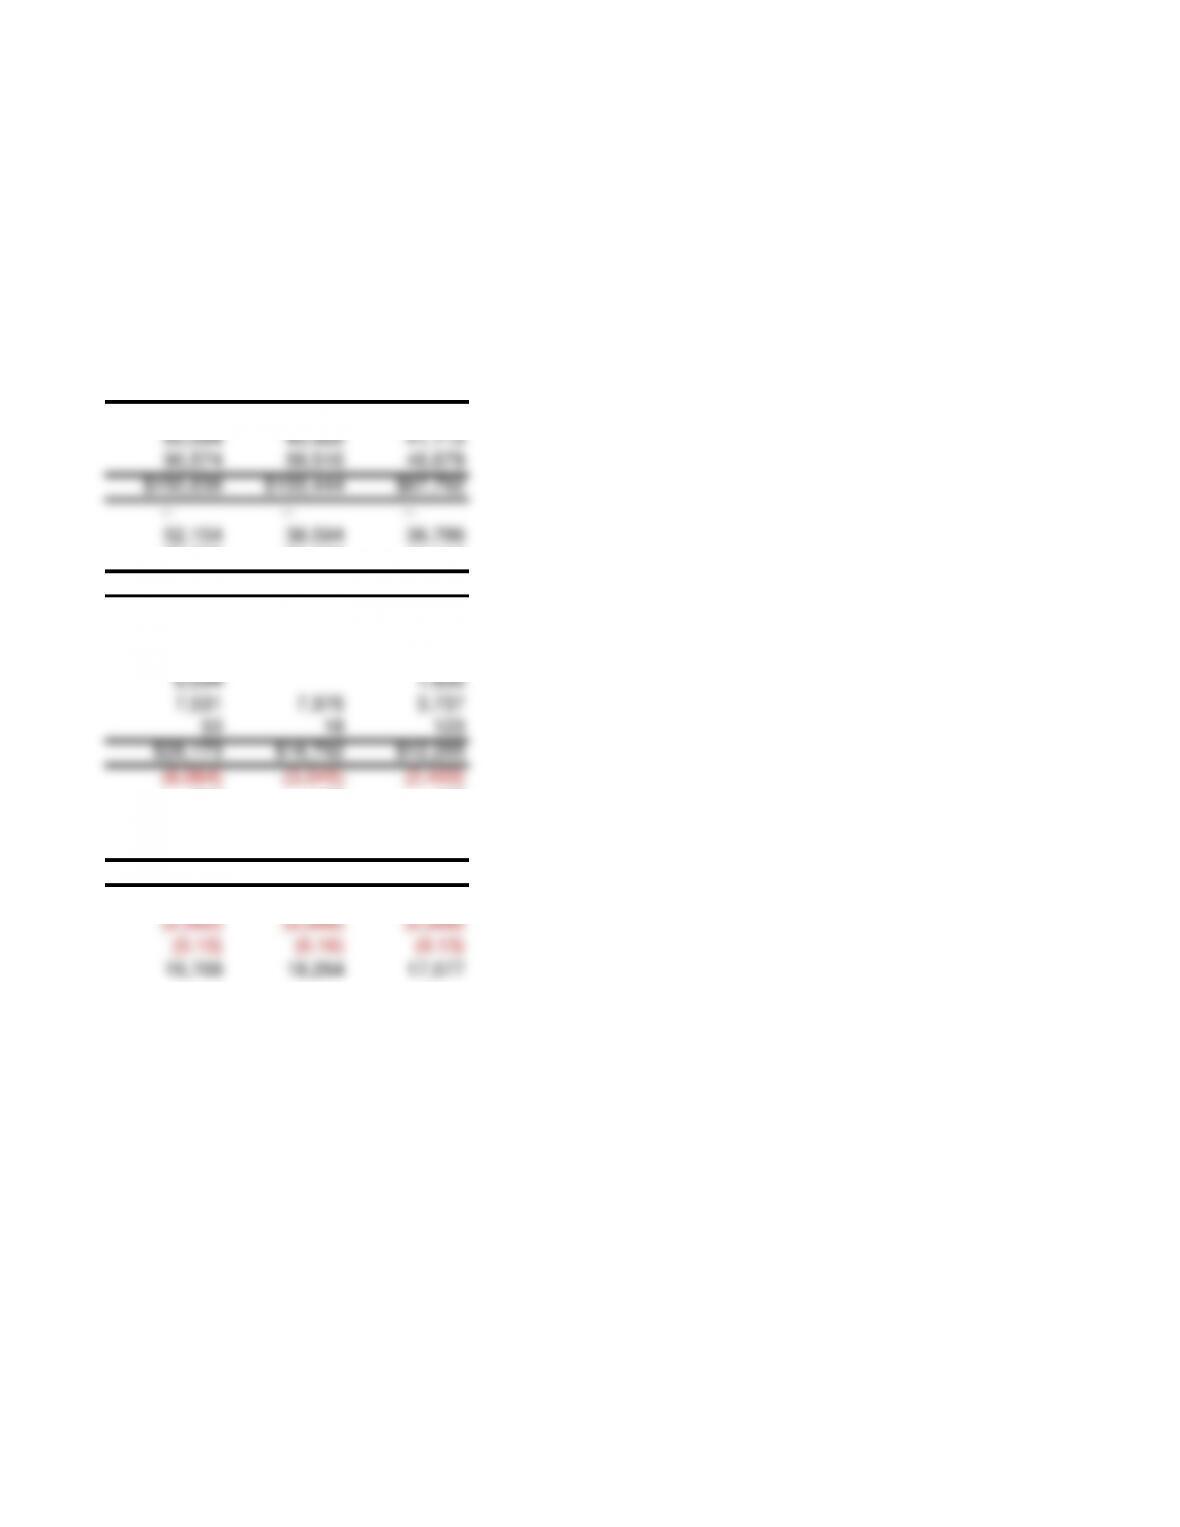
06/30/05 3m 09/30/04 3m 06/30/04 3m
— — —
60,064 43,928 41,113
90,574 59,516 46,679
$150,638 $103,444 $87,792
— — —
52,154 38,594 36,786
76,375 51,103 41,114
$128,529 $89,697 $77,900
22,109 13,747 9,892
— — —
14,495 9,398 6,605
(6,064) (3,045) (2,403)
896 168 127
(1,517) (77) (46)
4,170 3—
$(2,515) $(2,951) $(2,322)
(47) (47) (46)
46.09%
94.04%
71.59%
86.83% 37.31% 41.90%
9.62% 9.09% 7.52%
4.05% 0.00% 2.08%
5.00% 7.13% 4.26%
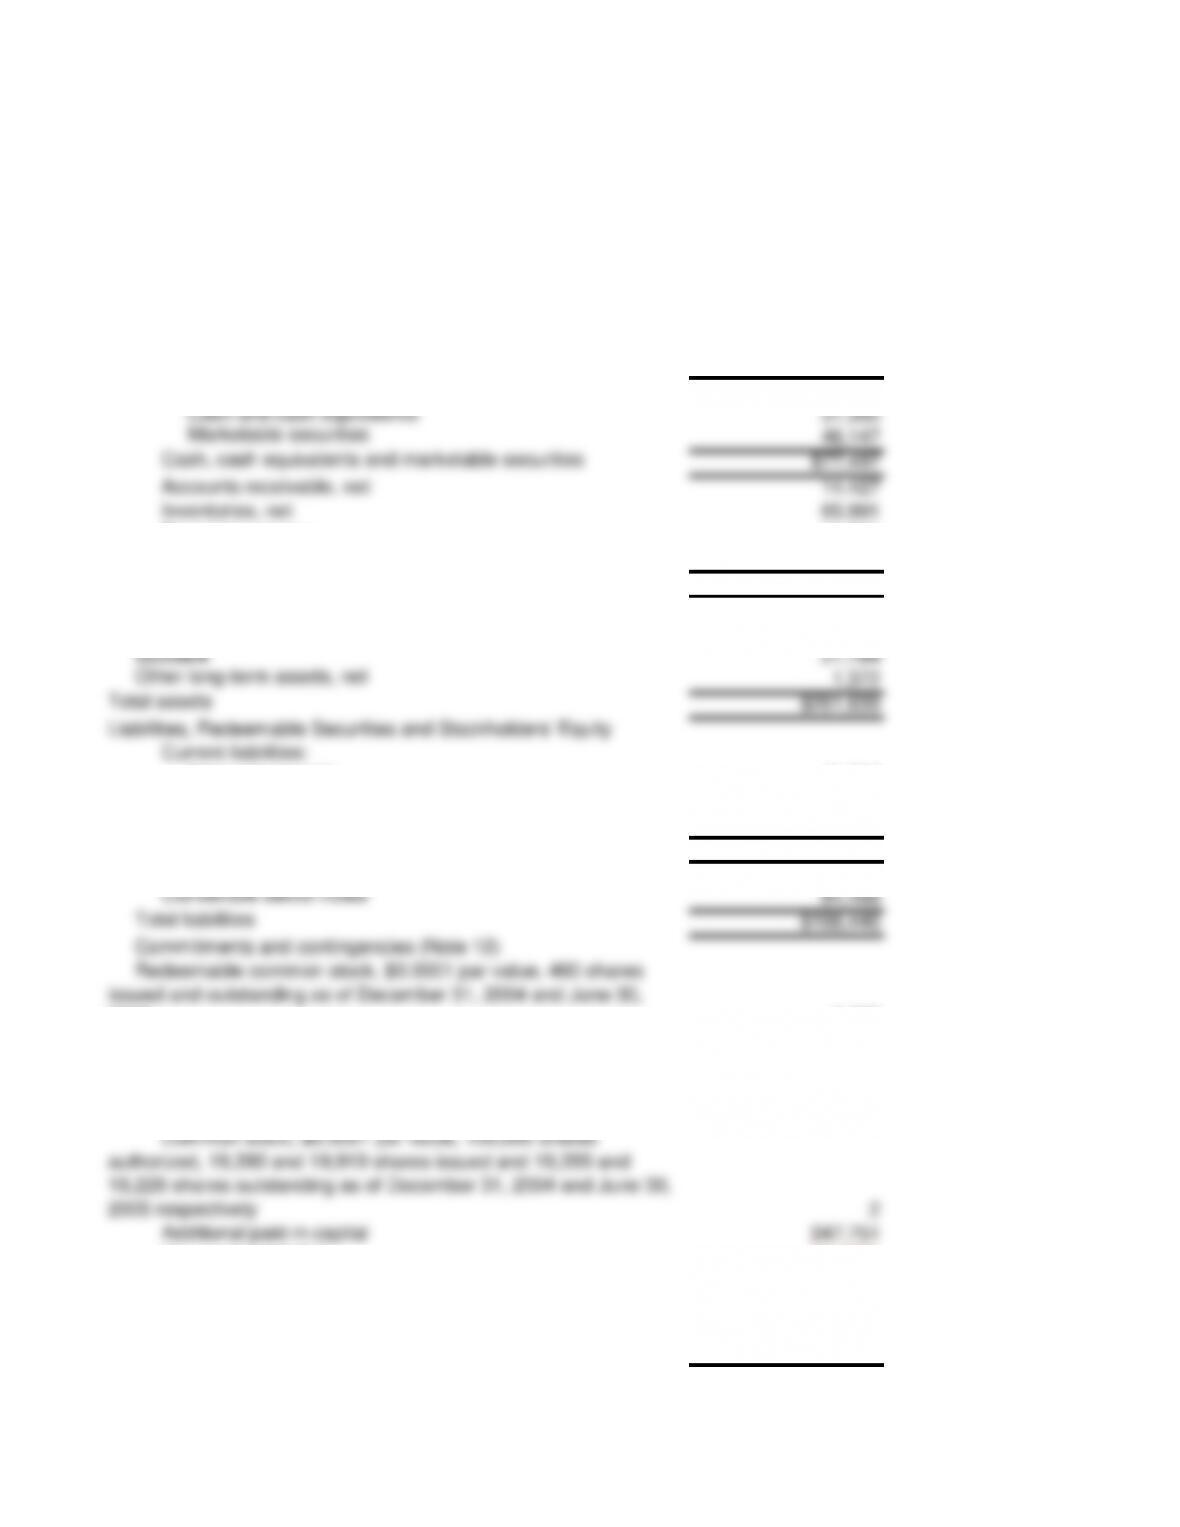
OVERSTOCK COM INC
Consolidated Balance Sheet
In Thousands 09/30/05
Current assets:
Cash and cash equivalents 31,350
Marketable securities 46,147
Cash, cash equivalents and marketable securities $77,497
Accounts receivable, net 14,427
Inventories, net 65,991
Prepaid inventory 11,221
Prepaid expenses and other assets 8,015
Total current assets $177,150
Restricted cash 833
Property and equipment, net 54,501
Goodwill 27,784
Other long-term assets, net 1,372
Total assets $261,639
Liabilities, Redeemable Securities and Stockholders’ Equity
Current liabilities:
Accounts payable 41,244
Accrued liabilities 27,250
Capital lease obligations, current 6,445
Total current liabilities $74,940
Capital lease obligations, non-current 7,038
Convertible senior notes 84,468
Total liabilities $166,446
Commitments and contingencies (Note 12)
Redeemable common stock, $0.0001 par value, 460 shares
issued and outstanding as of December 31, 2004 and June 30,
2005
3,259
Stockholders’ equity:
Preferred stock, $0.0001 par value, 5,000 shares authorized,
no shares issued and outstanding as of December 31, 2004 and
June 30, 2005 respectively
Common stock, $0.0001 par value, 100,000 shares
authorized, 19,390 and 19,919 shares issued and 19,355 and
18,228 shares outstanding as of December 31, 2004 and June 30,
2005 respectively
2
Additional paid-in capital 247,751
Accumulated deficit (89,797)
Unearned stock-based compensation (457)
Treasury stock, 35 and 1,691 shares at cost as of December
31, 2004 and June 30, 2005, respectively
(65,337)
Accumulated other comprehensive loss (227)

Total stockholders’ equity $95,194
Total liabilities, redeemable securities and stockholders’ equity 261,639
Calculations
Ending AR/Sales
Ending Inv/COGS
Ending Prep. Inv./Sales
Ending Prep./Sales
Ending PP&E/Sales
Ending AP/COGS
Ending Acc. Liab./Sales
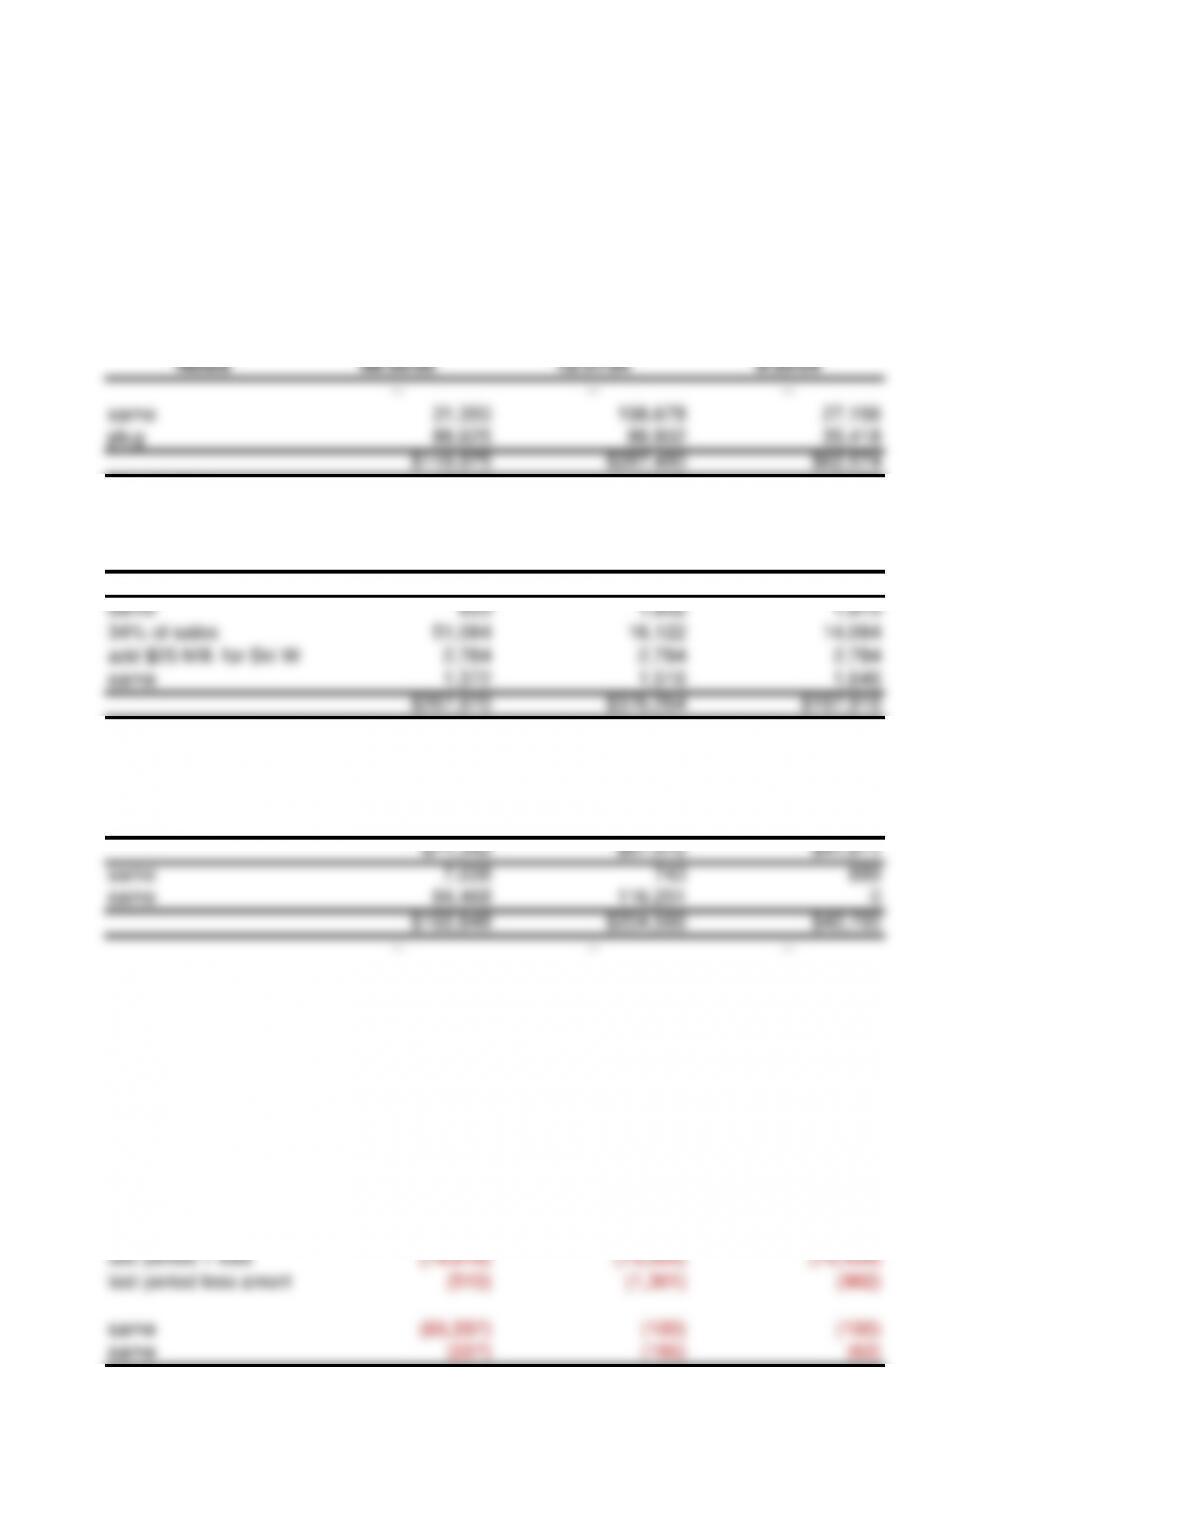
Notes 06/30/05 12/31/04 9/30/04
— — —
same 31,350 198,678 27,156
plug 88,625 88,802 35,418
$119,975 $287,480 $62,574
9% of sales 13,649 5,715 2,478
48% of COGS 59,783 45,279 34,791
7% of sales 10,410 12,322
5% of sales 8,080 3,444 15,130
$211,897 $354,240 $177,547
same 833 1,602 1,875
34% of sales 51,084 16,122 14,064
add $25 Mill. for Ski W
2,784 2,784 2,784
same 1,372 1,516 1,646
$267,970 $376,264 $197,916
— — —
— — —
same 6,445 595 600
$71,342 $87,572 $41,811
same 7,038 743 889
same 84,468 116,251 0
$162,848 $204,566 $42,700
— — —
same 3,259 3,166 3,119
— — —
— — —
same 2 2 2
same 247,751 243,131 166,104
last period + loss (79,816) (73,005) (75,439)
last period less amort (510) (1,301) (982)
same (65,337) (100) (100)
same (227) (195) (62)

$101,863 $168,532 $89,523
267,970 376,264 135,342
9.06% 2.40%
46.51% 38.79%
6.91% 0.00%
5.36% 14.63%
33.91% 13.60%
30.72% 26.17%
16.87% 17.14%
OVERSTOCK COM INC
Consolidated Statements of Cash Flows
In Thousands 09/30/05 3m
Cash flows from operating activities:
Net loss (9,981)
Adjustments to reconcile net loss to cash provided by (used in) operating
activities
Depreciation and amortization 2,930
Amortization of unearned stock-based compensation 53
Realized gain (loss) from marketable securities 0
Loss on disposition of property and equipment 0
Stock options issued to consultants for services 0
Amortization of debt discount and deferred financing fees 0
Gain from retirement of convertible senior notes 0
Issuance of common stock from treasury 0
Changes in operating assets and liabilities:
Accounts receivable, net (778)
Inventories, net (6,208)
Prepaid inventory (811)
Prepaid expenses and other assets 65
Other long-term assets, net 0
Accounts payable 1,758
Accrued liabilities 1,839
Net cash provided by (used in) operating activities (11,132)
Cash flows from investing activities:
Increase (decrease) in restricted cash 0
Investments in marketable securities 0
Sales of marketable securities 42,478
Expenditures for property and equipment (6,347)
Proceeds from the sale of property and equipment 0
Expenditures for other long-term assets (25,000)
Net cash provided by (used in) investing activities 11,132
Cash flows from financing activities:
Payments on capital lease obligations 0
Borrowings on line of credit 0
Issuance of common stock, net of issuance costs 0
Issuance of convertible senior notes 0
Payments to retire convertible senior notes 0
Purchased call options 0
Purchase of treasury stock 0
Exercise of stock options and warrants 0
Net provided by (used in) financing activities 0
Effect of exchange rate changes on cash $0
Net increase (decrease) in cash and cash equivalents 0
Cash and cash equivalents, beginning of period 31,350

Cash and cash equivalents, end of period 31,350
Notes 06/30/05 3m 06/30/04 3m
— —
From Income Statemen
(2,515) (2,322)
— —
Same as last qtr 2,930 890
From IS 53 123
assume 0 (25) —
assume 0 — —
assume 0 (15) 289
assume 0 116 —
assume 0 (4,170) —
assume 0 60 —
— —
From BS 755 4,620
From BS 2,148 443
(10,098) 10,364
— —
179 (1,875)
(36,047) (9,684)
assume 0 (2,901) (334)
assume 0 — 1,000
assume 0 — 37,857
assume 0 — —
assume 0 (27,935) —
assume 0 — —
assume 0 (24,133) —
assume 0 3,002 792
$(51,967) $39,315
assume 0 (8) 6
$(6,261) $38,210
$37,611 $7,438

compute and check to
$31,350 $45,648