
Forecast Forecast Forecast Forecast Forecast Forecast Forecast Forecast Forecast Forecast Forecast Forecast Forecast Forecast Forecast Forecast
12/31/2014 12/31/2015 12/31/2016 12/31/2017 12/31/2018 12/31/2019 12/31/2020 12/31/2021 12/31/2022 12/31/2023 12/31/2024 12/31/2025 12/31/2026 12/31/2027 12/31/2028 12/31/2029
5.0% 5.0% 5.0% 5.0% 5.0% 5.0% 5.0% 5.0% 5.0% 5.0% 5.0% 5.0% 5.0% 5.0% 5.0% 5.0%
5.0% 5.0% 5.0% 5.0% 5.0% 5.0% 5.0% 5.0% 5.0% 5.0% 5.0% 5.0% 5.0% 5.0% 5.0% 5.0%
5.0% 5.0% 5.0% 5.0% 5.0% 5.0% 5.0% 5.0% 5.0% 5.0% 5.0% 5.0% 5.0% 5.0% 5.0% 5.0%
5.0% 5.0% 5.0% 5.0% 5.0% 5.0% 5.0% 5.0% 5.0% 5.0% 5.0% 5.0% 5.0% 5.0% 5.0% 5.0%
5.0% 5.0% 5.0% 5.0% 5.0% 5.0% 5.0% 5.0% 5.0% 5.0% 5.0% 5.0% 5.0% 5.0% 5.0% 5.0%
14.2% 14.2% 14.2% 14.2% 14.2% 14.2% 14.2% 14.2% 14.2% 14.2% 14.2% 14.2% 14.2% 14.2% 14.2% 14.2%
0.142 0.142 0.142 0.142 0.142 0.142 0.142 0.142 0.142 0.142 0.142 0.142 0.142 0.142 0.142 0.142
0.130 0.130 0.130 0.130 0.130 0.130 0.130 0.130 0.130 0.130 0.130 0.130 0.130 0.130 0.130 0.130
0.142 0.142 0.142 0.142 0.142 0.142 0.142 0.142 0.142 0.142 0.142 0.142 0.142 0.142 0.142 0.142
0.040 0.040 0.040 0.040 0.040 0.040 0.040 0.040 0.040 0.040 0.040 0.040 0.040 0.040 0.040 0.040
2.060 2.060 2.060 2.060 2.060 2.060 2.060 2.060 2.060 2.060 2.060 2.060 2.060 2.060 2.060 2.060
1.746 1.746 1.746 1.746 1.746 1.746 1.746 1.746 1.746 1.746 1.746 1.746 1.746 1.746 1.746 1.746
0.142 0.142 0.142 0.142 0.142 0.142 0.142 0.142 0.142 0.142 0.142 0.142 0.142 0.142 0.142 0.142
0.040 0.040 0.040 0.040 0.040 0.040 0.040 0.040 0.040 0.040 0.040 0.040 0.040 0.040 0.040 0.040
3.594 3.594 3.594 3.594 3.594 3.594 3.594 3.594 3.594 3.594 3.594 3.594 3.594 3.594 3.594 3.594
0.142 0.142 0.142 0.142 0.142 0.142 0.142 0.142 0.142 0.142 0.142 0.142 0.142 0.142 0.142 0.142
0.046 0.046 0.046 0.046 0.046 0.046 0.046 0.046 0.046 0.046 0.046 0.046 0.046 0.046 0.046 0.046
0.097 0.097 0.097 0.097 0.097 0.097 0.097 0.097 0.097 0.097 0.097 0.097 0.097 0.097 0.097 0.097
0.000 0.000 0.000 0.000 0.000 0.000 0.000 0.000 0.000 0.000 0.000 0.000 0.000 0.000 0.000 0.000
0.142 0.142 0.142 0.142 0.142 0.142 0.142 0.142 0.142 0.142 0.142 0.142 0.142 0.142 0.142 0.142
0.538 0.538 0.538 0.538 0.538 0.538 0.538 0.538 0.538 0.538 0.538 0.538 0.538 0.538 0.538 0.538
0.159 0.159 0.159 0.159 0.159 0.159 0.159 0.159 0.159 0.159 0.159 0.159 0.159 0.159 0.159 0.159
0.056 0.056 0.056 0.056 0.056 0.056 0.056 0.056 0.056 0.056 0.056 0.056 0.056 0.056 0.056 0.056
0.036 0.036 0.036 0.036 0.036 0.036 0.036 0.036 0.036 0.036 0.036 0.036 0.036 0.036 0.036 0.036
0.040 0.040 0.040 0.040 0.040 0.040 0.040 0.040 0.040 0.040 0.040 0.040 0.040 0.040 0.040 0.040
3.594 3.594 3.594 3.594 3.594 3.594 3.594 3.594 3.594 3.594 3.594 3.594 3.594 3.594 3.594 3.594
6.447 6.447 6.447 6.447 6.447 6.447 6.447 6.447 6.447 6.447 6.447 6.447 6.447 6.447 6.447 6.447
0.000 0.000 0.000 0.000 0.000 0.000 0.000 0.000 0.000 0.000 0.000 0.000 0.000 0.000 0.000 0.000
0.000 0.000 0.000 0.000 0.000 0.000 0.000 0.000 0.000 0.000 0.000 0.000 0.000 0.000 0.000 0.000
94.209 94.209 94.209 94.209 94.209 94.209 94.209 94.209 94.209 94.209 94.209 94.209 94.209 94.209 94.209 94.209
27.690 27.690 27.690 27.690 27.690 27.690 27.690 27.690 27.690 27.690 27.690 27.690 27.690 27.690 27.690 27.690

0.000 0.000 0.000 0.000 0.000 0.000 0.000 0.000 0.000 0.000 0.000 0.000 0.000 0.000 0.000 0.000
1089.569 1089.569 1089.569 1089.569 1089.569 1089.569 1089.569 1089.569 1089.569 1089.569 1089.569 1089.569 1089.569 1089.569 1089.569 1089.569
1157.016 1157.016 1157.016 1157.016 1157.016 1157.016 1157.016 1157.016 1157.016 1157.016 1157.016 1157.016 1157.016 1157.016 1157.016 1157.016
1.751 1.751 1.751 1.751 1.751 1.751 1.751 1.751 1.751 1.751 1.751 1.751 1.751 1.751 1.751 1.751
1.631 1.631 1.631 1.631 1.631 1.631 1.631 1.631 1.631 1.631 1.631 1.631 1.631 1.631 1.631 1.631
6071.292 6071.292 6071.292 6071.292 6071.292 6071.292 6071.292 6071.292 6071.292 6071.292 6071.292 6071.292 6071.292 6071.292 6071.292 6071.292
17322.149 17322.149 17322.149 17322.149 17322.149 17322.149 17322.149 17322.149 17322.149 17322.149 17322.149 17322.149 17322.149 17322.149 17322.149 17322.149
0.080 0.080 0.080 0.080 0.080 0.080 0.080 0.080 0.080 0.080 0.080 0.080 0.080 0.080 0.080 0.080
2.0% 2.0% 2.0% 2.0% 2.0% 2.0% 2.0% 2.0% 2.0% 2.0% 2.0% 2.0% 2.0% 2.0% 2.0% 2.0%
0.427 0.427 0.427 0.427 0.427 0.427 0.427 0.427 0.427 0.427 0.427 0.427 0.427 0.427 0.427 0.427
3.0% 3.0% 3.0% 3.0% 3.0% 3.0% 3.0% 3.0% 3.0% 3.0% 3.0% 3.0% 3.0% 3.0% 3.0% 3.0%
1.631 1.631 1.631 1.631 1.631 1.631 1.631 1.631 1.631 1.631 1.631 1.631 1.631 1.631 1.631 1.631
2.5% 2.5% 2.5% 2.5% 2.5% 2.5% 2.5% 2.5% 2.5% 2.5% 2.5% 2.5% 2.5% 2.5% 2.5% 2.5%
6071.29 6071.29 6071.29 6071.29 6071.29 6071.29 6071.29 6071.29 6071.29 6071.29 6071.29 6071.29 6071.29 6071.29 6071.29 6071.29
1.0% 1.0% 1.0% 1.0% 1.0% 1.0% 1.0% 1.0% 1.0% 1.0% 1.0% 1.0% 1.0% 1.0% 1.0% 1.0%
0.00 0.00 0.00 0.00 0.00 0.00 0.00 0.00 0.00 0.00 0.00 0.00 0.00 0.00 0.00 0.00
3.0% 3.0% 3.0% 3.0% 3.0% 3.0% 3.0% 3.0% 3.0% 3.0% 3.0% 3.0% 3.0% 3.0% 3.0% 3.0%
5.0% 5.0% 5.0% 5.0% 5.0% 5.0% 5.0% 5.0% 5.0% 5.0% 5.0% 5.0% 5.0% 5.0% 5.0% 5.0%
3.0% 3.0% 3.0% 3.0% 3.0% 3.0% 3.0% 3.0% 3.0% 3.0% 3.0% 3.0% 3.0% 3.0% 3.0% 3.0%
2.4% 2.4% 2.4% 2.4% 2.4% 2.4% 2.4% 2.4% 2.4% 2.4% 2.4% 2.4% 2.4% 2.4% 2.4% 2.4%
2014 2015 2016 2017 2018 2019 2020 2021 2022 2023 2024 2025 2026 2027 2028 2029
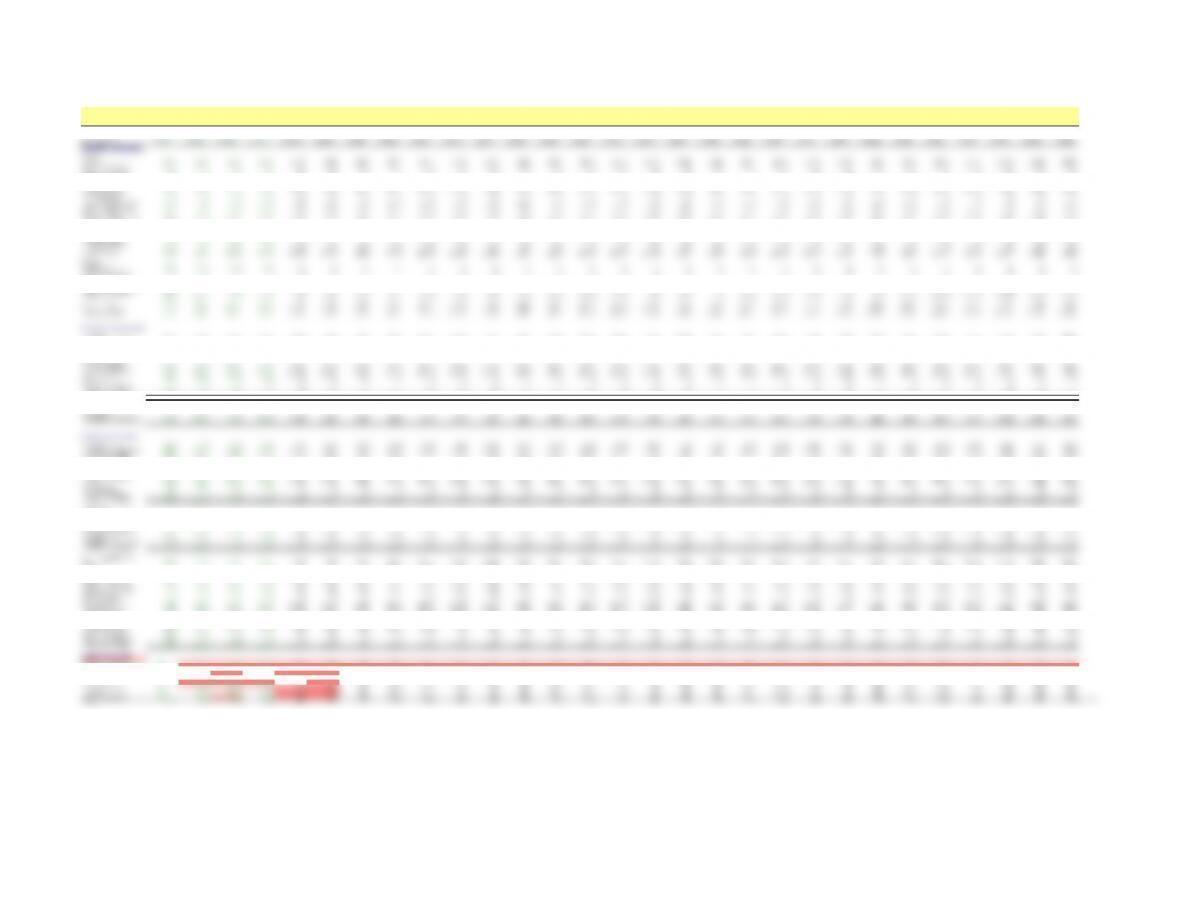
Cash Flow Analysis ($000)
Company Name NETFLIX INC
Actual Actual Actual Actual Forecast Forecast Forecast Forecast Forecast Forecast Forecast Forecast Forecast Forecast Forecast Forecast Forecast Forecast Forecas t Forecast Forecast Forecast Forecast Forecast Forecast Forecast Forecast Forecast Forecast
Fiscal Year End Date 12/31/2001 12/31/2002 12/31/2003 12/31/2004 12/31/2005 12/31/2006 12/31/2007 12/31/2008 12/31/2009 12/31/2010 12/31/2011 12/31/2012 12/31/2013 12/31/2014 12/31/2015 12/31/2016 12/31/2017 12/31/2018 12/31/2019 12/31/2020 12/31/2021 12/31/2022 12/31/2023 12/31/2024 12/31/2025 12/31/2026 12/31/2027 12/31/2028 12/31/2029
Pro Forma Statement of Cash Flows
Operating:
Net Income (38,618) (21,947) 6,512 21,595 18,400 62,038 76,216 85,641 87,191 79,483 83,457 87,630 92,011 96,612 101,442 106,514 111,840 117,432 123,304 129,469 135,942 142,740 149,877 157,370 165,239 173,501 182,176 191,285 200,849
+Depreciation & Amortization 29,797 26,477 50,991 88,204 109,380 101,324 136,047 169,796 195,892 207,566 217,944 228,841 240,283 252,297 264,912 278,158 292,066 306,669 322,002 338,102 355,008 372,758 391,396 410,966 431,514 453,090 475,744 499,531 524,508
+Increase in Deferred Taxes 00000000000000000000000000000
+Increase in Other Liabilities 240 48 (47) 359 218 362 406 390 292 113 119 125 131 138 145 152 160 168 176 185 194 204 214 225 236 248 260 273 287
+Increase in Minority Interest 101,830 (101,830) 0 0 0000000000000000000000000
+Preferred Dividends 00000000000000000000000000000
=Funds From Operations 93,249 (97,252) 57,456 110,158 127,999 163,724 212,669 255,827 283,376 287,162 301,520 316,596 332,426 349,047 366,499 384,824 404,065 424,269 445,482 467,756 491,144 515,701 541,486 568,561 596,989 626,838 658,180 691,089 725,643
-Increase in Receivables 00000000000000000000000000000
-Increase in Inventory 00000000000000000000000000000
-Increase in Other Current Assets (3,421) (44) (290) (9,130) (4,690) (7,768) (8,718) (8,379) (6,281) (2,436) (2,558) (2,686) (2,820) (2,961) (3,109) (3,265) (3,428) (3,599) (3,779) (3,968) (4,167) (4,375) (4,594) (4,823) (5,064) (5,318) (5,584) (5,863) (6,156)
+Increase in Accounts Payable 13,715 6,635 12,304 17,121 27,269 44,584 41,840 40,213 30,145 11,691 12,276 12,890 13,534 14,211 14,921 15,668 16,451 17,273 18,137 19,044 19,996 20,996 22,046 23,148 24,305 25,521 26,797 28,137 29,543
+Increase in Taxes Payable 00000000000000000000000000000
+Increase in Other Curr. Liabilities 9,481 9,364 11,104 15,118 16,404 27,170 30,493 29,307 21,969 8,521 8,947 9,394 9,864 10,357 10,875 11,418 11,989 12,589 13,218 13,879 14,573 15,302 16,067 16,870 17,714 18,599 19,529 20,506 21,531
=Cash From Operations 113,024 (81,297) 80,574 133,267 166,982 227,710 276,284 316,969 329,209 304,938 320,184 336,194 353,003 370,653 389,186 408,645 429,078 450,532 473,058 496,711 521,547 547,624 575,005 603,755 633,943 665,640 698,922 733,868 770,562
Investing:
-Capital Expenditures (41,635) (30,231) (45,171) (97,160) (116,197) (112,615) (148,719) (181,975) (205,022) (211,106) (221,662) (232,745) (244,382) (256,601) (269,431) (282,903) (297,048) (311,900) (327,495) (343,870) (361,063) (379,117) (398,072) (417,976) (438,875) (460,819) (483,860) (508,053) (533,455)
-Increase in Investments 00000000000000000000000000000
-Purchases of Intangibles (7,917) 1,823 3,146 1,987 (350) (579) (650) (625) (468) (182) (191) (200) (210) (221) (232) (243) (256) (268) (282) (296) (311) (326) (343) (360) (378) (397) (416) (437) (459)
-Increase in Other Assets (2,323) 554 (22,577) (20,412) (16,292) (26,984) (30,284) (29,106) (21,819) (8,462) (8,885) (9,329) (9,796) (10,286) (10,800) (11,340) (11,907) (12,502) (13,128) (13,784) (14,473) (15,197) (15,957) (16,754) (17,592) (18,472) (19,395) (20,365) (21,383)
=Cash From Investing (51,875) (27,854) (64,602) (115,585) (132,839) (140,178) (179,653) (211,706) (227,309) (219,750) (230,738) (242,275) (254,388) (267,108) (280,463) (294,486) (309,211) (324,671) (340,905) (357,950) (375,847) (394,640) (414,372) (435,090) (456,845) (479,687) (503,671) (528,855) (555,298)
Financing:
+Increase in Debt 6,868 (5,177) (1,231) (392) 25 41 46 44 33 13 13 14 15 16 16 17 18 19 20 21 22 23 24 25 27 28 29 31 32
-Dividends Paid on Preferred 00000000000000000000000000000
+Increase in Pref. Stock 6 (6) 0 0 0000000000000000000000000
-Dividends Paid on Common 00000000000000000000000000000
+/-Net Issuance of Common Stock 46,756 201,813 17,432 21,980 29,336 17,607 21,365 8,146 (16,886) (52,216) (54,827) (57,568) (60,446) (63,469) (66,642) (69,974) (73,473) (77,147) (81,004) (85,054) (89,307) (93,772) (98,461) (103,384) (108,553) (113,981) (119,680) (125,664) (131,947)
+/-Clean Surplus Plug (Ignore) (98,648) 0 (592) 0 0000000000000000000000000
=Cash From Financing (45,018) 196,630 15,609 21,588 29,360 17,648 21,411 8,190 (16,853) (52,203) (54,813) (57,554) (60,432) (63,453) (66,626) (69,957) (73,455) (77,128) (80,984) (85,033) (89,285) (93,749) (98,437) (103,358) (108,526) (113,953) (119,650) (125,633) (131,915)
Net Change in Cash 16,131 87,479 31,581 39,270 63,504 105,180 118,042 113,452 85,047 32,984 34,634 36,365 38,183 40,093 42,097 44,202 46,412 48,733 51,169 53,728 56,414 59,235 62,197 65,307 68,572 72,001 75,601 79,381 83,350
+ Beginning Cash Balance 0 16,131 103,610 135,191 174,461 237,965 343,145 461,187 574,639 659,686 692,670 727,304 763,669 801,852 841,945 884,042 928,244 974,656 1,023,389 1,074,559 1,128,287 1,184,701 1,243,936 1,306,133 1,371,440 1,440,012 1,512,012 1,587,613 1,666,993
= Ending Cash Balance 16,131 103,610 135,191 174,461 237,965 343,145 461,187 574,639 659,686 692,670 727,304 763,669 801,852 841,945 884,042 928,244 974,656 1,023,389 1,074,559 1,128,287 1,184,701 1,243,936 1,306,133 1,371,440 1,440,012 1,512,012 1,587,613 1,666,993 1,750,343
Net Income (38,618) (21,947) 6,512 21,595 18,400 62,038 76,216 85,641 87,191 79,483 83,457 87,630 92,011 96,612 101,442 106,514 111,840 117,432 123,304 129,469 135,942 142,740 149,877 157,370 165,239 173,501 182,176 191,285 200,849
-Dividends Paid on Preferred 00000000000000000000000000000
+Increase in Preferred Stock 6 (6) 0 0 0000000000000000000000000
+/-Clean Surplus Plug (Ignore) (98,648) 0 (592) 0 0000000000000000000000000
=Free Cash Flow to Common Equity (46,756) (201,813) (17,432) (21,980) (29,336) (17,607) (21,365) (8,146) 16,886 52,216 54,827 57,568 60,446 63,469 66,642 69,974 73,473 77,147 81,004 85,054 89,307 93,772 98,461 103,384 108,553 113,981 119,680 125,664 131,947
= Free Cash Flow to Common Equity (46,756) (201,813) (17,432) (21,980) (29,336) (17,607) (21,365) (8,146) 16,886 52,216 54,827 57,568 60,446 63,469 66,642 69,974 73,473 77,147 81,004 85,054 89,307 93,772 98,461 103,384 108,553 113,981 119,680 125,664 131,947
Net Operating Income -36,766 -9,975 6,929 21,764 18,444 62,090 76,267 85,684 87,220 79,495 83,469 87,643 92,025 96,626 101,458 106,531 111,857 117,450 123,322 129,489 135,963 142,761 149,899 157,394 165,264 173,527 182,203 191,314 200,879
+Interest Expense 1,852 11,972 417 170 44 51 56 53 40 18 19 20 21 22 24 25 26 27 29 30 32 33 35 37 38 40 42 44 47
-Tax Shield on Interest 0 0 0 (1) 0 0 (5) (9) (10) (6) (7) (7) (7) (8) (8) (9) (9) (10) (10) (11) (11) (12) (12) (13) (13) (14) (15) (16) (16)
+/-Clean Surplus Plug (Ignore) (98,648) 0 (592) 0 0000000000000000000000000
=Free Cash Flow to Investors (51,778) (184,658) (15,784) (21,419) (29,316) (17,597) (21,360) (8,146) 16,883 52,215 54,826 57,567 60,445 63,468 66,641 69,973 73,472 77,145 81,003 85,053 89,305 93,771 98,459 103,382 108,551 113,979 119,678 125,662 131,945
+Dividends on Preferred Stock 00000000000000000000000000000
-Net Issuance of Common Stock (46,756) (201,813) (17,432) (21,980) (29,336) (17,607) (21,365) (8,146) 16,886 52,216 54,827 57,568 60,446 63,469 66,642 69,974 73,473 77,147 81,004 85,054 89,307 93,772 98,461 103,384 108,553 113,981 119,680 125,664 131,947
-Net Issuance of Debt (6,868) 5,177 1,231 392 (25) (41) (46) (44) (33) (13) (13) (14) (15) (16) (16) (17) (18) (19) (20) (21) (22) (23) (24) (25) (27) (28) (29) (31) (32)
-Net Issuance of Preferred Stock (6) 6 0 0 0000000000000000000000000
=Free Cash Flow to Investors (51,778) (184,658) (15,784) (21,419) (29,316) (17,597) (21,360) (8,146) 16,883 52,215 54,826 57,567 60,445 63,468 66,641 69,973 73,472 77,145 81,003 85,053 89,305 93,771 98,459 103,382 108,551 113,979 119,678 125,662 131,945
Traditional Computation of FCF:
EBIT (36,556) (11,672) 4,472 19,354 14,909 56,991 76,728 95,322 108,464 112,008 117,609 123,489 129,664 136,147 142,954 150,102 157,607 165,487 173,762 182,450 191,572 201,151 211,209 221,769 232,858 244,500 256,725 269,562 283,040
=Gross Cash Flow (6,969) 16,502 57,920 109,968 127,825 163,413 212,314 255,481 283,113 287,060 301,413 316,484 332,308 348,924 366,370 384,688 403,923 424,119 445,325 467,591 490,970 515,519 541,295 568,360 596,778 626,617 657,947 690,845 725,387
-Increase in W orking Capital 3,644 (71,524) (8,463) (16,161) (24,520) (41,194) (54,427) (52,311) (39,214) (15,209) (15,969) (16,767) (17,606) (18,486) (19,410) (20,381) (21,400) (22,470) (23,593) (24,773) (26,012) (27,312) (28,678) (30,112) (31,617) (33,198) (34,858) (36,601) (38,431)
-Capital Expenditures (41,635) (30,231) (45,171) (97,160) (116,197) (112,615) (148,719) (181,975) (205,022) (211,106) (221,662) (232,745) (244,382) (256,601) (269,431) (282,903) (297,048) (311,900) (327,495) (343,870) (361,063) (379,117) (398,072) (417,976) (438,875) (460,819) (483,860) (508,053) (533,455)
+Increase in Minority Interest 101,830 (101,830) 0 0 0000000000000000000000000
+Increase in Other Liabilities 240 48 (47) 359 218 362 406 390 292 113 119 125 131 138 145 152 160 168 176 185 194 204 214 225 236 248 260 273 287
+/-Clean Surplus Plug (Ignore) (98,648) 0 (592) 0 0000000000000000000000000
=Free Cash Flow to Investors (51,778) (184,658) (15,784) (21,419) (29,316) (17,597) (21,360) (8,146) 16,883 52,215 54,826 57,567 60,445 63,468 66,641 69,973 73,472 77,145 81,003 85,053 89,305 93,771 98,459 103,382 108,551 113,979 119,678 125,662 131,945
+ Non-Current Op. Accruals/NOA #DIV/0! (1.034) (1.087) (1.227) (1.283) (1.137) (0.728) (0.521) (0.313) (0.106) (0.106) (0.106) (0.106) (0.106) (0.106) (0.106) (0.106) (0.106) (0.106) (0.106) (0.106) (0.106) (0.106) (0.106) (0.106) (0.106) (0.106) (0.106) (0.106)
= Operating Accruals/NOA #DIV/0! (0.874) 0.753 (0.178) 0.869 0.753 0.344 0.246 0.148 0.050 0.050 0.050 0.050 0.050 0.050 0.050 0.050 0.050 0.050 0.050 0.050 0.050 0.050 0.050 0.050 0.050 0.050 0.050 0.050
Free Cash Flow to Common Equity
Free Cash Flow to all Investors
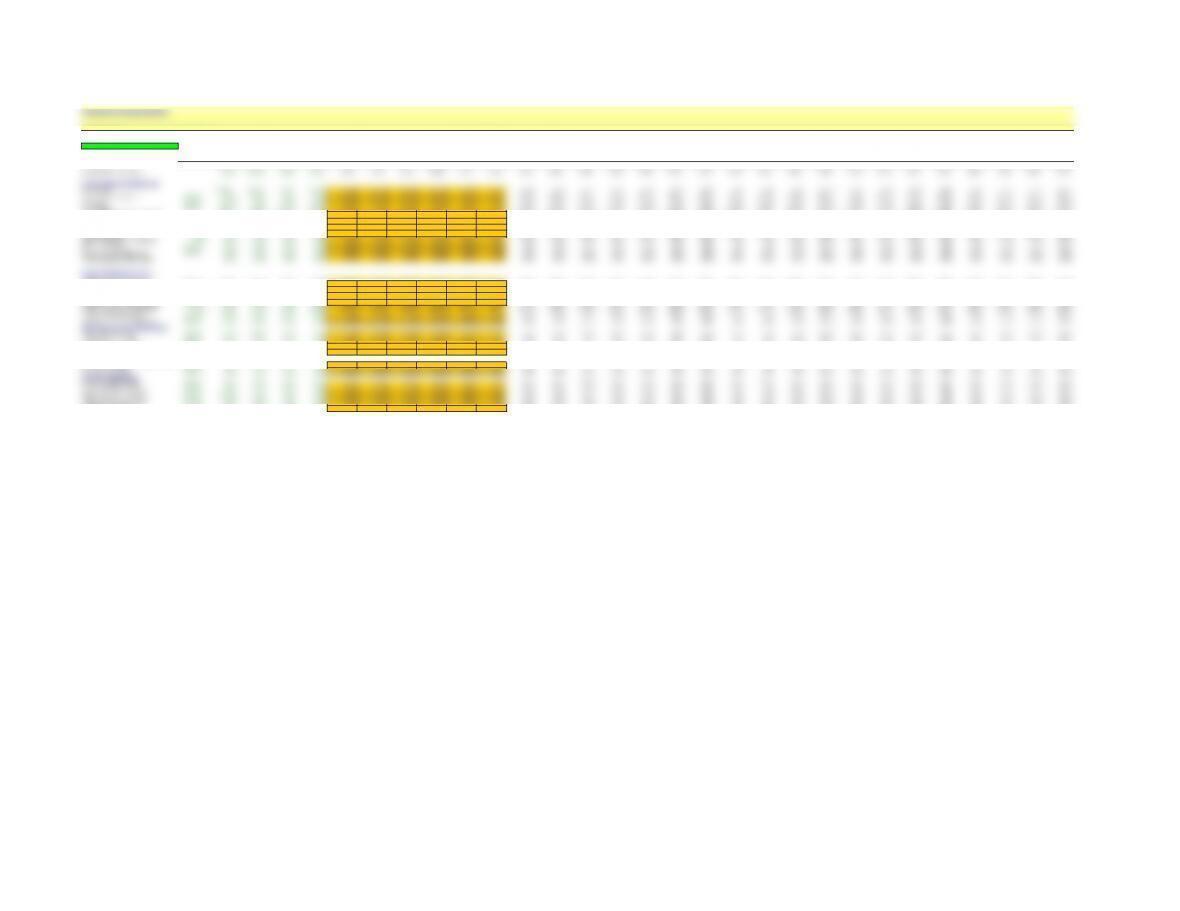
Forecasting Assumptions
Company Name NETFLIX INC
Forecast Horizon 5 Years TERMINAL
Estimated Price/Share=$12.07 YEAR
Actual Actual Actual Actual Actual Forecast Forecast Forecast Forecast Forecast Forecast Forecast Forecast Forecast Forecast Forecast Forecast Forecast Forecast Forecast Forecast Forecast Forecast Forecast Forecast Forecast Forecast Forecast Forecast Forecast
Fiscal Year End Date 1/0/1900 12/31/2001 12/31/2002 12/31/2003 12/31/2004 12/31/2005 12/31/2006 12/31/2007 12/31/2008 12/31/2009 12/31/2010 12/31/2011 12/31/2012 12/31/2013 12/31/2014 12/31/2015 12/31/2016 12/31/2017 12/31/2018 12/31/2019 12/31/2020 12/31/2021 12/31/2022 12/31/2023 12/31/2024 12/31/2025 12/31/2026 12/31/2027 12/31/2028 12/31/2029
Implied Return on Equity 0.853 38.036 0.064 0.161 0.102 0.254 0.229 0.200 0.171 0.142 0.142 0.142 0.142 0.142 0.142 0.142 0.142 0.142 0.142 0.142 0.142 0.142 0.142 0.142 0.142 0.142 0.142 0.142 0.142
Income Statement Assumptions
Sales Growth #DIV/0! 101.3% 78.2% 85.9% 36.4% 44.2% 34.4% 24.6% 14.8% 5.0% 5.0% 5.0% 5.0% 5.0% 5.0% 5.0% 5.0% 5.0% 5.0% 5.0% 5.0% 5.0% 5.0% 5.0% 5.0% 5.0% 5.0% 5.0% 5.0%
Cost of Goods Sold/Sales #DIV/0! 26.5% 33.8% 35.8% 37.2% 42.2% 46.2% 46.2% 46.2% 46.2% 46.2% 46.2% 46.2% 46.2% 46.2% 46.2% 46.2% 46.2% 46.2% 46.2% 46.2% 46.2% 46.2% 46.2% 46.2% 46.2% 46.2% 46.2% 46.2% 46.2%
R&D/Sales #DIV/0! 23.4% 9.6% 6.6% 4.5% 4.4% 3.9% 3.9% 3.9% 3.9% 3.9% 3.9% 3.9% 3.9% 3.9% 3.9% 3.9% 3.9% 3.9% 3.9% 3.9% 3.9% 3.9% 3.9% 3.9% 3.9% 3.9% 3.9% 3.9% 3.9%
SG&A/Sales #DIV/0! 59.1% 46.9% 37.3% 37.0% 35.4% 34.0% 34.0% 34.0% 34.0% 34.0% 34.0% 34.0% 34.0% 34.0% 34.0% 34.0% 34.0% 34.0% 34.0% 34.0% 34.0% 34.0% 34.0% 34.0% 34.0% 34.0% 34.0% 34.0% 34.0%
Dep&Amort/Avge PP&E and Intang. 301.7% 127.8% 296.4% 544.3% 470.0% 309.0% 299.8% 290.5% 281.3% 272.0% 272.0% 272.0% 272.0% 272.0% 272.0% 272.0% 272.0% 272.0% 272.0% 272.0% 272.0% 272.0% 272.0% 272.0% 272.0% 272.0% 272.0% 272.0% 272.0%
Interest Expense/Avge Debt 53.9% 279.8% 38.8% 64.4% 54.8% 45.3% 35.7% 26.1% 16.6% 7.0% 7.0% 7.0% 7.0% 7.0% 7.0% 7.0% 7.0% 7.0% 7.0% 7.0% 7.0% 7.0% 7.0% 7.0% 7.0% 7.0% 7.0% 7.0% 7.0%
Non-Operating Income/Sales #DIV/0! -0.3% 1.1% 0.9% 0.5% 0.5% 0.5% 0.5% 0.5% 0.5% 0.5% 0.5% 0.5% 0.5% 0.5% 0.5% 0.5% 0.5% 0.5% 0.5% 0.5% 0.5% 0.5% 0.5% 0.5% 0.5% 0.5% 0.5% 0.5% 0.5%
Effective Tax Rate 0.0% 0.0% 0.0% 0.0% 0.8% 0.0% 0.0% 8.8% 17.5% 26.3% 35.0% 35.0% 35.0% 35.0% 35.0% 35.0% 35.0% 35.0% 35.0% 35.0% 35.0% 35.0% 35.0% 35.0% 35.0% 35.0% 35.0% 35.0% 35.0% 35.0%
Minority Interest/After Tax Income 0.0% 0.0% 0.0% 0.0% 0.0% 0.0% 0.0% 0.0% 0.0% 0.0% 0.0% 0.0% 0.0% 0.0% 0.0% 0.0% 0.0% 0.0% 0.0% 0.0% 0.0% 0.0% 0.0% 0.0% 0.0% 0.0% 0.0% 0.0% 0.0% 0.0%
Other Income/Sales #DIV/0! 0.0% 0.0% 0.0% 0.0% 0.0% 0.0% 0.0% 0.0% 0.0% 0.0% 0.0% 0.0% 0.0% 0.0% 0.0% 0.0% 0.0% 0.0% 0.0% 0.0% 0.0% 0.0% 0.0% 0.0% 0.0% 0.0% 0.0% 0.0% 0.0%
Ext. Items & Disc. Ops./Sales #DIV/0! 0.0% 0.0% 0.0% 0.0% 0.0% 0.0% 0.0% 0.0% 0.0% 0.0% 0.0% 0.0% 0.0% 0.0% 0.0% 0.0% 0.0% 0.0% 0.0% 0.0% 0.0% 0.0% 0.0% 0.0% 0.0% 0.0% 0.0% 0.0% 0.0%
Pref. Dividends/Avge Pref. Stock 0.0% 0.0% 0.0% 0.0% 0.0% 0.0% 0.0% 0.0% 0.0% 0.0% 0.0% 0.0% 0.0% 0.0% 0.0% 0.0% 0.0% 0.0% 0.0% 0.0% 0.0% 0.0% 0.0% 0.0% 0.0% 0.0% 0.0% 0.0% 0.0%
Balance Sheet Assumptions:
Working Capital Assumptions
Ending Operating Cash/Sales #DIV/0! 21.2% 67.8% 49.7% 34.5% 34.5% 34.5% 34.5% 34.5% 34.5% 34.5% 34.5% 34.5% 34.5% 34.5% 34.5% 34.5% 34.5% 34.5% 34.5% 34.5% 34.5% 34.5% 34.5% 34.5% 34.5% 34.5% 34.5% 34.5% 34.5%
Ending Receivables/Sales #DIV/0! 0.0% 0.0% 0.0% 0.0% 0.0% 0.0% 0.0% 0.0% 0.0% 0.0% 0.0% 0.0% 0.0% 0.0% 0.0% 0.0% 0.0% 0.0% 0.0% 0.0% 0.0% 0.0% 0.0% 0.0% 0.0% 0.0% 0.0% 0.0% 0.0%
Ending Inventories/COGS 0.0% 0.0% 0.0% 0.0% 0.0% 0.0% 0.0% 0.0% 0.0% 0.0% 0.0% 0.0% 0.0% 0.0% 0.0% 0.0% 0.0% 0.0% 0.0% 0.0% 0.0% 0.0% 0.0% 0.0% 0.0% 0.0% 0.0% 0.0% 0.0% 0.0%
Ending Other Current Assets/Sales #DIV/0! 4.5% 2.3% 1.4% 2.5% 2.5% 2.5% 2.5% 2.5% 2.5% 2.5% 2.5% 2.5% 2.5% 2.5% 2.5% 2.5% 2.5% 2.5% 2.5% 2.5% 2.5% 2.5% 2.5% 2.5% 2.5% 2.5% 2.5% 2.5% 2.5%
Ending Accounts Payable/COGS 0.0% 68.2% 39.4% 33.5% 26.4% 26.4% 26.4% 26.4% 26.4% 26.4% 26.4% 26.4% 26.4% 26.4% 26.4% 26.4% 26.4% 26.4% 26.4% 26.4% 26.4% 26.4% 26.4% 26.4% 26.4% 26.4% 26.4% 26.4% 26.4% 26.4%
Ending Taxes Payable/Sales #DIV/0! 0.0% 0.0% 0.0% 0.0% 0.0% 0.0% 0.0% 0.0% 0.0% 0.0% 0.0% 0.0% 0.0% 0.0% 0.0% 0.0% 0.0% 0.0% 0.0% 0.0% 0.0% 0.0% 0.0% 0.0% 0.0% 0.0% 0.0% 0.0% 0.0%
Ending Other Current Liabs/Sales #DIV/0! 12.5% 12.3% 11.0% 8.9% 8.9% 8.9% 8.9% 8.9% 8.9% 8.9% 8.9% 8.9% 8.9% 8.9% 8.9% 8.9% 8.9% 8.9% 8.9% 8.9% 8.9% 8.9% 8.9% 8.9% 8.9% 8.9% 8.9% 8.9% 8.9%
Other Operating Asset Assumptions
Ending Net PP&E/Sales #DIV/0! 15.6% 10.2% 3.6% 3.7% 3.7% 3.7% 3.7% 3.7% 3.7% 3.7% 3.7% 3.7% 3.7% 3.7% 3.7% 3.7% 3.7% 3.7% 3.7% 3.7% 3.7% 3.7% 3.7% 3.7% 3.7% 3.7% 3.7% 3.7% 3.7%
Ending Investments/Sales #DIV/0! 0.0% 0.0% 0.0% 0.0% 0.0% 0.0% 0.0% 0.0% 0.0% 0.0% 0.0% 0.0% 0.0% 0.0% 0.0% 0.0% 0.0% 0.0% 0.0% 0.0% 0.0% 0.0% 0.0% 0.0% 0.0% 0.0% 0.0% 0.0% 0.0%
Ending Intangibles/Sales #DIV/0! 10.4% 4.0% 1.1% 0.2% 0.2% 0.2% 0.2% 0.2% 0.2% 0.2% 0.2% 0.2% 0.2% 0.2% 0.2% 0.2% 0.2% 0.2% 0.2% 0.2% 0.2% 0.2% 0.2% 0.2% 0.2% 0.2% 0.2% 0.2% 0.2%
Ending Other Assets/Sales #DIV/0! 3.1% 1.2% 8.9% 8.8% 8.8% 8.8% 8.8% 8.8% 8.8% 8.8% 8.8% 8.8% 8.8% 8.8% 8.8% 8.8% 8.8% 8.8% 8.8% 8.8% 8.8% 8.8% 8.8% 8.8% 8.8% 8.8% 8.8% 8.8% 8.8%
Other Operating Liability Assumptions
Other Liabilities/Sales #DIV/0! 0.3% 0.2% 0.1% 0.1% 0.1% 0.1% 0.1% 0.1% 0.1% 0.1% 0.1% 0.1% 0.1% 0.1% 0.1% 0.1% 0.1% 0.1% 0.1% 0.1% 0.1% 0.1% 0.1% 0.1% 0.1% 0.1% 0.1% 0.1% 0.1%
Deferred Taxes/Sales #DIV/0! 0.0% 0.0% 0.0% 0.0% 0.0% 0.0% 0.0% 0.0% 0.0% 0.0% 0.0% 0.0% 0.0% 0.0% 0.0% 0.0% 0.0% 0.0% 0.0% 0.0% 0.0% 0.0% 0.0% 0.0% 0.0% 0.0% 0.0% 0.0% 0.0%
Financing Assumptions
Current Debt/Total Assets #DIV/0! 7.2% 0.9% 0.2% 0.0% 0.0% 0.0% 0.0% 0.0% 0.0% 0.0% 0.0% 0.0% 0.0% 0.0% 0.0% 0.0% 0.0% 0.0% 0.0% 0.0% 0.0% 0.0% 0.0% 0.0% 0.0% 0.0% 0.0% 0.0% 0.0%
Long-Term Debt/Total Assets #DIV/0! 9.3% 0.4% 0.0% 0.0% 0.0% 0.0% 0.0% 0.0% 0.0% 0.0% 0.0% 0.0% 0.0% 0.0% 0.0% 0.0% 0.0% 0.0% 0.0% 0.0% 0.0% 0.0% 0.0% 0.0% 0.0% 0.0% 0.0% 0.0% 0.0%
Minority Interest/Total Assets #DIV/0! 244.6% 0.0% 0.0% 0.0% 0.0% 0.0% 0.0% 0.0% 0.0% 0.0% 0.0% 0.0% 0.0% 0.0% 0.0% 0.0% 0.0% 0.0% 0.0% 0.0% 0.0% 0.0% 0.0% 0.0% 0.0% 0.0% 0.0% 0.0% 0.0%
Preferred Stock/Total Assets #DIV/0! 0.0% 0.0% 0.0% 0.0% 0.0% 0.0% 0.0% 0.0% 0.0% 0.0% 0.0% 0.0% 0.0% 0.0% 0.0% 0.0% 0.0% 0.0% 0.0% 0.0% 0.0% 0.0% 0.0% 0.0% 0.0% 0.0% 0.0% 0.0% 0.0%
Dividend Payout Ratio 0.0% 0.0% 0.0% 0.0% 0.0% 0.0% 0.0% 0.0% 0.0% 0.0% 0.0% 0.0% 0.0% 0.0% 0.0% 0.0% 0.0% 0.0% 0.0% 0.0% 0.0% 0.0% 0.0% 0.0% 0.0% 0.0% 0.0% 0.0% 0.0% 0.0%
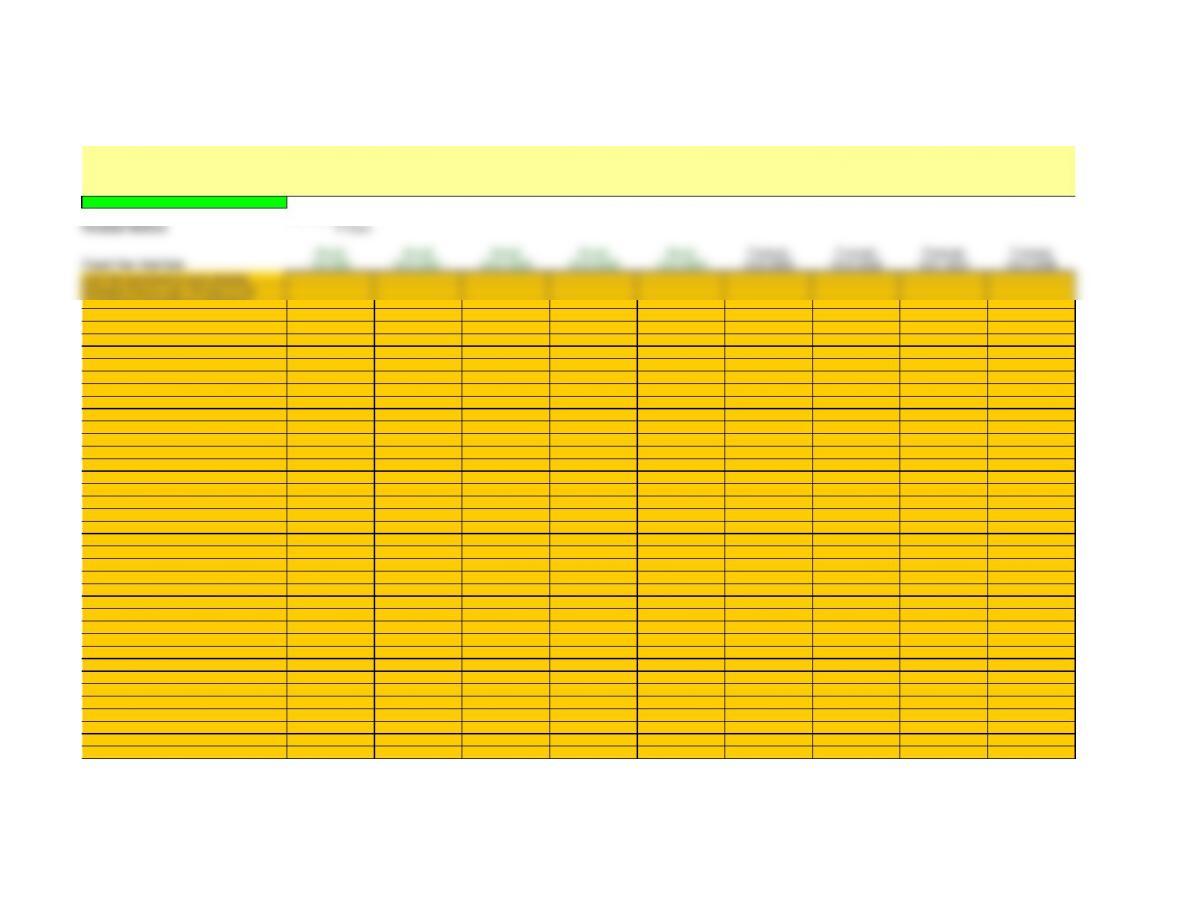
User Worksheet
Estimated Price/Share=$12.07
Company Name NETFLIX INC
Forecast Horizon 5 Years
Actual Actual Actual Actual Actual Forecast Forecast Forecast Forecast
Fiscal Year End Date 1/0/1900 12/31/2001 12/31/2002 12/31/2003 12/31/2004 12/31/2005 12/31/2006 12/31/2007 12/31/2008
(Use this worksheet to build detailed
forecasts that you can link back to the
Forecasting Assumptions worksheet.)


TERMINAL
YEAR
Forecast Forecast Forecast Forecast Forecast Forecast Forecast Forecast Forecast Forecast Forecast
12/31/2009 12/31/2010 12/31/2011 12/31/2012 12/31/2013 12/31/2014 12/31/2015 12/31/2016 12/31/2017 12/31/2018 12/31/2019