


Data Center
Industry Code LookUp
Annual Financia
Click Here f
To import historical data double-click any cell or enter ticker above:
Company Name
Ticker
Industry
Sector
ONTN
Go
Search
Links to SEC filings, Company

cial Data is originally from April 2006
Here for an annual update
any Websites, News and Analyst Forecasts

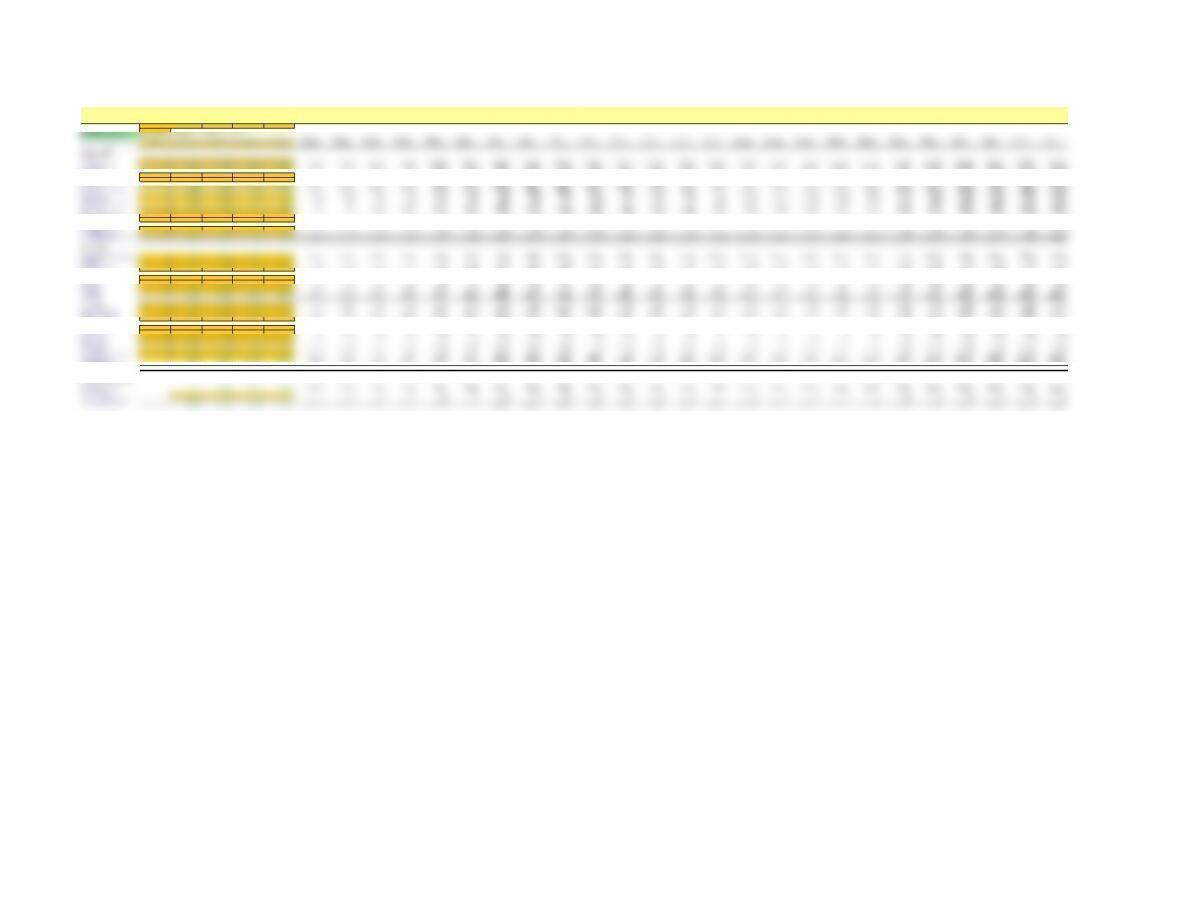
Financial Statements ($000s)
inactive
Ticker Industry Code Sector Code
Company Name #NFLX MG743 MG7
Common Shares Outstanding 52,732 (in 000s at most recent fiscal year end)
Estimated Price/Share=$12.07
Actual Actual Actual Actual Actual Forecast Forecast Forecast Forecast Forecast Forecast Forecast Forecast Forecast Forecast Forecast Forecast Forecast Forecast Forecast Forecast Forecast Forecast Forecast Forecast Forecast Forecast Forecast Forecast Forecast
Fiscal Year End (MM/DD/YYYY ) 1/0/1900 12/31/2001 12/31/2002 12/31/2003 12/31/2004 12/31/2005 12/31/2006 12/31/2007 12/31/2008 12/31/2009 12/31/2010 12/31/2011 12/31/2012 12/31/2013 12/31/2014 12/31/2015 12/31/2016 12/31/2017 12/31/2018 12/31/2019 12/31/2020 12/31/2021 12/31/2022 12/31/2023 12/31/2024 12/31/2025 12/31/2026 12/31/2027 12/31/2028 12/31/2029
Income Statement
Sales (Net) 0 75,912 152,806 272,243 506,228 690,495 995,694 1,338,212 1,667,413 1,914,190 2,009,899 2,110,394 2,215,914 2,326,710 2,443,045 2,565,197 2,693,457 2,828,130 2,969,537 3,118,013 3,273,914 3,437,610 3,609,490 3,789,965 3,979,463 4,178,436 4,387,358 4,606,726 4,837,062 5,078,915
Cost of Goods Sold 0 (20,110) (51,659) (97,369) (188,254) (291,389) (460,011) (618,254) (770,345) (884,356) (928,573) (975,002) (1,023,752) (1,074,940) (1,128,687) (1,185,121) (1,244,377) (1,306,596) (1,371,926) (1,440,522) (1,512,548) (1,588,176) (1,667,585) (1,750,964) (1,838,512) (1,930,438) (2,026,959) (2,128,307) (2,234,723) (2,346,459)
Gross Profit 0 55,802 101,147 174,874 317,974 399,106 535,683 719,958 897,068 1,029,834 1,081,326 1,135,392 1,192,162 1,251,770 1,314,358 1,380,076 1,449,080 1,521,534 1,597,611 1,677,491 1,761,366 1,849,434 1,941,906 2,039,001 2,140,951 2,247,999 2,360,399 2,478,419 2,602,339 2,732,456
R&D Expense 0 (17,734) (14,625) (17,884) (22,906) (30,382) (38,832) (52,190) (65,029) (74,653) (78,386) (82,305) (86,421) (90,742) (95,279) (100,043) (105,045) (110,297) (115,812) (121,603) (127,683) (134,067) (140,770) (147,809) (155,199) (162,959) (171,107) (179,662) (188,645) (198,078)
SG&A Expense 0 (44,827) (71,717) (101,527) (187,510) (244,435) (338,536) (454,992) (566,920) (650,825) (683,366) (717,534) (753,411) (791,081) (830,635) (872,167) (915,775) (961,564) (1,009,642) (1,060,125) (1,113,131) (1,168,787) (1,227,227) (1,288,588) (1,353,017) (1,420,668) (1,491,702) (1,566,287) (1,644,601) (1,726,831)
EBITDA 0 (6,759) 14,805 55,463 107,558 124,289 158,315 212,776 265,119 304,356 319,574 335,553 352,330 369,947 388,444 407,866 428,260 449,673 472,156 495,764 520,552 546,580 573,909 602,604 632,735 664,371 697,590 732,469 769,093 807,548
Depreciation & Amortization 0 (29,797) (26,477) (50,991) (88,204) (109,380) (101,324) (136,047) (169,796) (195,892) (207,566) (217,944) (228,841) (240,283) (252,297) (264,912) (278,158) (292,066) (306,669) (322,002) (338,102) (355,008) (372,758) (391,396) (410,966) (431,514) (453,090) (475,744) (499,531) (524,508)
EBIT 0 (36,556) (11,672) 4,472 19,354 14,909 56,991 76,728 95,322 108,464 112,008 117,609 123,489 129,664 136,147 142,954 150,102 157,607 165,487 173,762 182,450 191,572 201,151 211,209 221,769 232,858 244,500 256,725 269,562 283,040
Interest Expense 0 (1,852) (11,972) (417) (170) (44) (51) (56) (53) (40) (18) (19) (20) (21) (22) (24) (25) (26) (27) (29) (30) (32) (33) (35) (37) (38) (40) (42) (44) (47)
Non-Operating Income (Loss) 0 (210) 1,697 2,457 2,592 3,535 5,098 6,852 8,538 9,801 10,291 10,806 11,346 11,913 12,509 13,134 13,791 14,481 15,205 15,965 16,763 17,601 18,481 19,405 20,376 21,395 22,464 23,587 24,767 26,005
EBT 0 (38,618) (21,947) 6,512 21,776 18,400 62,038 83,524 103,807 118,225 122,281 128,395 134,815 141,556 148,633 156,065 163,868 172,062 180,665 189,698 199,183 209,142 219,599 230,579 242,108 254,214 266,924 280,271 294,284 308,998
Income Taxes 0 0 0 0 (181) 0 0 (7,308) (18,166) (31,034) (42,798) (44,938) (47,185) (49,544) (52,022) (54,623) (57,354) (60,222) (63,233) (66,394) (69,714) (73,200) (76,860) (80,703) (84,738) (88,975) (93,424) (98,095) (102,999) (108,149)
Minority Interest in Earnings 000000 0 0 0 0 0 0 0 0 0 0 0 0 0 0 0 0 0 0 0 0 0 0 0 0
Other Income (Loss) 000000 0 0 0 0 0 0 0 0 0 0 0 0 0 0 0 0 0 0 0 0 0 0 0 0
Net Income Before Ext. Items 0 (38,618) (21,947) 6,512 21,595 18,400 62,038 76,216 85,641 87,191 79,483 83,457 87,630 92,011 96,612 101,442 106,514 111,840 117,432 123,304 129,469 135,942 142,740 149,877 157,370 165,239 173,501 182,176 191,285 200,849
Ext. Items & Disc. Ops. 000000 0 0 0 0 0 0 0 0 0 0 0 0 0 0 0 0 0 0 0 0 0 0 0 0
Preferred Dividends 000000 0 0 0 0 0 0 0 0 0 0 0 0 0 0 0 0 0 0 0 0 0 0 0 0
Net Income (available to common) 0 (38,618) (21,947) 6,512 21,595 18,400 62,038 76,216 85,641 87,191 79,483 83,457 87,630 92,011 96,612 101,442 106,514 111,840 117,432 123,304 129,469 135,942 142,740 149,877 157,370 165,239 173,501 182,176 191,285 200,849
Balance Sheet
Operating Cash and Market. Sec. 0 16,131 103,610 135,191 174,461 237,965 343,145 461,187 574,639 659,686 692,670 727,304 763,669 801,852 841,945 884,042 928,244 974,656 1,023,389 1,074,559 1,128,287 1,184,701 1,243,936 1,306,133 1,371,440 1,440,012 1,512,012 1,587,613 1,666,993 1,750,343
Receivables 000000 0 0 0 0 0 0 0 0 0 0 0 0 0 0 0 0 0 0 0 0 0 0 0 0
Inventories 000000 0 0 0 0 0 0 0 0 0 0 0 0 0 0 0 0 0 0 0 0 0 0 0 0
Other Current Assets 0 3,421 3,465 3,755 12,885 17,575 25,343 34,061 42,441 48,722 51,158 53,716 56,402 59,222 62,183 65,292 68,556 71,984 75,583 79,363 83,331 87,497 91,872 96,466 101,289 106,354 111,671 117,255 123,118 129,273
Total Current Assets 0 19,552 107,075 138,946 187,346 255,540 368,489 495,249 617,080 708,408 743,828 781,019 820,070 861,074 904,128 949,334 996,801 1,046,641 1,098,973 1,153,921 1,211,618 1,272,198 1,335,808 1,402,599 1,472,729 1,546,365 1,623,683 1,704,868 1,790,111 1,879,616
PP&E (Net) 0 11,838 15,592 9,772 18,728 25,545 36,836 49,507 61,686 70,816 74,357 78,074 81,978 86,077 90,381 94,900 99,645 104,627 109,859 115,351 121,119 127,175 133,534 140,210 147,221 154,582 162,311 170,427 178,948 187,895
Investments 000000 0 0 0 0 0 0 0 0 0 0 0 0 0 0 0 0 0 0 0 0 0 0 0 0
Intangibles 0 7,917 6,094 2,948 961 1,311 1,890 2,540 3,165 3,634 3,816 4,006 4,207 4,417 4,638 4,870 5,113 5,369 5,637 5,919 6,215 6,526 6,852 7,195 7,554 7,932 8,329 8,745 9,182 9,642
Other Assets 0 2,323 1,769 24,346 44,758 61,050 88,034 118,318 147,424 169,243 177,705 186,590 195,919 205,715 216,001 226,801 238,141 250,048 262,551 275,678 289,462 303,935 319,132 335,089 351,843 369,435 387,907 407,302 427,667 449,051
Total Assets 0 41,630 130,530 176,012 251,793 343,446 495,249 665,614 829,355 952,100 999,705 1,049,690 1,102,175 1,157,283 1,215,147 1,275,905 1,339,700 1,406,685 1,477,019 1,550,870 1,628,414 1,709,834 1,795,326 1,885,093 1,979,347 2,078,314 2,182,230 2,291,342 2,405,909 2,526,204
Current Debt 0 3,012 1,231 416 68 93 134 180 224 257 270 283 298 313 328 345 362 380 399 419 440 462 485 509 535 561 589 619 650 682
Accounts Payable 0 13,715 20,350 32,654 49,775 77,044 121,628 163,469 203,682 233,827 245,518 257,794 270,684 284,218 298,429 313,350 329,018 345,468 362,742 380,879 399,923 419,919 440,915 462,961 486,109 510,414 535,935 562,732 590,868 620,412
Income Taxes Payable 000000 0 0 0 0 0 0 0 0 0 0 0 0 0 0 0 0 0 0 0 0 0 0 0 0
Other Current Liabilities 0 9,481 18,845 29,949 45,067 61,471 88,642 119,135 148,442 170,411 178,931 187,878 197,272 207,136 217,492 228,367 239,785 251,775 264,363 277,581 291,461 306,034 321,335 337,402 354,272 371,986 390,585 410,114 430,620 452,151
Total Current Liabilities 0 26,208 40,426 63,019 94,910 138,608 210,404 282,783 352,347 404,495 424,719 445,955 468,253 491,666 516,249 542,062 569,165 597,623 627,504 658,879 691,823 726,414 762,735 800,872 840,915 882,961 927,109 973,465 1,022,138 1,073,245
Long-Term Debt 0 3,856 460 44 00 0 0 0 0 0 0 0 0 0 0 0 0 0 0 0 0 0 0 0 0 0 0 0 0
Other Liabilities 0240 288 241 600 818 1,180 1,586 1,976 2,269 2,382 2,501 2,626 2,758 2,896 3,040 3,192 3,352 3,520 3,696 3,880 4,074 4,278 4,492 4,717 4,952 5,200 5,460 5,733 6,020
Deferred Taxes 000000 0 0 0 0 0 0 0 0 0 0 0 0 0 0 0 0 0 0 0 0 0 0 0 0
Minority Interest 0 101,830 0 0 0 0 0 0 0 0 0 0 0 0 0 0 0 0 0 0 0 0 0 0 0 0 0 0 0 0
Total Liabilities 0 132,134 41,174 63,304 95,510 139,427 211,584 284,369 354,324 406,763 427,102 448,457 470,880 494,424 519,145 545,102 572,357 600,975 631,024 662,575 695,704 730,489 767,013 805,364 845,632 887,914 932,309 978,925 1,027,871 1,079,265
Preferred Stock 060000 0 0 0 0 0 0 0 0 0 0 0 0 0 0 0 0 0 0 0 0 0 0 0 0
Paid in Common Capital (Net) 0 46,756 248,569 266,001 287,981 317,317 334,924 356,289 364,434 347,548 295,332 240,505 182,937 122,491 59,022 (7,620) (77,594) (151,067) (228,214) (309,218) (394,272) (483,579) (577,352) (675,812) (779,196) (887,750) (1,001,730) (1,121,410) (1,247,074) (1,379,021)
Retained Earnings 0 (137,266) (159,213) (153,293) (131,698) (113,298) (51,259) 24,957 110,597 197,788 277,271 360,728 448,358 540,369 636,981 738,423 844,937 956,778 1,074,210 1,197,514 1,326,983 1,462,925 1,605,665 1,755,541 1,912,911 2,078,150 2,251,651 2,433,827 2,625,112 2,825,961
Total Common Equity 0 (90,510) 89,356 112,708 156,283 204,019 283,665 381,245 475,032 545,336 572,603 601,233 631,295 662,860 696,003 730,803 767,343 805,710 845,996 888,295 932,710 979,346 1,028,313 1,079,729 1,133,715 1,190,401 1,249,921 1,312,417 1,378,038 1,446,940
Total Liabilities and Equity 0 41,630 130,530 176,012 251,793 343,446 495,249 665,614 829,355 952,100 999,705 1,049,690 1,102,175 1,157,283 1,215,147 1,275,905 1,339,700 1,406,685 1,477,019 1,550,870 1,628,414 1,709,834 1,795,326 1,885,093 1,979,347 2,078,314 2,182,230 2,291,342 2,405,909 2,526,204
Statement of Retained Earnings
Beg. Retained Earnings 0 (137,266) (159,213) (153,293) (131,698) (113,298) (51,259) 24,957 110,597 197,788 277,271 360,728 448,358 540,369 636,981 738,423 844,937 956,778 1,074,210 1,197,514 1,326,983 1,462,925 1,605,665 1,755,541 1,912,911 2,078,150 2,251,651 2,433,827 2,625,112
+Net Income (38,618) (21,947) 6,512 21,595 18,400 62,038 76,216 85,641 87,191 79,483 83,457 87,630 92,011 96,612 101,442 106,514 111,840 117,432 123,304 129,469 135,942 142,740 149,877 157,370 165,239 173,501 182,176 191,285 200,849
-Common Dividends 0 0 0 0 0 0 0 0 0 0 0 0 0 0 0 0 0 0 0 0 0 0 0 0 0 0 0 0 0
+/-Clean Surplus Plug (Ignore) (98,648) 0 (592) 0 0 0 0 0 0 0 0 0 0 0 0 0 0 0 0 0 0 0 0 0 0 0 0 0 0
=End. Retained Earnings 0 (137,266) (159,213) (153,293) (131,698) (113,298) (51,259) 24,957 110,597 197,788 277,271 360,728 448,358 540,369 636,981 738,423 844,937 956,778 1,074,210 1,197,514 1,326,983 1,462,925 1,605,665 1,755,541 1,912,911 2,078,150 2,251,651 2,433,827 2,625,112 2,825,961
NETFLIX INC
Industry/Sector Code LookUp
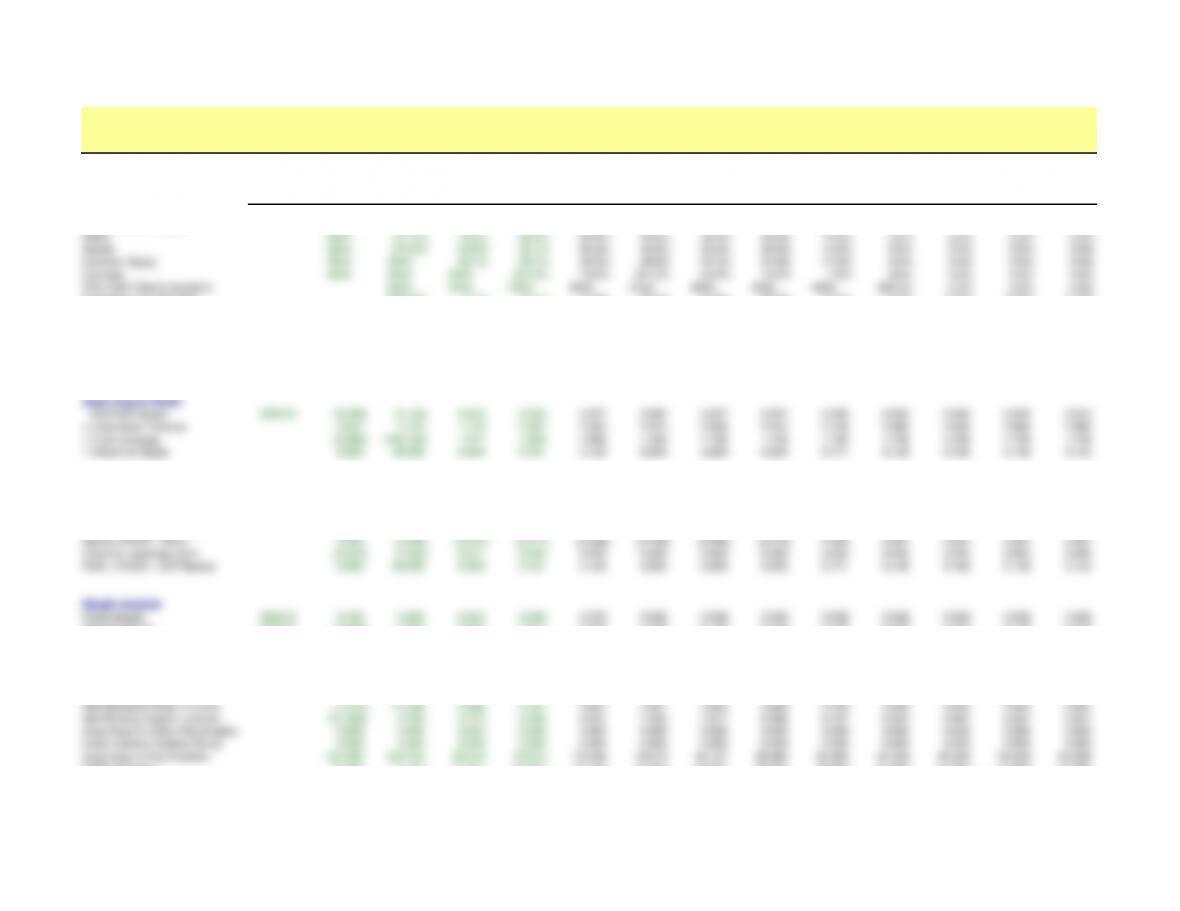
Ratio Analysis
Company Name
NETFLIX INC
Actual Actual Actual Actual Actual Forecast Forecast Forecast Forecast Forecast Forecast Forecast Forecast Forecast
Fiscal Year End Date 1/0/1900 12/31/2001 12/31/2002 12/31/2003 12/31/2004 12/31/2005 12/31/2006 12/31/2007 12/31/2008 12/31/2009 12/31/2010 12/31/2011 12/31/2012 12/31/2013
Annual Growth Rates
Sales #N/A 101.3% 78.2% 85.9% 36.4% 44.2% 34.4% 24.6% 14.8% 5.0% 5.0% 5.0% 5.0%
Assets #N/A 213.5% 34.8% 43.1% 36.4% 44.2% 34.4% 24.6% 14.8% 5.0% 5.0% 5.0% 5.0%
Common Equity #N/A #N/A 26.1% 38.7% 30.5% 39.0% 34.4% 24.6% 14.8% 5.0% 5.0% 5.0% 5.0%
Earnings #N/A #N/A #N/A 231.6% -14.8% 237.2% 22.9% 12.4% 1.8% -8.8% 5.0% 5.0% 5.0%
Free Cash Flow to Investors #N/A #N/A #N/A #N/A #N/A #N/A #N/A #N/A 209.3% 5.0% 5.0% 5.0%
Sustainable Growth Rate 3803.6% 6.4% 16.1% 10.2% 25.4% 22.9% 20.0% 17.1% 14.2% 14.2% 14.2% 14.2%
Profitability
Return on Equity 0.853 38.036 0.064 0.161 0.102 0.254 0.229 0.200 0.171 0.142 0.142 0.142 0.142
Return on Equity (b4 non-recurring) 0.849 40.977 0.040 0.141 0.083 0.234 0.210 0.184 0.157 0.130 0.130 0.130 0.130
Return on Net Operating Assets 0.879 (2.692) 0.068 0.161 0.102 0.255 0.229 0.200 0.171 0.142 0.142 0.142 0.142
Basic Dupont Model
Net Profit Margin #DIV/0! (0.509) (0.144) 0.024 0.043 0.027 0.062 0.057 0.051 0.046 0.040 0.040 0.040 0.040
x Total Asset Turnover 3.647 1.775 1.776 2.367 2.320 2.374 2.306 2.231 2.149 2.060 2.060 2.060 2.060
x Total Leverage (0.460) (149.185) 1.517 1.590 1.652 1.720 1.746 1.746 1.746 1.746 1.746 1.746 1.746
= Return on Equity 0.853 38.036 0.064 0.161 0.102 0.254 0.229 0.200 0.171 0.142 0.142 0.142 0.142
Advanced Dupont Model
Net Operating Margin #DIV/0! (0.484) (0.065) 0.025 0.043 0.027 0.062 0.057 0.051 0.046 0.040 0.040 0.040 0.040
x Net Operating Asset Turnover (1.815) 41.238 2.666 3.757 3.831 4.081 4.023 3.893 3.750 3.594 3.594 3.594 3.594
= Return on Net Operating Assets 0.879 (2.692) 0.068 0.161 0.102 0.255 0.229 0.200 0.171 0.142 0.142 0.142 0.142
Net Borrowing Cost (NBC) 0.539 2.796 0.388 0.639 0.548 0.453 0.326 0.216 0.122 0.046 0.046 0.046 0.046
Spread (RNOA – NBC) 0.340 (5.488) (0.320) (0.477) (0.446) (0.198) (0.096) (0.016) 0.049 0.097 0.097 0.097 0.097
Financial Leverage (LEV) (0.076) (7.422) 0.011 0.002 0.000 0.000 0.000 0.000 0.000 0.000 0.000 0.000 0.000
ROE = RNOA + LEV*Spread 0.853 38.036 0.064 0.161 0.102 0.254 0.229 0.200 0.171 0.142 0.142 0.142 0.142
Margin Analysis
Gross Margin #DIV/0! 0.735 0.662 0.642 0.628 0.578 0.538 0.538 0.538 0.538 0.538 0.538 0.538 0.538
EBITDA Margin #DIV/0! (0.089) 0.097 0.204 0.212 0.180 0.159 0.159 0.159 0.159 0.159 0.159 0.159 0.159
EBIT Margin #DIV/0! (0.482) (0.076) 0.016 0.038 0.022 0.057 0.057 0.057 0.057 0.056 0.056 0.056 0.056
Net Operating Margin (b4 non-rec.) #DIV/0! (0.482) (0.076) 0.016 0.038 0.022 0.057 0.052 0.047 0.042 0.036 0.036 0.036 0.036
Net Operating Margin #DIV/0! (0.484) (0.065) 0.025 0.043 0.027 0.062 0.057 0.051 0.046 0.040 0.040 0.040 0.040
Turnover Analysis
Net Operating Asset Turnover (1.815) 41.238 2.666 3.757 3.831 4.081 4.023 3.893 3.750 3.594 3.594 3.594 3.594
Net Working Capital Turnover (41.664) 4.758 3.775 5.996 6.591 7.235 7.217 6.982 6.727 6.447 6.447 6.447 6.447
Avge Days to Collect Receivables 0.000 0.000 0.000 0.000 0.000 0.000 0.000 0.000 0.000 0.000 0.000 0.000 0.000
Avge Inventory Holding Period 0.000 0.000 0.000 0.000 0.000 0.000 0.000 0.000 0.000 0.000 0.000 0.000 0.000
Avge Days to Pay Payables 124.465 120.344 99.346 79.910 79.428 78.819 84.157 86.980 90.286 94.209 94.209 94.209 94.209
PP&E Turnover 12.825 11.142 21.467 35.525 31.193 31.923 30.997 29.991 28.893 27.690 27.690 27.690 27.690
Analysis of Leverage

-Long-Term Capital Structure
Debt to Equity Ratio #DIV/0! (0.076) 0.019 0.004 0.000 0.000 0.000 0.000 0.000 0.000 0.000 0.000 0.000 0.000
FFO to Total Debt 27.155 (22.725) 53.423 417.265 1592.502 1445.684 1356.715 1267.300 1178.020 1089.569 1089.569 1089.569 1089.569
CFO to Total Debt 32.913 (18.997) 74.918 504.799 2077.515 2010.683 1762.543 1570.177 1368.552 1157.016 1157.016 1157.016 1157.016
Analysis of Leverage
– Short-Term Liquidity
Current Ratio #DIV/0! 0.746 2.649 2.205 1.974 1.844 1.751 1.751 1.751 1.751 1.751 1.751 1.751 1.751
Quick Ratio #DIV/0! 0.615 2.563 2.145 1.838 1.717 1.631 1.631 1.631 1.631 1.631 1.631 1.631 1.631
EBIT Interest Coverage #DIV/0! (19.739) (0.975) 10.724 113.847 338.308 1111.809 1371.225 1807.030 2721.863 6071.292 6071.292 6071.292 6071.292
EBITDA Interest Coverage #DIV/0! (3.650) 1.237 133.005 632.694 2820.343 3088.476 3802.548 5025.872 7637.713 17322.149 17322.149 17322.149 17322.149
Analysis of Credit Risk
Net Income to Total Assets #DIV/0! -0.928 -0.168 0.037 0.086 0.054 0.125 0.115 0.103 0.092 0.080 0.080 0.080 0.080
implied default probability #DIV/0! 8.3% 8.0% 3.0% 2.0% 2.5% 2.0% 2.0% 2.0% 2.0% 2.0% 2.0% 2.0% 2.0%
Total Liabilities to Total Assets #DIV/0! 3.174 0.315 0.360 0.379 0.406 0.427 0.427 0.427 0.427 0.427 0.427 0.427 0.427
implied default probability #DIV/0! 10.0% 2.5% 2.5% 2.5% 3.0% 3.0% 3.0% 3.0% 3.0% 3.0% 3.0% 3.0% 3.0%
Quick Ratio #DIV/0! 0.615 2.563 2.145 1.838 1.717 1.631 1.631 1.631 1.631 1.631 1.631 1.631 1.631
implied default probability #DIV/0! 5.0% 1.5% 2.0% 2.5% 2.5% 2.5% 2.5% 2.5% 2.5% 2.5% 2.5% 2.5% 2.5%
EBIT to Interest Expense #DIV/0! (19.74) (0.97) 10.72 113.85 338.31 1111.81 1371.23 1807.03 2721.86 6071.29 6071.29 6071.29 6071.29
implied default probability 1.0% 7.5% 8.5% 1.5% 1.0% 1.0% 1.0% 1.0% 1.0% 1.0% 1.0% 1.0% 1.0% 1.0%
Inventory Holding Period #DIV/0! 0.00 0.00 0.00 0.00 0.00 0.00 0.00 0.00 0.00 0.00 0.00 0.00 0.00
implied default probability #DIV/0! 3.0% 3.0% 3.0% 3.0% 3.0% 3.0% 3.0% 3.0% 3.0% 3.0% 3.0% 3.0% 3.0%
Annual Sales Growth #N/A 101.3% 78.2% 85.9% 36.4% 44.2% 34.4% 24.6% 14.8% 5.0% 5.0% 5.0% 5.0%
implied default probability #N/A 6.5% 5.0% 6.5% 4.2% 5.0% 4.2% 4.2% 3.0% 3.0% 3.0% 3.0% 3.0%
Average Implied Default Probability #N/A 5.0% 2.8% 2.9% 2.7% 2.8% 2.6% 2.6% 2.4% 2.4% 2.4% 2.4% 2.4%
Fiscal Year 1899 2001 2002 2003 2004 2005 2006 2007 2008 2009 2010 2011 2012 2013