
12/31/2012 12/31/2013 12/31/2014 12/31/2015 12/31/2016 12/31/2017 12/31/2018 12/31/2019 12/31/2020 12/31/2021 12/31/2022 12/31/2023 12/31/2024 12/31/2025
2,804,896 3,001,238 3,211,325 3,436,118 3,676,646 3,934,011 4,209,392 4,504,049 4,819,333 5,156,686 5,517,654 5,903,890 6,317,162 6,759,363
243,238 212,287 185,275 161,700 141,125 123,168 107,496 93,818 81,880 71,461 62,368 54,432 47,506 41,461
38,499 41,194 44,078 47,163 50,465 53,997 57,777 61,821 66,149 70,779 75,734 81,035 86,707 92,777
15,289 15,147 15,007 14,868 14,730 14,594 14,459 14,325 14,192 14,061 13,930 13,802 13,674 13,547
0 0 0 0 0 0 0 0 0 0 0 0 0 0
0 0 0 0 0 0 0 0 0 0 0 0 0 0
2,746,631 2,938,895 3,144,618 3,364,741 3,600,273 3,852,292 4,121,953 4,410,490 4,719,224 5,049,569 5,403,039 5,781,252 6,185,940 6,618,956
307,667 274,308 244,566 218,048 194,406 173,327 154,534 137,779 122,840 109,521 97,646 87,058 77,619 69,203
EPS Forecaster ($000, except per share amounts)
Company Name AMAZON COM INC
Common Shares Outstandin g at BS Date 370,000
Equivalent Shares at Valu ation Date 370,000
Forecasted Price at Valuation Date $14.98
Forecast Forecast Forecast Forecast Forecast Forecast Forecast Forecast Forecast Forecast Forecast Forecast Forecast Forecast Forecast Forecast Forecast Forecast Forecast Forecast Forecast Forecast Forecast Forecast Forecast
Fiscal Year of Forecast 12/31/2001 12/31/2002 12/31/2003 12/31/2004 12/31/2005 12/31/2006 12/31/2007 12/31/2008 12/31/2009 12/31/2010 12/31/2011 12/31/2012 12/31/2013 12/31/2014 12/31/2015 12/31/2016 12/31/2017 12/31/2018 12/31/2019 12/31/2020 12/31/2021 12/31/2022 12/31/2023 12/31/2024 12/31/2025
Net Income (688,034) (54,239) 96,135 269,470 523,691 549,912 767,755 1,086,929 1,515,321 2,086,100 2,213,404 2,368,342 2,534,126 2,711,515 2,901,321 3,104,413 3,321,722 3,554,242 3,803,039 4,069,252 4,354,100 4,658,887 4,985,009 5,333,960 5,707,337
Common Equity Issued (Repurchased) 511,287 (288,622) (369,037) (597,156) (916,532) (1,020,040) (1,329,298) (1,756,132) (2,270,160) (2,978,588) (2,621,398) (2,804,896) (3,001,238) (3,211,325) (3,436,118) (3,676,646) (3,934,011) (4,209,392) (4,504,049) (4,819,333) (5,156,686) (5,517,654) (5,903,890) (6,317,162) (6,759,363)
Forecasted Price at Year End $16.68 $20.45 $25.07 $30.73 $37.68 $46.19 $56.63 $69.43 $85.12 $104.36 $127.95 $156.86 $192.31 $235.78 $289.06 $354.39 $434.49 $532.68 $653.06 $800.66 $981.61 $1,203.45 $1,475.43 $1,808.87 $2,217.68
New Shares Issued (Repurchased) 30,658 (14,116) (14,722) (19,431) (24,325) (22,082) (23,472) (25,293) (26,669) (28,541) (20,488) (17,881) (15,606) (13,620) (11,887) (10,375) (9,054) (7,902) (6,897) (6,019) (5,253) (4,585) (4,001) (3,492) (3,048)
Shares Outstanding at End of Year 400,658 386,542 371,820 352,389 328,064 305,982 282,510 257,217 230,548 202,007 181,519 163,638 148,032 134,412 122,525 112,150 103,096 95,194 88,297 82,278 77,024 72,439 68,438 64,946 61,898
Forecast EPS -$1.79 -$0.14 $0.25 $0.74 $1.54 $1.73 $2.61 $4.03 $6.21 $9.65 $11.54 $13.72 $16.26 $19.20 $22.58 $26.46 $30.86 $35.85 $41.45 $47.71 $54.66 $62.34 $70.77 $79.98 $89.99
Consensus Analyst Forecast of EPS
Forecast Five Year Growth Rate in EPS -199%
Consensus Analyst Forecast of Growth
To obtain analyst forecasts, click here
Although not a necessary input for eVal, we recommend that
you find the analyst forecasts for your company and store them in the
yellow-shaded cells for comparison purposes.
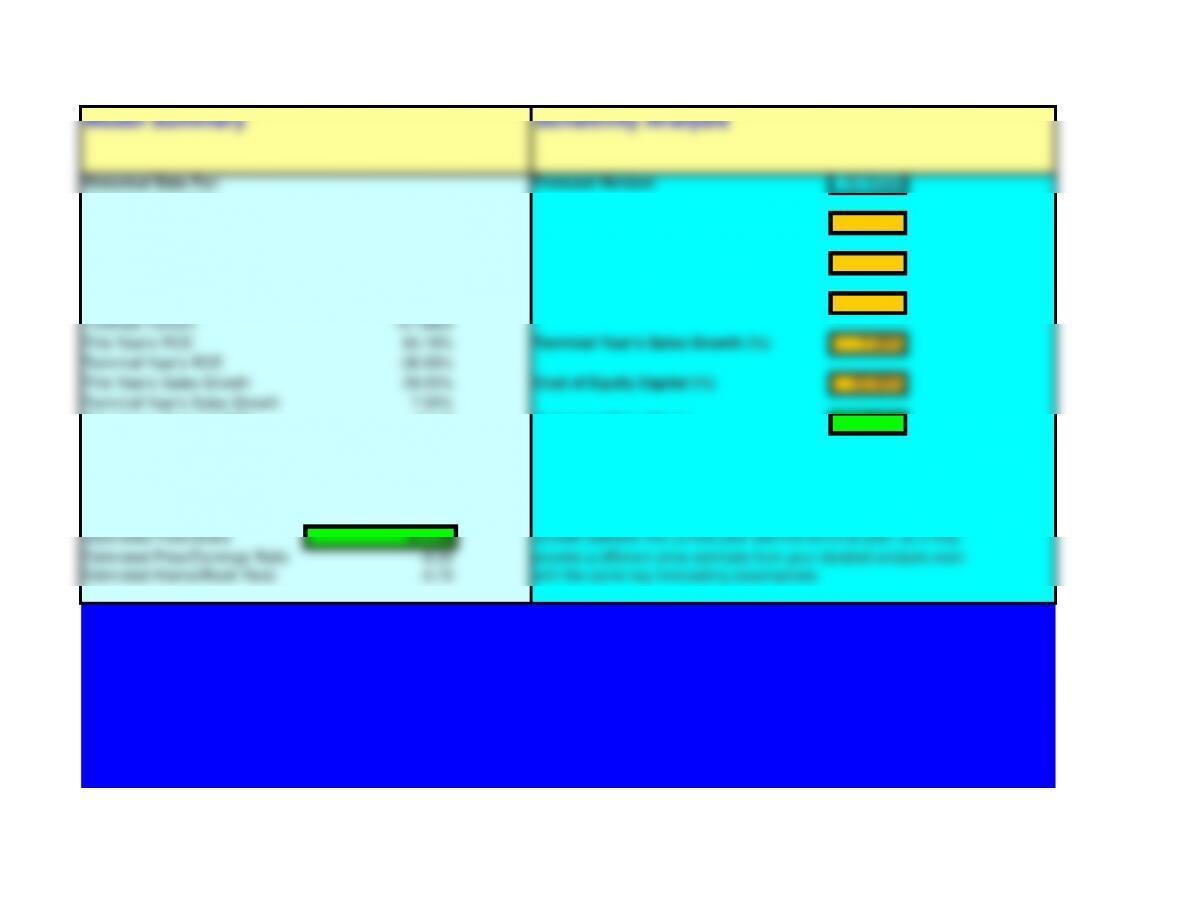
Model Summary Sensitivity Analysis
Historical Data For: Forecast Horizon 10 Years
AMAZON COM INC
Most Recent Fiscal Year End: 12/31/2000
This Year’s ROE (%) 65.18%
Average ROE (last five years) -73.92%
Sales Growth (last five years) 181.07%
Terminal Year’s ROE (%) -36.69%
Forecast Data: This Year’s Sales Growth (%) 24.00%
Forecast Horizon 10 Years
This Year’s ROE 65.18%
Terminal Year’s Sales Growth (%) 7.00%
Terminal Year’s ROE -36.69%
This Year’s Sales Growth 24.00%
Cost of Equity Capital (%) 22.60%
Terminal Year’s Sales Growth 7.00%
This Year’s Forecast EPS -$1.79
Estimated Price/Share $3.44
Valuation Date 6/30/2001 analysis uses a linear smoothing algorithm to compute ROE and Sales
Estimated Price/Share
$14.98 Growth between the current year and the terminal year, so it may
Estimated Price/Earnings Ratio -8.39 provide a different price estimate from your detailed analysis even
Estimated Market/Book Ratio -5.73 with the same key forecasting assumptions.


Quick ‘n’ Dirty Computations
5 Years 1 2 3 4 5 6 7 8 9
ROE 65.18% 44.80% 24.43% 4.06% -16.32% -36.69% -36.69% -36.69% -36.69%
Growth 24.00% 20.60% 17.20% 13.80% 10.40% 7.00% 7.00% 7.00% 7.00%
Lagged BV -967251 -1199391 -1446466 -1695258 -1929204 -2129841 -2278930 -2438455 -2609146
Earnings -706086 -592725 -383764 -73510 331168 808820 865437 926018 990839
Residual Income -487487 -321663 -56863 309619 767168 1290164 1380476 1477109 1580506
PV Residual Income -397624 -214003 -30857 137046 276974 379929 331585 289393 252570
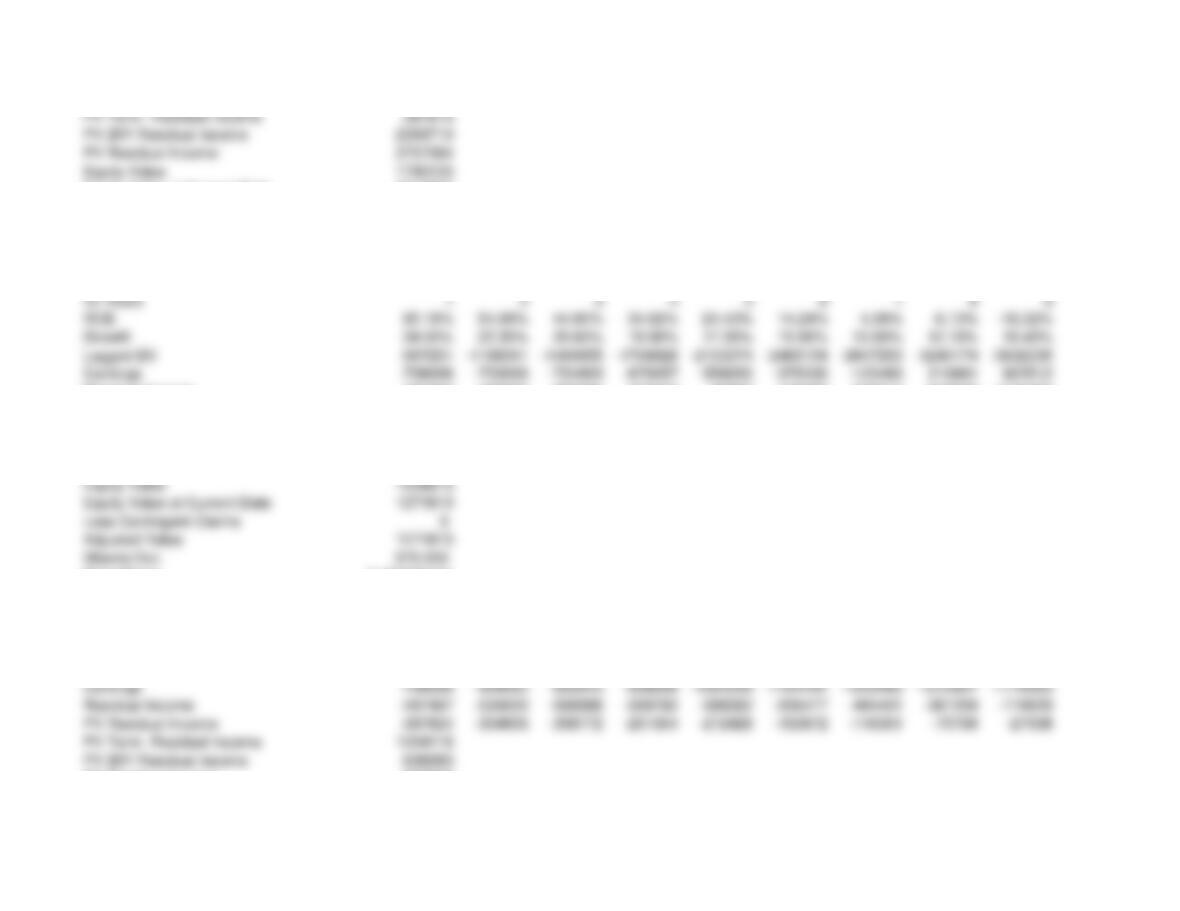
PV Term. Residual Income 387675
PV 20Y Residual Income 2369710
PV Residual Income 2757384
Equity Value 1790133
Equity Value at Current Date 2217562
Less Contingent Claims 0
Adjusted Value 2217562
10 Years 1 2 3 4 5 6 7 8 9
ROE 65.18% 54.99% 44.80% 34.62% 24.43% 14.24% 4.06% -6.13% -16.32%
Growth 24.00% 22.30% 20.60% 18.90% 17.20% 15.50% 13.80% 12.10% 10.40%
Lagged BV -967251 -1199391 -1466855 -1769028 -2103374 -2465154 -2847253 -3240174 -3632235
Earnings -706086 -733098 -724903 -670257 -558050 -378330 -123463 210661 623512
Residual Income -487487 -462035 -393394 -270457 -82687 178795 520017 942940 1444397
PV Residual Income -397624 -307393 -213480 -119711 -29853 52652 124906 184740 230819
Equity Value at Current Date 1271810
Less Contingent Claims 0
Adjusted Value 1271810
Shares Out. 370,000
Price/Share 3.437325131
Earnings -706086 -804062 -902810 -998036 -1084206 -1154441 -1200463 -1212607 -1179903
Residual Income -487487 -533000 -568996 -589782 -588382 -556477 -484401 -361209 -174829
PV Residual Income -397624 -354606 -308772 -261054 -212426 -163872 -116351 -70768 -27938
PV Term. Residual Income 1204118
PV 20Y Residual Income -608390
PV Residual Income 595728
Equity Value -371523
Equity Value at Current Date -460232
Less Contingent Claims 0
Adjusted Value -460232
Shares Out. 370,000
Price/Share -1.243869174
