Estimated Price/Share=$14.98
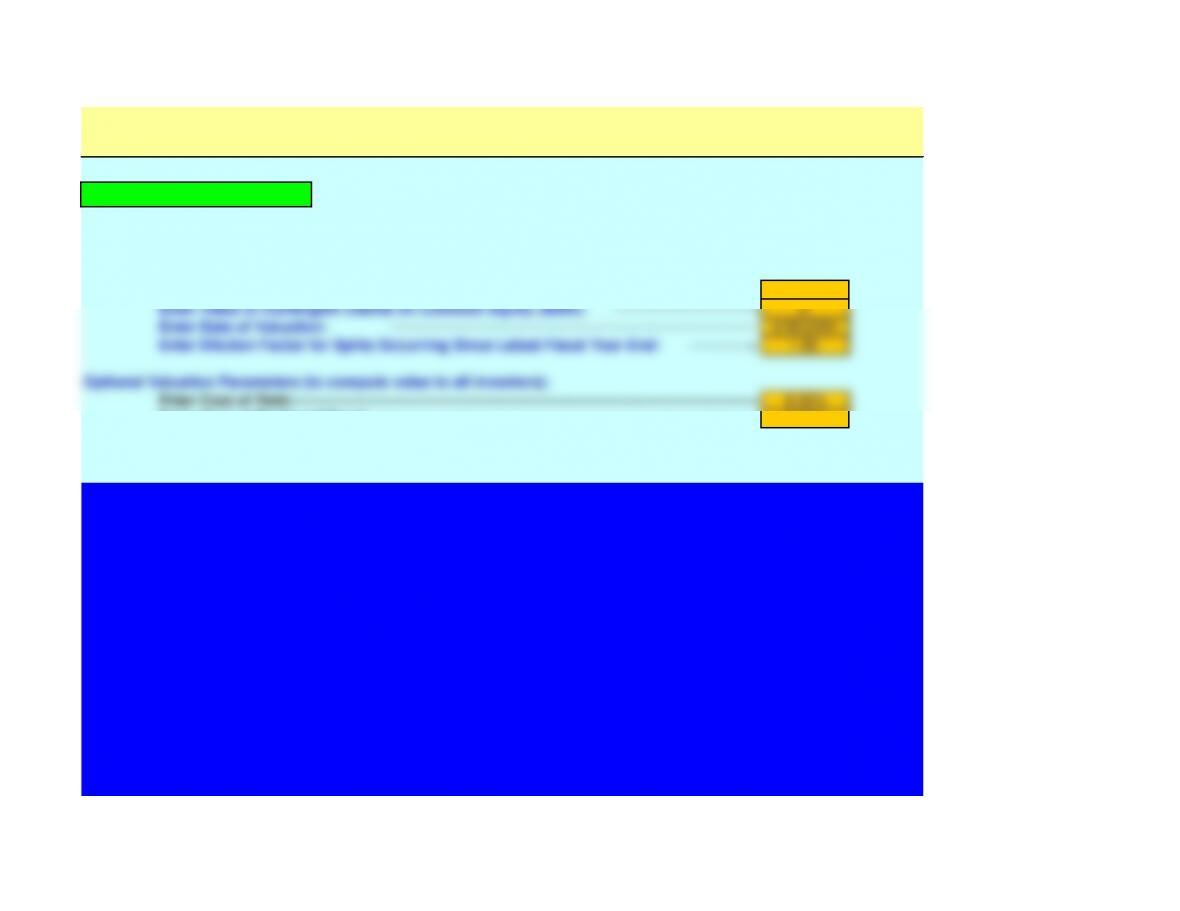
Company Name: AMAZON COM INC
Required Valuation Parameters (to compute value of common equity):
————————————————————–—————————————————————————->
22.60%
—————————->
0
—————————————————————————->
6/30/2001
————> 1.00
Enter Cost of Debt:———————————————————————————————-
8.00%
Enter Cost of Preferred Stock:—————————–————————–———————->
9.00%
Optional Valuation Parameters (to compute value to all investors):
Valuation Parameters
Enter Cost of Equity Capital:
Enter Value of Contingent Claims on Common Equity ($000):
Enter Dilution Factor for Splits Occurring Since Latest Fiscal Year End:
Enter Date of Valuation:

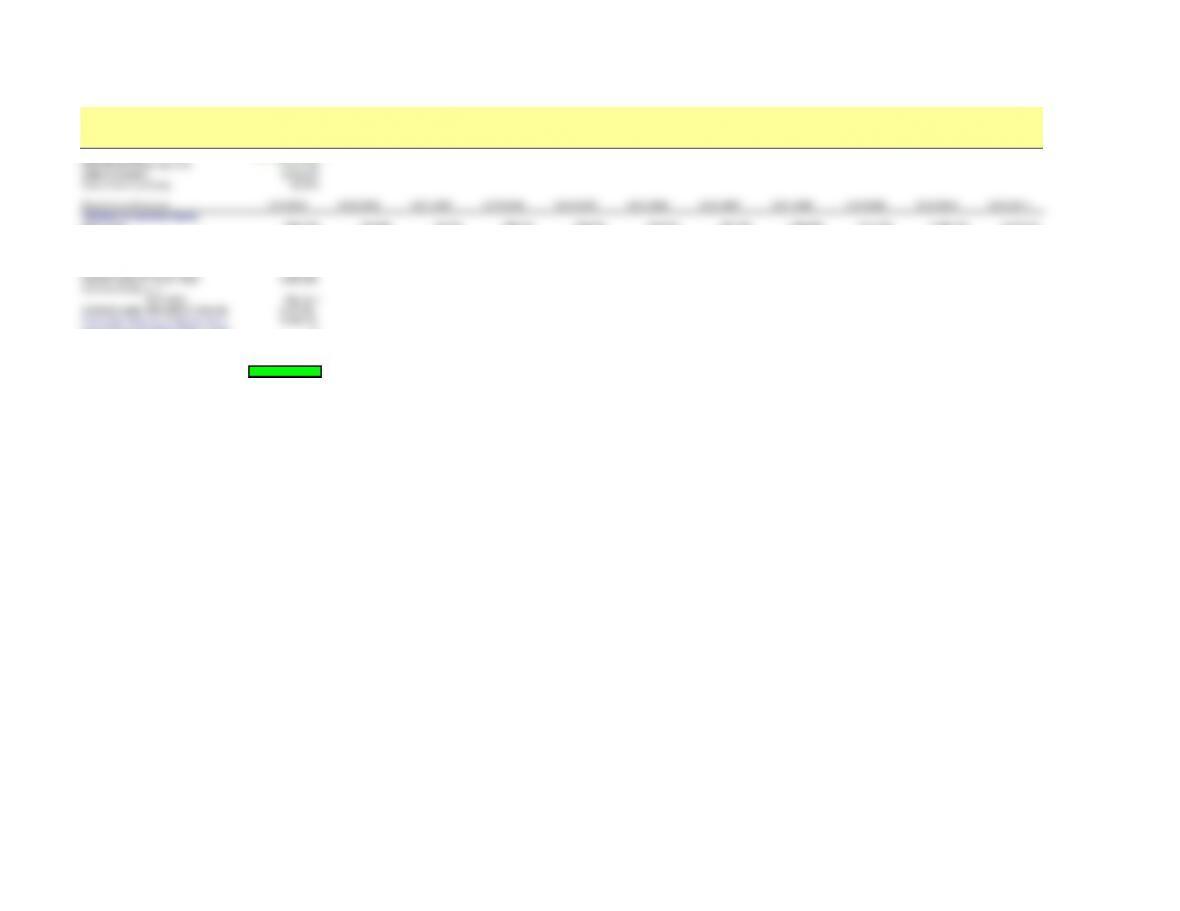
Contingent Claims Calculator
(Use this calculator to estimate the value of contingent claims on common equity,
such as employee stock options and convertible bonds)
Current Stock Price $40.00
Exercise Price $40.00
Years to Expiration 5
Annual Risk-Free Rate of Interest 7.50%
Standard Deviation of Annual Stock Return 30.00%
Annual Dividend Yield 4.00%

Value of Contingent Claim Per Share #NAME?
Number of Shares Subject to Claim (000s)
1,000
Total Value of Contingent Claim ($000s) #NAME?
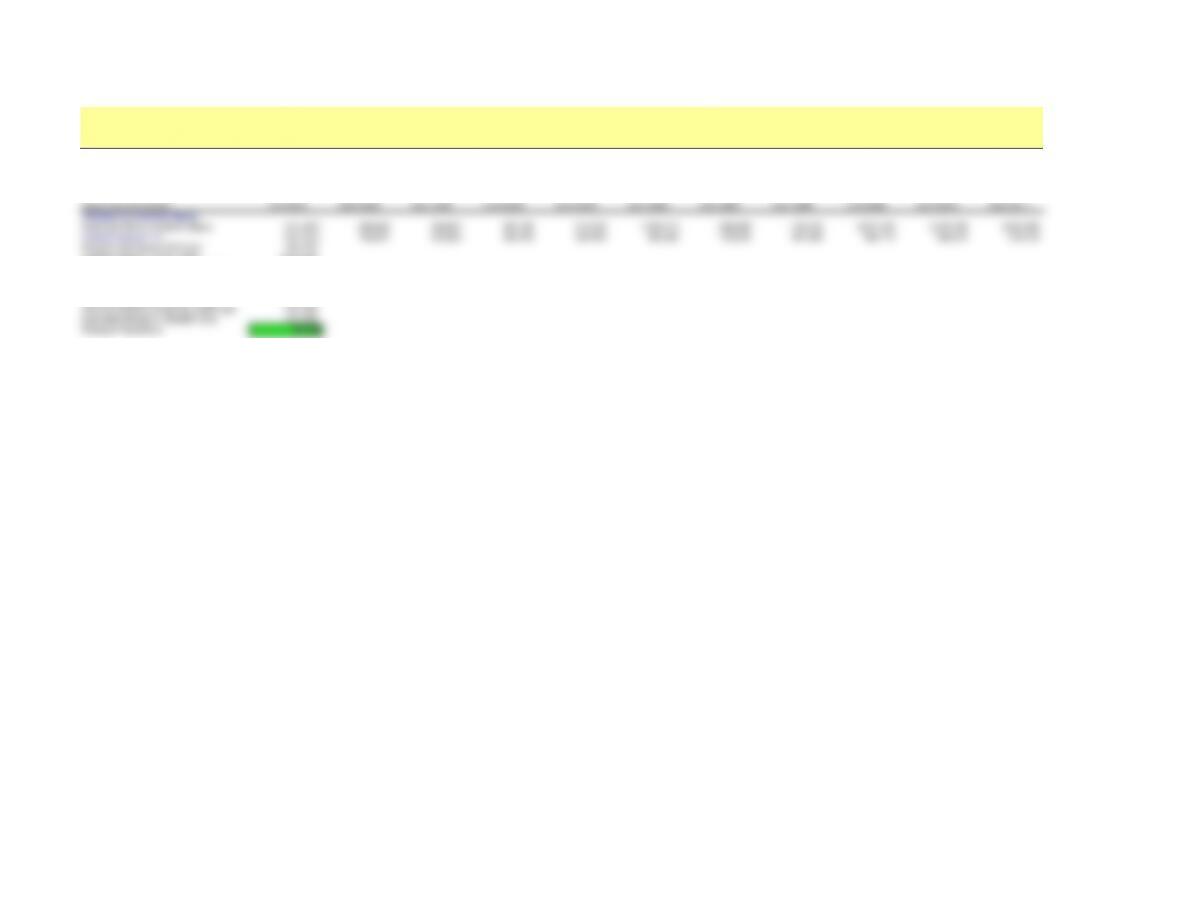
Residual Income Valuation ($000)
Company Name AMAZON COM INC
Most Recent Fiscal Year End 12/31/2000
Date of Valuation 6/30/2001
Cost of Common Equity 22.60%
Fiscal Year of Forecast 12/31/2001 12/31/2002 12/31/2003 12/31/2004 12/31/2005 12/31/2006 12/31/2007 12/31/2008 12/31/2009 12/31/2010 12/31/2011
Valuation to Common Equity
Net Income (688,034) (54,239) 96,135 269,470 523,691 549,912 767,755 1,086,929 1,515,321 2,086,100 2,213,404
Common Equity at Beginning of Year (967,251) (1,143,998) (1,486,858) (1,759,761) (2,087,447) (2,480,288) (2,950,415) (3,511,958) (4,181,161) (4,935,999) (5,828,487)
Residual Income (469,435) 204,305 432,165 667,176 995,454 1,110,457 1,434,549 1,880,631 2,460,264 3,201,636 3,530,642
Present Value of Residual Income (382,900) 135,924 234,519 295,310 359,392 327,008 344,574 368,451 393,158 417,318 375,369
Present Value Beyond 20 Years 756,410
Present Value of First 20 Years 4,686,362
Common Equity as of
12/31/2000 (967,251)
Forecast Equity Value Before Time Adj. 4,475,521
Forecasted Value as of Valuation Date 5,544,137
Less Value of Contingent Equity Claims 0
Value Attributable to Common Equity 5,544,137
Common Shares Outstanding at BS Date 370,000
Equivalent Shares at Valuation Date 370,000
Forecast Price/Share $14.98
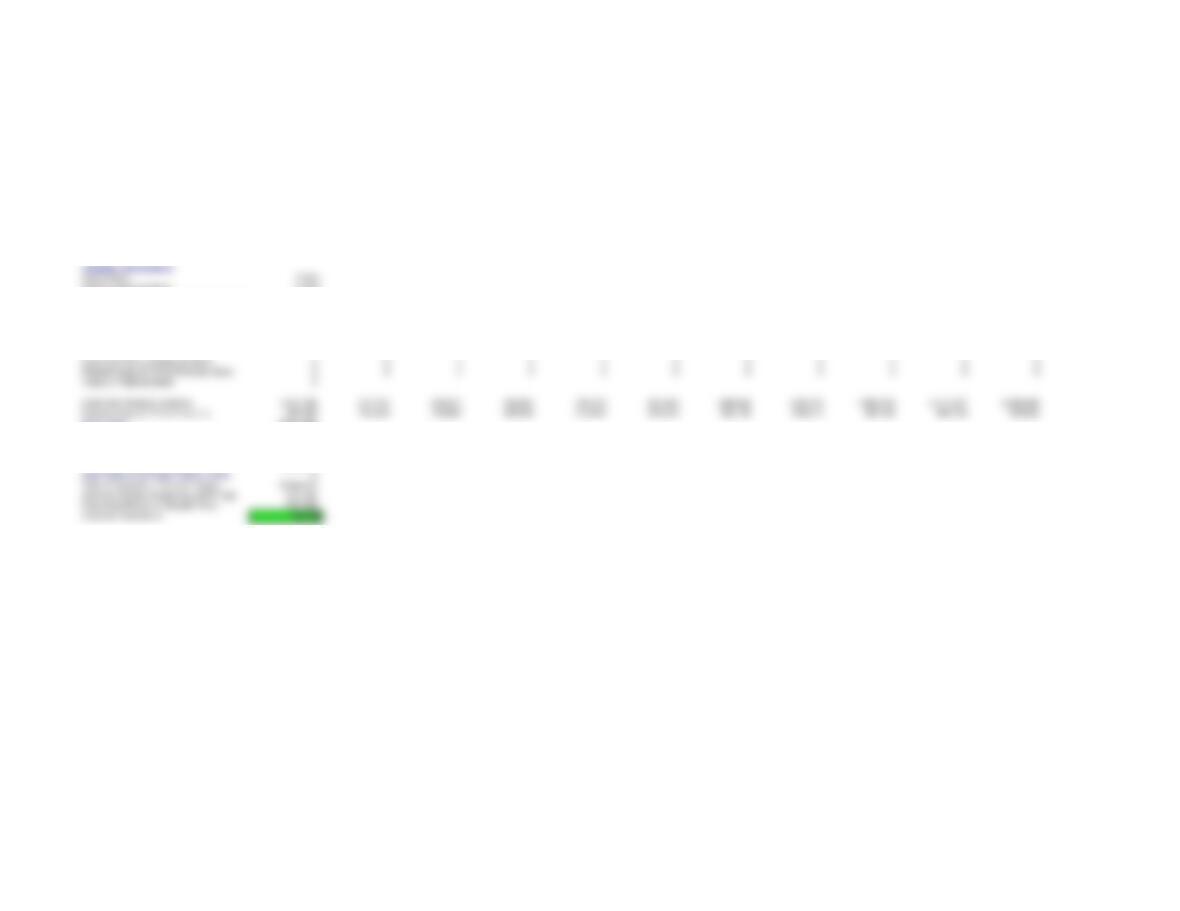
Valuation to all Investors
Cost of Debt 8.00%
Cost of Preferred Stock 9.00%
After Tax Weighted Average Cost of Capital 20.01%
Interest Expense to Debtholders 108,908 56,589 67,666 80,899 96,465 115,367 138,978 168,073 203,861 248,391 282,603
Beginning Book Value of Debt 2,144,041 666,475 793,895 952,328 1,135,382 1,354,034 1,623,178 1,963,359 2,374,008 2,886,918 3,523,185
Residual Interest Expense (62,616) 3,271 4,155 4,713 5,634 7,044 9,124 11,004 13,940 17,438 749
Present Value of Residual Interest Income (57,978) 2,805 3,298 3,464 3,835 4,439 5,324 5,945 6,974 8,077 321
Value of Debt 2,164,902
Dividends to Preferred Stockholders 0 0 0 0 0 0 0 0 0 0 0
Beginning Book Value of Preferred Stock 0 0 0 0 0 0 0 0 0 0 0
Residual Income to Preferred Stock 0 0 0 0 0 0 0 0 0 0 0
Present Value of Preferred Residual Income 0 0 0 0 0 0 0 0 0 0 0
Value of Preferred Stock 0
Net Operating Income (579,126) 2,351 163,801 350,369 620,156 630,669 862,261 1,201,219 1,653,947 2,255,006 2,405,574
Beginning Net Operating Assets 1,176,790 (477,522) (692,963) (807,433) (952,065) (1,126,253) (1,327,238) (1,548,599) (1,807,153) (2,049,082) (2,305,302)
Residual Income to all Investors (814,632) 97,915 302,480 511,957 810,688 856,061 1,127,874 1,511,132 2,015,604 2,665,079 2,866,923
Present Value of Residual Investor Income (678,789) 67,982 174,992 246,790 325,628 286,514 314,539 351,148 390,271 429,976 385,411
Entity Value 6,640,423
Less Value of Debt (2,164,902)
Less Value of Preferred Stock 0
Forecast Equity Value Before Time Adj. 4,475,521
Forecasted Value as of Valuation Date 5,544,137
Less Value of Contingent Equity Claims 0
Value Attributable to Common Equity 5,544,137
Common Shares Outstanding at BS Date 370,000
Equivalent Shares at Valuation Date 370,000
Forecast Price/Share $14.98
12/31/2012 12/31/2013 12/31/2014 12/31/2015 12/31/2016 12/31/2017 12/31/2018 12/31/2019 12/31/2020 12/31/2021 12/31/2022 12/31/2023 12/31/2024 12/31/2025
2,368,342 2,534,126 2,711,515 2,901,321 3,104,413 3,321,722 3,554,242 3,803,039 4,069,252 4,354,100 4,658,887 4,985,009 5,333,960 5,707,337
(6,236,481) (6,673,035) (7,140,147) (7,639,957) (8,174,754) (8,746,987) (9,359,276) (10,014,426) (10,715,436) (11,465,516) (12,268,102) (13,126,869) (14,045,750) (15,028,953)
3,777,787 4,042,232 4,325,188 4,627,951 4,951,908 5,298,541 5,669,439 6,066,300 6,490,941 6,945,306 7,431,478 7,951,681 8,508,299 9,103,880
327,606 285,920 249,539 217,787 190,075 165,889 144,781 126,359 110,280 96,248 84,001 73,313 63,984 55,842

302,386 323,553 346,201 370,436 396,366 424,112 453,799 485,565 519,555 555,924 594,838 636,477 681,031 728,703
3,769,808 4,033,695 4,316,053 4,618,177 4,941,449 5,287,351 5,657,465 6,053,488 6,477,232 6,930,638 7,415,783 7,934,888 8,490,330 9,084,653
801 857 917 981 1,050 1,124 1,202 1,286 1,376 1,473 1,576 1,686 1,804 1,930
318 315 312 309 307 304 301 298 295 293 290 287 285 282
0 0 0 0 0 0 0 0 0 0 0 0 0 0
0 0 0 0 0 0 0 0 0 0 0 0 0 0
0 0 0 0 0 0 0 0 0 0 0 0 0 0
0 0 0 0 0 0 0 0 0 0 0 0 0 0
2,573,964 2,754,142 2,946,932 3,153,217 3,373,942 3,610,118 3,862,826 4,133,224 4,422,550 4,732,128 5,063,377 5,417,813 5,797,060 6,202,855
(2,466,673) (2,639,340) (2,824,094) (3,021,781) (3,233,305) (3,459,636) (3,701,811) (3,960,938) (4,238,203) (4,534,878) (4,852,319) (5,191,981) (5,555,420) (5,944,300)
3,067,608 3,282,340 3,512,104 3,757,951 4,021,008 4,302,478 4,603,652 4,925,908 5,270,721 5,639,672 6,034,449 6,456,860 6,908,840 7,392,459
343,622 306,364 273,146 243,530 217,125 193,583 172,593 153,880 137,195 122,320 109,057 97,232 86,690 77,290
DCF Valuations ($000)
Company Name AMAZON COM INC
Most Recent Fiscal Year End 12/31/2000
Date of Valuation 6/30/2001
Cost of Common Equity 22.60%
Fiscal Year of Forecast 12/31/2001 12/31/2002 12/31/2003 12/31/2004 12/31/2005 12/31/2006 12/31/2007 12/31/2008 12/31/2009 12/31/2010 12/31/2011
Valuation to Common Equity
Free Cash Flow to Common Equity (511,287) 288,622 369,037 597,156 916,532 1,020,040 1,329,298 1,756,132 2,270,160 2,978,588 2,621,398
Present Value of FCF (417,037) 192,021 200,262 264,318 330,899 300,382 319,293 344,059 362,779 388,245 278,700
Present Value Beyond 20 Years 561,612
Present Value of First 20 Years 3,913,909
Forecast Equity Value Before Time Adj. 4,475,521
Forecasted Value as of Valuation Date 5,544,137
Less Value of Contingent Equity Claims 0
Value Attributable to Common Equity 5,544,137
Common Shares Outstanding at BS Date 370,000
Equivalent Shares at Valuation Date 370,000
Forecast Price/Share $14.98
Valuation All Investors
Cost of Debt 8.00%
Cost of Preferred Stock 9.00%
After Tax Weighted Average Cost of Capital 20.01%
Free Cash Flow to Debt 1,586,473 (70,831) (90,766) (102,155) (122,188) (153,776) (201,203) (242,577) (309,049) (387,876) 35,981
Present Value of FCF to Debt 1,468,957 (60,726) (72,053) (75,087) (83,159) (96,905) (117,400) (131,057) (154,601) (179,662) 15,431
Value of Debt 2,164,902
Free Cash Flow to Preferred Stock 0 0 0 0 0 0 0 0 0 0 0
Present Value of FCF to Preferred Stock 0 0 0 0 0 0 0 0 0 0 0
Value of Preferred Stock 0
Free Cash Flows to Investors 1,075,186 217,791 278,271 495,001 794,344 831,653 1,083,622 1,459,772 1,895,876 2,511,227 2,566,945
Present Value of FCF to Investors 895,895 151,212 160,986 238,616 319,063 278,345 302,198 339,213 367,088 405,154 345,084
Entity Value 6,640,423
Less Value of Debt (2,164,902)
Less Value of Preferred Stock 0
Forecast Equity Value Before Time Adj. 4,475,521
Forecasted Value as of Valuation Date 5,544,137
Less Value of Contingent Equity Claims 0
Value Attributable to Common Equity 5,544,137
Common Shares Outstanding at BS Date 370,000
Equivalent Shares at Valuation Date 370,000
Forecast Price/Share $14.98