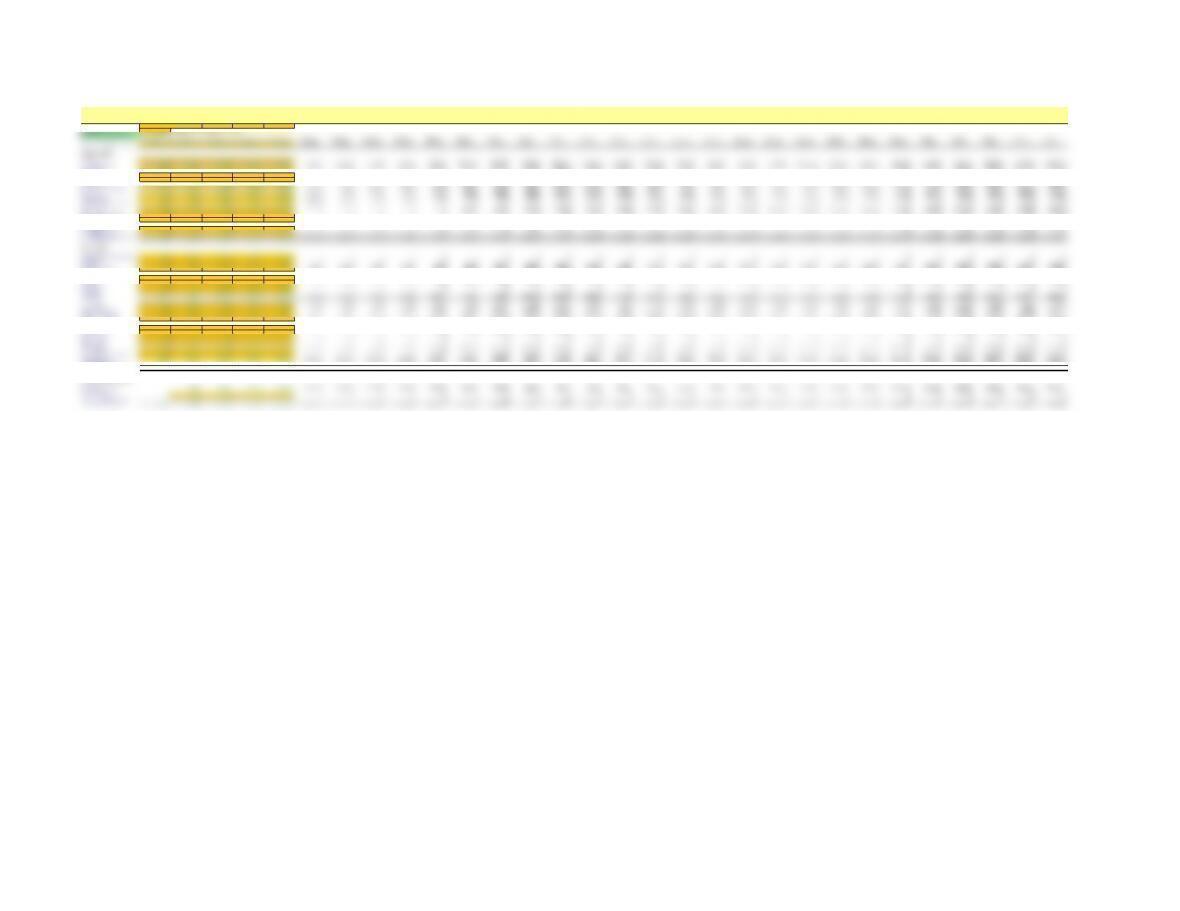
Financial Statements ($000s)
inactive
Ticker Industry Code Sector Code
Company Name
Common Shares Outstanding 370,000 (in 000s at most recent fiscal year end)
Estimated Price/Share=$14.98
Actual Actual Actual Actual Actual Forecast Forecast Forecast Forecast Forecast Forecast Forecast Forecast Forecast Forecast Forecast Forecast Forecast Forecast Forecast Forecast Forecast Forecast Forecast Forecast Forecast Forecast Forecast Forecast Forecast
Fiscal Year End (MM/DD/YYYY ) 12/31/1996 12/31/1997 12/31/1998 12/31/1999 12/31/2000 12/31/2001 12/31/2002 12/31/2003 12/31/2004 12/31/2005 12/31/2006 12/31/2007 12/31/2008 12/31/2009 12/31/2010 12/31/2011 12/31/2012 12/31/2013 12/31/2014 12/31/2015 12/31/2016 12/31/2017 12/31/2018 12/31/2019 12/31/2020 12/31/2021 12/31/2022 12/31/2023 12/31/2024 12/31/2025
Income Statement
Sales (Net) 15,746 147,787 609,819 1,639,839 2,761,983 3,424,859 4,281,074 5,351,342 6,689,178 8,361,472 10,451,840 13,064,800 16,331,000 20,413,750 25,517,187 27,303,391 29,214,628 31,259,652 33,447,827 35,789,175 38,294,418 40,975,027 43,843,279 46,912,308 50,196,170 53,709,902 57,469,595 61,492,467 65,796,939 70,402,725
Cost of Goods Sold (12,287) (118,969) (476,155) (1,349,194) (2,106,206) (2,611,695) (3,264,619) (4,080,774) (5,100,968) (6,376,210) (7,970,262) (9,962,827) (12,453,534) (15,566,918) (19,458,647) (20,820,753) (22,278,205) (23,837,680) (25,506,317) (27,291,760) (29,202,183) (31,246,336) (33,433,579) (35,773,930) (38,278,105) (40,957,572) (43,824,602) (46,892,324) (50,174,787) (53,687,022)
Gross Profit 3,459 28,818 133,664 290,645 655,777 813,163 1,016,454 1,270,568 1,588,210 1,985,262 2,481,578 3,101,973 3,877,466 4,846,832 6,058,540 6,482,638 6,936,422 7,421,972 7,941,510 8,497,416 9,092,235 9,728,691 10,409,700 11,138,379 11,918,065 12,752,330 13,644,993 14,600,142 15,622,152 16,715,703
R&D Expense (2,401) 0 0 0 0 0 0 0 0 0 0 0 0 0 0 0 0 0 0 0 0 0 0 0 0 0 0 0 0 0
SG&A Expense (7,501) (60,202) (194,696) (643,016) (888,317) (861,018) (923,199) (1,003,001) (1,119,967) (1,232,730) (1,431,902) (1,664,845) (1,917,746) (2,193,045) (2,486,134) (2,660,163) (2,846,375) (3,045,621) (3,258,814) (3,486,931) (3,731,016) (3,992,188) (4,271,641) (4,570,656) (4,890,601) (5,232,944) (5,599,250) (5,991,197) (6,410,581) (6,859,322)
EBITDA (6,443) (31,384) (61,032) (352,371) (232,540) (47,855) 93,255 267,567 468,242 752,532 1,049,676 1,437,128 1,959,720 2,653,787 3,572,406 3,822,475 4,090,048 4,376,351 4,682,696 5,010,485 5,361,218 5,736,504 6,138,059 6,567,723 7,027,464 7,519,386 8,045,743 8,608,945 9,211,571 9,856,381
Depreciation & Amortization 0 0 (42,599) (214,694) (406,232) (120,288) (90,904) (103,766) (117,873) (132,376) (148,720) (169,098) (193,222) (221,513) (256,220) (284,866) (304,807) (326,143) (348,973) (373,401) (399,539) (427,507) (457,432) (489,453) (523,714) (560,374) (599,601) (641,573) (686,483) (734,537)
EBIT (6,443) (31,384) (103,631) (567,065) (638,772) (168,143) 2,351 163,801 350,369 620,156 900,956 1,268,030 1,766,498 2,432,275 3,316,186 3,537,609 3,785,241 4,050,208 4,333,723 4,637,083 4,961,679 5,308,997 5,680,627 6,078,270 6,503,749 6,959,012 7,446,143 7,967,373 8,525,089 9,121,845
Interest Expense (5) (326) (26,639) (84,566) (130,921) (108,908) (56,589) (67,666) (80,899) (96,465) (115,367) (138,978) (168,073) (203,861) (248,391) (282,603) (302,386) (323,553) (346,201) (370,436) (396,366) (424,112) (453,799) (485,565) (519,555) (555,924) (594,838) (636,477) (681,031) (728,703)
Non-Operating Income (Loss) 202 690 8,629 8,432 (336,984) (410,983) 0 0 0 0 0 0 0 0 0 0 0 0 0 0 0 0 0 0 0 0 0 0 0 0
EBT (6,246) (31,020) (121,641) (643,199) (1,106,677) (688,034) (54,239) 96,135 269,470 523,691 785,589 1,129,052 1,598,425 2,228,414 3,067,794 3,255,005 3,482,856 3,726,656 3,987,521 4,266,648 4,565,313 4,884,885 5,226,827 5,592,705 5,984,194 6,403,088 6,851,304 7,330,895 7,844,058 8,393,142
Income Taxes 000000 0 0 0 0 (235,677) (361,297) (511,496) (713,092) (981,694) (1,041,602) (1,114,514) (1,192,530) (1,276,007) (1,365,327) (1,460,900) (1,563,163) (1,672,585) (1,789,666) (1,914,942) (2,048,988) (2,192,417) (2,345,887) (2,510,099) (2,685,806)
Minority Interest in Earnings 000000 0 0 0 0 0 0 0 0 0 0 0 0 0 0 0 0 0 0 0 0 0 0 0 0
Other Income (Loss) 0 0 (2,905) (76,769) (304,596) 0 0 0 0 0 0 0 0 0 0 0 0 0 0 0 0 0 0 0 0 0 0 0 0 0
Net Income Before Ext. Items (6,246) (31,020) (124,546) (719,968) (1,411,273) (688,034) (54,239) 96,135 269,470 523,691 549,912 767,755 1,086,929 1,515,321 2,086,100 2,213,404 2,368,342 2,534,126 2,711,515 2,901,321 3,104,413 3,321,722 3,554,242 3,803,039 4,069,252 4,354,100 4,658,887 4,985,009 5,333,960 5,707,337
Ext. Items & Disc. Ops. 000000 0 0 0 0 0 0 0 0 0 0 0 0 0 0 0 0 0 0 0 0 0 0 0 0
Preferred Dividends 000000 0 0 0 0 0 0 0 0 0 0 0 0 0 0 0 0 0 0 0 0 0 0 0 0
Net Income (available to common) (6,246) (31,020) (124,546) (719,968) (1,411,273) (688,034) (54,239) 96,135 269,470 523,691 549,912 767,755 1,086,929 1,515,321 2,086,100 2,213,404 2,368,342 2,534,126 2,711,515 2,901,321 3,104,413 3,321,722 3,554,242 3,803,039 4,069,252 4,354,100 4,658,887 4,985,009 5,333,960 5,707,337
Balance Sheet
Operating Cash and Market. Sec. 6,248 125,375 373,445 706,188 1,100,522 0 0 0 0 0 0 0 0 0 0 0 0 0 0 0 0 0 0 0 0 0 0 0 0 0
Receivables 000000 0 0 0 0 0 0 0 0 0 0 0 0 0 0 0 0 0 0 0 0 0 0 0 0
Inventories 571 8,971 29,501 220,646 174,563 216,458 270,573 338,216 422,770 528,462 660,578 825,722 1,032,153 1,290,191 1,612,739 1,725,630 1,846,425 1,975,674 2,113,971 2,261,949 2,420,286 2,589,706 2,770,985 2,964,954 3,172,501 3,394,576 3,632,196 3,886,450 4,158,502 4,449,597
Other Current Assets 321 3,363 21,308 79,643 86,044 106,695 133,368 166,710 208,388 260,485 325,606 407,007 508,759 635,949 794,936 850,582 910,123 973,831 1,041,999 1,114,939 1,192,985 1,276,494 1,365,849 1,461,458 1,563,760 1,673,223 1,790,349 1,915,674 2,049,771 2,193,255
Total Current Assets 7,140 137,709 424,254 1,006,477 1,361,129 323,153 403,941 504,926 631,158 788,947 986,184 1,232,730 1,540,912 1,926,140 2,407,675 2,576,212 2,756,547 2,949,506 3,155,971 3,376,889 3,613,271 3,866,200 4,136,834 4,426,412 4,736,261 5,067,800 5,422,546 5,802,124 6,208,272 6,642,852
PP&E (Net) 985 9,726 29,791 317,613 366,416 340,565 386,669 443,461 499,526 559,485 630,277 722,505 823,272 948,831 1,100,931 1,177,996 1,260,456 1,348,688 1,443,096 1,544,113 1,652,201 1,767,855 1,891,605 2,024,017 2,165,698 2,317,297 2,479,508 2,653,073 2,838,789 3,037,504
Investments 0 0 7,740 371,462 92,250 0 0 0 0 0 0 0 0 0 0 0 0 0 0 0 0 0 0 0 0 0 0 0 0 0
Intangibles 0 0 178,638 730,144 255,325 0 0 0 0 0 0 0 0 0 0 0 0 0 0 0 0 0 0 0 0 0 0 0 0 0
Other Assets 146 2,409 8,037 40,154 60,049 0 0 0 0 0 0 0 0 0 0 0 0 0 0 0 0 0 0 0 0 0 0 0 0 0
Total Assets 8,271 149,844 648,460 2,465,850 2,135,169 663,717 790,610 948,387 1,130,683 1,348,431 1,616,461 1,955,234 2,364,184 2,874,972 3,508,606 3,754,209 4,017,003 4,298,193 4,599,067 4,921,002 5,265,472 5,634,055 6,028,439 6,450,429 6,901,959 7,385,097 7,902,053 8,455,197 9,047,061 9,680,355
Current Debt 0 1,500 808 14,322 16,577 5,153 6,138 7,363 8,778 10,469 12,550 15,180 18,355 22,321 27,240 29,147 31,187 33,370 35,706 38,206 40,880 43,742 46,804 50,080 53,585 57,336 61,350 65,644 70,239 75,156
Accounts Payable 2,852 33,027 113,273 463,026 485,383 601,875 752,344 940,430 1,175,537 1,469,421 1,836,776 2,295,971 2,869,963 3,587,454 4,484,318 4,798,220 5,134,095 5,493,482 5,878,026 6,289,487 6,729,752 7,200,834 7,704,893 8,244,235 8,821,331 9,438,825 10,099,542 10,806,510 11,562,966 12,372,374
Income Taxes Payable 000000 0 0 0 0 0 0 0 0 0 0 0 0 0 0 0 0 0 0 0 0 0 0 0 0
Other Current Liabilities 2,018 10,024 47,494 255,886 472,996 539,365 731,229 815,391 907,212 1,005,264 1,106,922 1,207,863 1,301,374 1,336,599 1,329,590 1,422,662 1,522,248 1,628,806 1,742,822 1,864,819 1,995,357 2,135,032 2,284,484 2,444,398 2,615,506 2,798,591 2,994,493 3,204,107 3,428,394 3,668,382
Total Current Liabilities 4,870 44,551 161,575 733,234 974,956 1,146,393 1,489,711 1,763,183 2,091,527 2,485,154 2,956,249 3,519,014 4,189,692 4,946,374 5,841,148 6,250,029 6,687,531 7,155,658 7,656,554 8,192,512 8,765,988 9,379,608 10,036,180 10,738,713 11,490,423 12,294,752 13,155,385 14,076,262 15,061,600 16,115,912
Long-Term Debt 0 76,702 348,140 1,466,338 2,127,464 661,322 787,757 944,965 1,126,603 1,343,566 1,610,628 1,948,179 2,355,653 2,864,597 3,495,945 3,740,661 4,002,507 4,282,683 4,582,471 4,903,244 5,246,471 5,613,724 6,006,684 6,427,152 6,877,053 7,358,447 7,873,538 8,424,686 9,014,414 9,645,423
Other Liabilities 000000 0 0 0 0 0 0 0 0 0 0 0 0 0 0 0 0 0 0 0 0 0 0 0 0
Deferred Taxes 000000 0 0 0 0 0 0 0 0 0 0 0 0 0 0 0 0 0 0 0 0 0 0 0 0
Minority Interest 000000 0 0 0 0 0 0 0 0 0 0 0 0 0 0 0 0 0 0 0 0 0 0 0 0
Total Liabilities 4,870 121,253 509,715 2,199,572 3,102,420 1,807,715 2,277,468 2,708,148 3,218,130 3,828,719 4,566,876 5,467,192 6,545,345 7,810,971 9,337,093 9,990,690 10,690,038 11,438,341 12,239,024 13,095,756 14,012,459 14,993,331 16,042,864 17,165,865 18,367,476 19,653,199 21,028,923 22,500,947 24,076,014 25,761,335
Preferred Stock 600000 0 0 0 0 0 0 0 0 0 0 0 0 0 0 0 0 0 0 0 0 0 0 0 0
Paid in Common Capital (Net) 9,420 66,105 300,805 1,148,306 1,326,050 1,837,337 1,548,715 1,179,678 582,522 (334,011) (1,354,050) (2,683,348) (4,439,480) (6,709,640) (9,688,228) (12,309,625) (15,114,521) (18,115,759) (21,327,084) (24,763,201) (28,439,847) (32,373,858) (36,583,250) (41,087,299) (45,906,632) (51,063,318) (56,580,972) (62,484,862) (68,802,024) (75,561,387)
Retained Earnings (6,025) (37,514) (162,060) (882,028) (2,293,301) (2,981,335) (3,035,573) (2,939,439) (2,669,969) (2,146,277) (1,596,365) (828,610) 258,319 1,773,640 3,859,741 6,073,144 8,441,486 10,975,612 13,687,126 16,588,447 19,692,860 23,014,582 26,568,824 30,371,864 34,441,116 38,795,216 43,454,103 48,439,112 53,773,071 59,480,408
Total Common Equity 3,395 28,591 138,745 266,278 (967,251) (1,143,998) (1,486,858) (1,759,761) (2,087,447) (2,480,288) (2,950,415) (3,511,958) (4,181,161) (4,935,999) (5,828,487) (6,236,481) (6,673,035) (7,140,147) (7,639,957) (8,174,754) (8,746,987) (9,359,276) (10,014,426) (10,715,436) (11,465,516) (12,268,102) (13,126,869) (14,045,750) (15,028,953) (16,080,979)
Total Liabilities and Equity 8,271 149,844 648,460 2,465,850 2,135,169 663,717 790,610 948,387 1,130,683 1,348,431 1,616,461 1,955,234 2,364,184 2,874,972 3,508,606 3,754,209 4,017,003 4,298,193 4,599,067 4,921,002 5,265,472 5,634,055 6,028,439 6,450,429 6,901,959 7,385,097 7,902,053 8,455,197 9,047,061 9,680,355
Statement of Retained Earnings
Beg. Retained Earnings (6,025) (37,514) (162,060) (882,028) (2,293,301) (2,981,335) (3,035,573) (2,939,439) (2,669,969) (2,146,277) (1,596,365) (828,610) 258,319 1,773,640 3,859,741 6,073,144 8,441,486 10,975,612 13,687,126 16,588,447 19,692,860 23,014,582 26,568,824 30,371,864 34,441,116 38,795,216 43,454,103 48,439,112 53,773,071
+Net Income (31,020) (124,546) (719,968) (1,411,273) (688,034) (54,239) 96,135 269,470 523,691 549,912 767,755 1,086,929 1,515,321 2,086,100 2,213,404 2,368,342 2,534,126 2,711,515 2,901,321 3,104,413 3,321,722 3,554,242 3,803,039 4,069,252 4,354,100 4,658,887 4,985,009 5,333,960 5,707,337
-Common Dividends 0 0 0 0 0 0 0 0 0 0 0 0 0 0 0 0 0 0 0 0 0 0 0 0 0 0 0 0 0
+/-Clean Surplus Plug (Ignore) (469) 0 0 0 0 0 0 0 0 0 0 0 0 0 0 0 0 0 0 0 0 0 0 0 0 0 0 0 0
=End. Retained Earnings (6,025) (37,514) (162,060) (882,028) (2,293,301) (2,981,335) (3,035,573) (2,939,439) (2,669,969) (2,146,277) (1,596,365) (828,610) 258,319 1,773,640 3,859,741 6,073,144 8,441,486 10,975,612 13,687,126 16,588,447 19,692,860 23,014,582 26,568,824 30,371,864 34,441,116 38,795,216 43,454,103 48,439,112 53,773,071 59,480,408
AMAZON COM INC
Industry/Sector Code LookUp
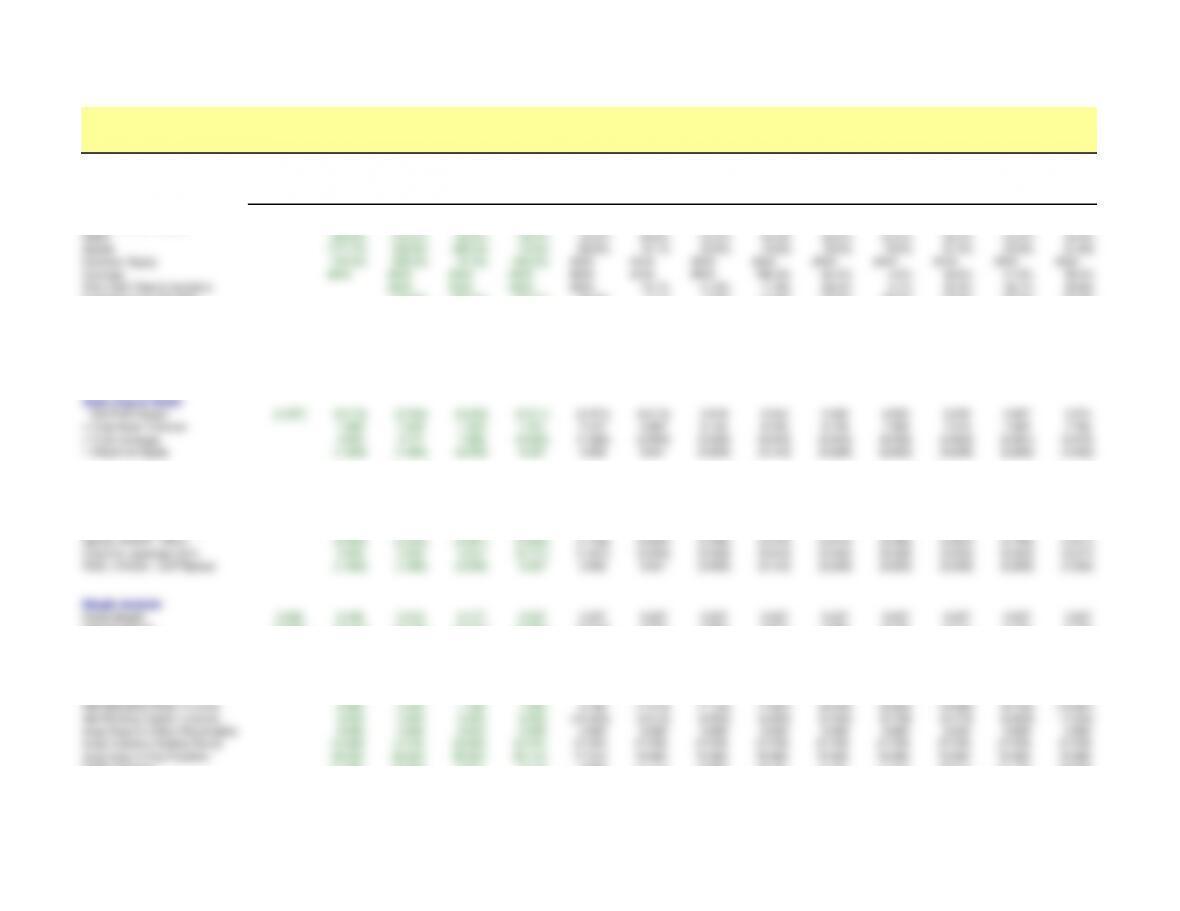
Ratio Analysis
Company Name AMAZON COM INC
Actual Actual Actual Actual Actual Forecast Forecast Forecast Forecast Forecast Forecast Forecast Forecast Forecast
Fiscal Year End Date 12/31/1996 12/31/1997 12/31/1998 12/31/1999 12/31/2000 12/31/2001 12/31/2002 12/31/2003 12/31/2004 12/31/2005 12/31/2006 12/31/2007 12/31/2008 12/31/2009
Annual Growth Rates
Sales 838.6% 312.6% 168.9% 68.4% 24.0% 25.0% 25.0% 25.0% 25.0% 25.0% 25.0% 25.0% 25.0%
Assets 1711.7% 332.8% 280.3% -13.4% -68.9% 19.1% 20.0% 19.2% 19.3% 19.9% 21.0% 20.9% 21.6%
Common Equity 742.2% 385.3% 91.9% -463.2% #N/A #N/A #N/A #N/A #N/A #N/A #N/A #N/A #N/A
Earnings #N/A #N/A #N/A #N/A #N/A #N/A #N/A 180.3% 94.3% 5.0% 39.6% 41.6% 39.4%
Free Cash Flow to Investors #N/A #N/A #N/A #N/A -79.7% 27.8% 77.9% 60.5% 4.7% 30.3% 34.7% 29.9%
Sustainable Growth Rate -148.9% -355.5% 402.7% 65.2% 4.1% -5.9% -14.0% –22.9% -20.3% -23.8% -28.3% -33.2%
Profitability
Return on Equity (1.940) (1.489) (3.555) 4.027 0.652 0.041 (0.059) (0.140) (0.229) (0.203) (0.238) (0.283) (0.332)
Return on Equity (b4 non-recurring) (1.983) (1.557) (3.218) 2.196 0.262 0.041 (0.059) (0.140) (0.229) (0.203) (0.238) (0.283) (0.332)
Return on Net Operating Assets (0.557) (0.329) (0.569) (0.876) (1.656) (0.004) (0.218) (0.398) (0.597) (0.514) (0.600) (0.716) (0.858)
Basic Dupont Model
Net Profit Margin (0.397) (0.210) (0.204) (0.439) (0.511) (0.201) (0.013) 0.018 0.040 0.063 0.053 0.059 0.067 0.074
x Total Asset Turnover 1.869 1.528 1.053 1.201 2.447 5.887 6.155 6.435 6.746 7.050 7.316 7.562 7.793
x Total Leverage 4.943 4.771 7.689 (6.564) (1.326) (0.553) (0.536) (0.540) (0.543) (0.546) (0.553) (0.561) (0.575)
= Return on Equity (1.940) (1.489) (3.555) 4.027 0.652 0.041 (0.059) (0.140) (0.229) (0.203) (0.238) (0.283) (0.332)
Advanced Dupont Model
Net Operating Margin (0.396) (0.208) (0.161) (0.387) (0.464) (0.169) 0.001 0.031 0.052 0.074 0.060 0.066 0.074 0.081
x Net Operating Asset Turnover 2.682 2.052 1.468 1.889 9.796 (7.315) (7.133) (7.604) (8.046) (8.520) (9.086) (9.733) (10.587)
= Return on Net Operating Assets (0.557) (0.329) (0.569) (0.876) (1.656) (0.004) (0.218) (0.398) (0.597) (0.514) (0.600) (0.716) (0.858)
Net Borrowing Cost (NBC) 0.008 0.125 0.092 0.072 0.078 0.078 0.078 0.078 0.078 0.054 0.053 0.053 0.053
Spread (RNOA – NBC) (0.565) (0.454) (0.661) (0.948) (1.734) (0.082) (0.296) (0.476) (0.674) (0.568) (0.652) (0.769) (0.911)
Financial Leverage (LEV) 2.445 2.553 4.517 (5.171) (1.331) (0.555) (0.538) (0.543) (0.545) (0.548) (0.555) (0.564) (0.577)
ROE = RNOA + LEV*Spread (1.940) (1.489) (3.555) 4.027 0.652 0.041 (0.059) (0.140) (0.229) (0.203) (0.238) (0.283) (0.332)
Margin Analysis
Gross Margin 0.220 0.195 0.219 0.177 0.237 0.237 0.237 0.237 0.237 0.237 0.237 0.237 0.237 0.237
EBITDA Margin (0.409) (0.212) (0.100) (0.215) (0.084) (0.014) 0.022 0.050 0.070 0.090 0.100 0.110 0.120 0.130
EBIT Margin (0.409) (0.212) (0.170) (0.346) (0.231) (0.049) 0.001 0.031 0.052 0.074 0.086 0.097 0.108 0.119
Net Operating Margin (b4 non-rec.) (0.409) (0.212) (0.170) (0.346) (0.231) (0.049) 0.001 0.031 0.052 0.074 0.060 0.066 0.074 0.081
Net Operating Margin (0.396) (0.208) (0.161) (0.387) (0.464) (0.169) 0.001 0.031 0.052 0.074 0.060 0.066 0.074 0.081
Turnover Analysis
Net Operating Asset Turnover 2.682 2.052 1.468 1.889 9.796 (7.315) (7.133) (7.604) (8.046) (8.520) (9.086) (9.733) (10.587)
Net Working Capital Turnover 3.049 3.405 5.952 8.002 (16.492) (4.512) (4.592) (4.950) (5.330) (5.738) (6.179) (6.664) (7.254)
Avge Days to Collect Receivables 0.000 0.000 0.000 0.000 0.000 0.000 0.000 0.000 0.000 0.000 0.000 0.000 0.000
Avge Inventory Holding Period 14.638 14.745 33.836 34.244 27.324 27.226 27.226 27.226 27.226 27.226 27.226 27.226 27.226
Avge Days to Pay Payables 59.220 58.600 90.820 80.419 77.214 76.980 76.980 76.980 76.980 76.980 76.980 76.980 76.980
PP&E Turnover 27.595 30.864 9.441 8.076 9.689 11.774 12.893 14.187 15.791 17.570 19.315 21.130 23.039
Analysis of Leverage
-Long-Term Capital Structure
Debt to Equity Ratio 0.000 2.735 2.515 5.561 (2.217) (0.583) (0.534) (0.541) (0.544) (0.546) (0.550) (0.559) (0.568) (0.585)
FFO to Total Debt (0.793) (0.384) (0.552) (0.555) (0.404) 0.050 0.229 0.371 0.527 0.469 0.522 0.590 0.660
CFO to Total Debt (0.109) (0.013) (0.215) (0.401) (0.318) 0.408 0.425 0.563 0.715 0.652 0.697 0.756 0.800
Analysis of Leverage
– Short-Term Liquidity
Current Ratio 1.466 3.091 2.626 1.373 1.396 0.282 0.271 0.286 0.302 0.317 0.334 0.350 0.368 0.389
Quick Ratio 1.283 2.814 2.311 0.963 1.129 0.000 0.000 0.000 0.000 0.000 0.000 0.000 0.000 0.000
EBIT Interest Coverage (1288.600) (96.270) (3.890) (6.706) (4.879) (1.544) 0.042 2.421 4.331 6.429 7.809 9.124 10.510 11.931
EBITDA Interest Coverage (1288.600) (96.270) (2.291) (4.167) (1.776) (0.439) 1.648 3.954 5.788 7.801 9.099 10.341 11.660 13.018
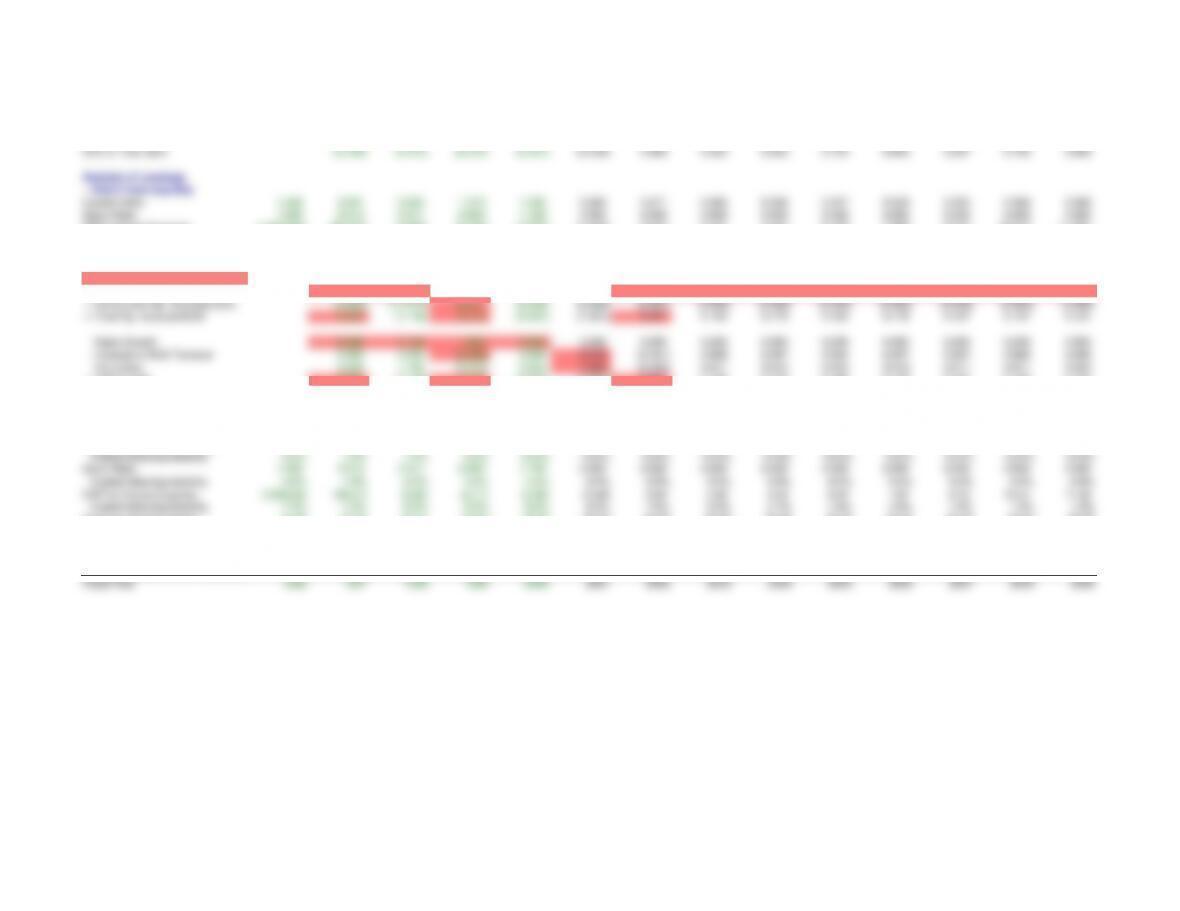
Analysis of Earnings Quality
(Red Shading = Quality Flag)
Current Op. Accruals/NOA 9.392 4.264 (2.702) (0.268) (1.578) 0.548 0.247 0.249 0.246 0.241 0.236 0.232 0.203
+ NonCurrent Op. Accruals/NOA (3.865) (11.413) 10.811 (0.658) (5.684) (0.097) (0.082) (0.069) (0.063) (0.063) (0.069) (0.065) (0.069)
= Total Op. Accruals/NOA 5.527 (7.148) 8.110 (0.927) (7.261) 0.451 0.165 0.179 0.183 0.178 0.167 0.167 0.134
Sales Growth 8.386 3.126 1.689 0.684 0.240 0.250 0.250 0.250 0.250 0.250 0.250 0.250 0.250
– increase in NOA Turnover 0.305 2.490 (2.388) 0.956 6.049 (0.161) 0.068 0.057 0.054 0.057 0.067 0.066 0.093
– Interaction 2.554 7.785 (4.033) 0.655 1.452 (0.040) 0.017 0.014 0.013 0.014 0.017 0.017 0.023
= NOA growth 5.527 (7.148) 8.110 (0.927) (7.261) 0.451 0.165 0.179 0.183 0.178 0.167 0.167 0.134
Analysis of Credit Risk
Net Income to Total Assets -0.755 -0.207 -0.192 -0.292 -0.661 -1.037 -0.069 0.101 0.238 0.388 0.340 0.393 0.460 0.527
implied default probability 8.3% 8.0% 8.0% 8.0% 8.3% 8.3% 7.2% 2.0% 2.0% 2.0% 2.0% 2.0% 2.0% 2.0%
Total Liabilities to Total Assets 0.589 0.809 0.786 0.892 1.453 2.724 2.881 2.856 2.846 2.839 2.825 2.796 2.769 2.717
implied default probability 4.5% 7.0% 7.0% 9.0% 10.0% 10.0% 10.0% 10.0% 10.0% 10.0% 10.0% 10.0% 10.0% 10.0%
Quick Ratio 1.283 2.814 2.311 0.963 1.129 0.000 0.000 0.000 0.000 0.000 0.000 0.000 0.000 0.000
implied default probability 3.5% 1.5% 2.0% 4.2% 4.0% 9.0% 9.0% 9.0% 9.0% 9.0% 9.0% 9.0% 9.0% 9.0%
EBIT to Interest Expense (1288.60) (96.27) (3.89) (6.71) (4.88) (1.54) 0.04 2.42 4.33 6.43 7.81 9.12 10.51 11.93
implied default probability 7.5% 7.5% 9.0% 9.0% 9.0% 8.5% 7.0% 3.0% 2.1% 1.8% 1.8% 1.8% 1.5% 1.5%
Inventory Holding Period 16.96 27.52 22.61 59.69 30.25 30.25 30.25 30.25 30.25 30.25 30.25 30.25 30.25 30.25
implied default probability 4.0% 4.0% 4.0% 4.5% 4.0% 4.0% 4.0% 4.0% 4.0% 4.0% 4.0% 4.0% 4.0% 4.0%
Annual Sales Growth 838.6% 312.6% 168.9% 68.4% 24.0% 25.0% 25.0% 25.0% 25.0% 25.0% 25.0% 25.0% 25.0%
implied default probability 6.5% 6.5% 6.5% 5.0% 3.2% 4.2% 4.2% 4.2% 4.2% 4.2% 4.2% 4.2% 4.2%
Average Implied Default Probability 5.8% 6.1% 6.9% 6.7% 7.2% 6.9% 5.4% 5.2% 5.2% 5.2% 5.2% 5.1% 5.1%
Fiscal Year 1996 1997 1998 1999 2000 2001 2002 2003 2004 2005 2006 2007 2008 2009
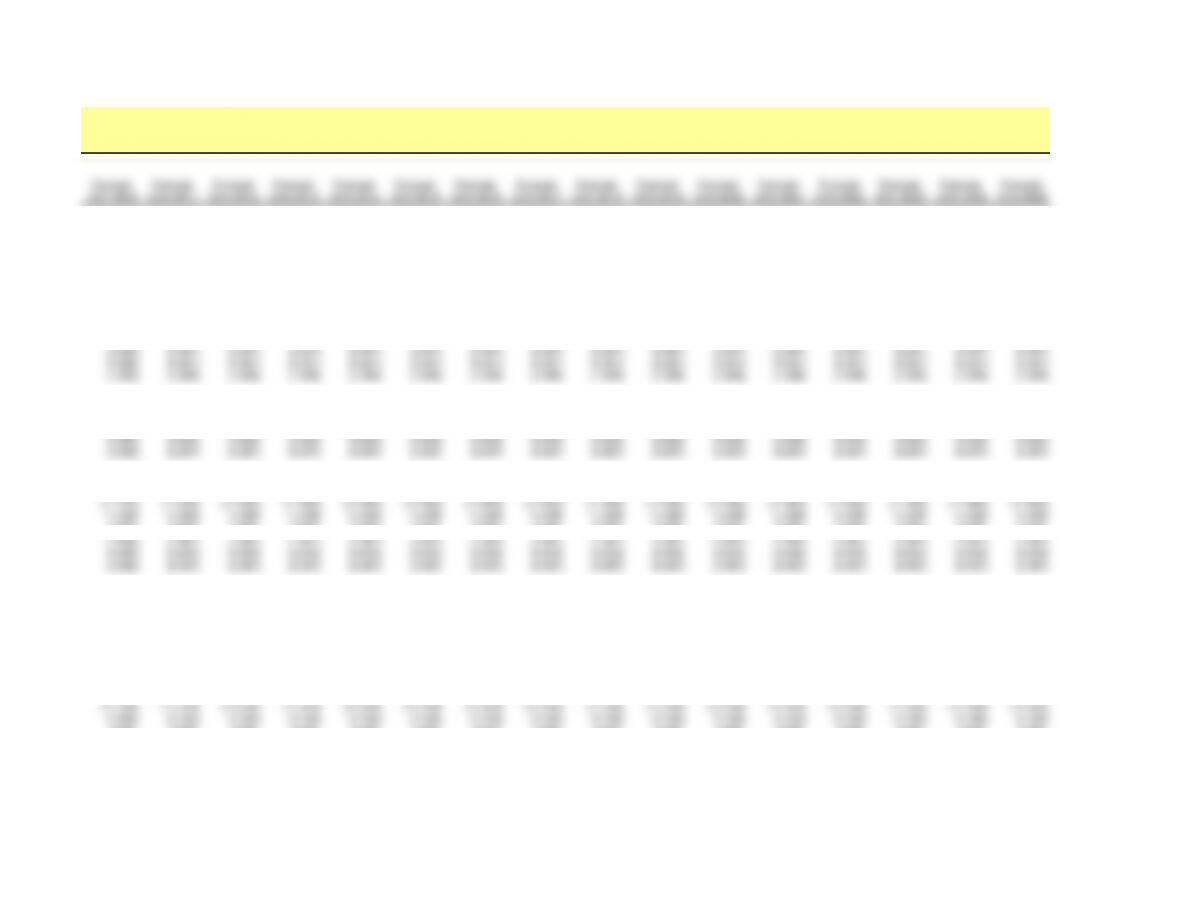
Forecast Forecast Forecast Forecast Forecast Forecast Forecast Forecast Forecast Forecast Forecast Forecast Forecast Forecast Forecast Forecast
12/31/2010 12/31/2011 12/31/2012 12/31/2013 12/31/2014 12/31/2015 12/31/2016 12/31/2017 12/31/2018 12/31/2019 12/31/2020 12/31/2021 12/31/2022 12/31/2023 12/31/2024 12/31/2025
25.0% 7.0% 7.0% 7.0% 7.0% 7.0% 7.0% 7.0% 7.0% 7.0% 7.0% 7.0% 7.0% 7.0% 7.0% 7.0%
22.0% 7.0% 7.0% 7.0% 7.0% 7.0% 7.0% 7.0% 7.0% 7.0% 7.0% 7.0% 7.0% 7.0% 7.0% 7.0%
#N/A #N/A #N/A #N/A #N/A #N/A #N/A #N/A #N/A #N/A #N/A #N/A #N/A #N/A #N/A #N/A
37.7% 6.1% 7.0% 7.0% 7.0% 7.0% 7.0% 7.0% 7.0% 7.0% 7.0% 7.0% 7.0% 7.0% 7.0% 7.0%
32.5% 2.2% 7.0% 7.0% 7.0% 7.0% 7.0% 7.0% 7.0% 7.0% 7.0% 7.0% 7.0% 7.0% 7.0% 7.0%
-38.8% -36.7% –36.7% -36.7% -36.7% -36.7% -36.7% –36.7% -36.7% -36.7% -36.7% -36.7% –36.7% -36.7% -36.7% -36.7%
(0.388) (0.367) (0.367) (0.367) (0.367) (0.367) (0.367) (0.367) (0.367) (0.367) (0.367) (0.367) (0.367) (0.367) (0.367) (0.367)
(0.388) (0.367) (0.367) (0.367) (0.367) (0.367) (0.367) (0.367) (0.367) (0.367) (0.367) (0.367) (0.367) (0.367) (0.367) (0.367)
(1.036) (1.008) (1.008) (1.008) (1.008) (1.008) (1.008) (1.008) (1.008) (1.008) (1.008) (1.008) (1.008) (1.008) (1.008) (1.008)
0.082 0.081 0.081 0.081 0.081 0.081 0.081 0.081 0.081 0.081 0.081 0.081 0.081 0.081 0.081 0.081
7.995 7.519 7.519 7.519 7.519 7.519 7.519 7.519 7.519 7.519 7.519 7.519 7.519 7.519 7.519 7.519
(0.593) (0.602) (0.602) (0.602) (0.602) (0.602) (0.602) (0.602) (0.602) (0.602) (0.602) (0.602) (0.602) (0.602) (0.602) (0.602)
(0.388) (0.367) (0.367) (0.367) (0.367) (0.367) (0.367) (0.367) (0.367) (0.367) (0.367) (0.367) (0.367) (0.367) (0.367) (0.367)
0.088 0.088 0.088 0.088 0.088 0.088 0.088 0.088 0.088 0.088 0.088 0.088 0.088 0.088 0.088 0.088
(11.720) (11.443) (11.443) (11.443) (11.443) (11.443) (11.443) (11.443) (11.443) (11.443) (11.443) (11.443) (11.443) (11.443) (11.443) (11.443)
(1.036) (1.008) (1.008) (1.008) (1.008) (1.008) (1.008) (1.008) (1.008) (1.008) (1.008) (1.008) (1.008) (1.008) (1.008) (1.008)
0.053 0.053 0.053 0.053 0.053 0.053 0.053 0.053 0.053 0.053 0.053 0.053 0.053 0.053 0.053 0.053
(1.088) (1.061) (1.061) (1.061) (1.061) (1.061) (1.061) (1.061) (1.061) (1.061) (1.061) (1.061) (1.061) (1.061) (1.061) (1.061)
(0.595) (0.604) (0.604) (0.604) (0.604) (0.604) (0.604) (0.604) (0.604) (0.604) (0.604) (0.604) (0.604) (0.604) (0.604) (0.604)
(0.388) (0.367) (0.367) (0.367) (0.367) (0.367) (0.367) (0.367) (0.367) (0.367) (0.367) (0.367) (0.367) (0.367) (0.367) (0.367)
0.237 0.237 0.237 0.237 0.237 0.237 0.237 0.237 0.237 0.237 0.237 0.237 0.237 0.237 0.237 0.237
0.140 0.140 0.140 0.140 0.140 0.140 0.140 0.140 0.140 0.140 0.140 0.140 0.140 0.140 0.140 0.140
0.130 0.130 0.130 0.130 0.130 0.130 0.130 0.130 0.130 0.130 0.130 0.130 0.130 0.130 0.130 0.130
0.088 0.088 0.088 0.088 0.088 0.088 0.088 0.088 0.088 0.088 0.088 0.088 0.088 0.088 0.088 0.088
0.088 0.088 0.088 0.088 0.088 0.088 0.088 0.088 0.088 0.088 0.088 0.088 0.088 0.088 0.088 0.088
(11.720) (11.443) (11.443) (11.443) (11.443) (11.443) (11.443) (11.443) (11.443) (11.443) (11.443) (11.443) (11.443) (11.443) (11.443) (11.443)
(7.969) (7.745) (7.745) (7.745) (7.745) (7.745) (7.745) (7.745) (7.745) (7.745) (7.745) (7.745) (7.745) (7.745) (7.745) (7.745)
0.000 0.000 0.000 0.000 0.000 0.000 0.000 0.000 0.000 0.000 0.000 0.000 0.000 0.000 0.000 0.000
27.226 29.262 29.262 29.262 29.262 29.262 29.262 29.262 29.262 29.262 29.262 29.262 29.262 29.262 29.262 29.262
76.980 81.808 81.808 81.808 81.808 81.808 81.808 81.808 81.808 81.808 81.808 81.808 81.808 81.808 81.808 81.808
24.898 23.962 23.962 23.962 23.962 23.962 23.962 23.962 23.962 23.962 23.962 23.962 23.962 23.962 23.962 23.962

(0.604) (0.604) (0.604) (0.604) (0.604) (0.604) (0.604) (0.604) (0.604) (0.604) (0.604) (0.604) (0.604) (0.604) (0.604) (0.604)
0.731 0.685 0.685 0.685 0.685 0.685 0.685 0.685 0.685 0.685 0.685 0.685 0.685 0.685 0.685 0.685
0.858 0.751 0.751 0.751 0.751 0.751 0.751 0.751 0.751 0.751 0.751 0.751 0.751 0.751 0.751 0.751
0.412 0.412 0.412 0.412 0.412 0.412 0.412 0.412 0.412 0.412 0.412 0.412 0.412 0.412 0.412 0.412
0.000 0.000 0.000 0.000 0.000 0.000 0.000 0.000 0.000 0.000 0.000 0.000 0.000 0.000 0.000 0.000
13.351 12.518 12.518 12.518 12.518 12.518 12.518 12.518 12.518 12.518 12.518 12.518 12.518 12.518 12.518 12.518
14.382 13.526 13.526 13.526 13.526 13.526 13.526 13.526 13.526 13.526 13.526 13.526 13.526 13.526 13.526 13.526
0.199 0.103 0.103 0.103 0.103 0.103 0.103 0.103 0.103 0.103 0.103 0.103 0.103 0.103 0.103 0.103
(0.074) (0.033) (0.033) (0.033) (0.033) (0.033) (0.033) (0.033) (0.033) (0.033) (0.033) (0.033) (0.033) (0.033) (0.033) (0.033)
0.125 0.070 0.070 0.070 0.070 0.070 0.070 0.070 0.070 0.070 0.070 0.070 0.070 0.070 0.070 0.070
0.250 0.070 0.070 0.070 0.070 0.070 0.070 0.070 0.070 0.070 0.070 0.070 0.070 0.070 0.070 0.070
0.100 0.000 0.000 (0.000) 0.000 (0.000) 0.000 0.000 (0.000) 0.000 (0.000) (0.000) 0.000 0.000 0.000 (0.000)
0.025 0.000 0.000 (0.000) 0.000 (0.000) 0.000 0.000 (0.000) 0.000 (0.000) (0.000) 0.000 0.000 0.000 (0.000)
0.125 0.070 0.070 0.070 0.070 0.070 0.070 0.070 0.070 0.070 0.070 0.070 0.070 0.070 0.070 0.070
0.595 0.590 0.590 0.590 0.590 0.590 0.590 0.590 0.590 0.590 0.590 0.590 0.590 0.590 0.590 0.590
2.0% 2.0% 2.0% 2.0% 2.0% 2.0% 2.0% 2.0% 2.0% 2.0% 2.0% 2.0% 2.0% 2.0% 2.0% 2.0%
2.661 2.661 2.661 2.661 2.661 2.661 2.661 2.661 2.661 2.661 2.661 2.661 2.661 2.661 2.661 2.661
10.0% 10.0% 10.0% 10.0% 10.0% 10.0% 10.0% 10.0% 10.0% 10.0% 10.0% 10.0% 10.0% 10.0% 10.0% 10.0%
0.000 0.000 0.000 0.000 0.000 0.000 0.000 0.000 0.000 0.000 0.000 0.000 0.000 0.000 0.000 0.000
9.0% 9.0% 9.0% 9.0% 9.0% 9.0% 9.0% 9.0% 9.0% 9.0% 9.0% 9.0% 9.0% 9.0% 9.0% 9.0%
13.35 12.52 12.52 12.52 12.52 12.52 12.52 12.52 12.52 12.52 12.52 12.52 12.52 12.52 12.52 12.52
1.5% 1.5% 1.5% 1.5% 1.5% 1.5% 1.5% 1.5% 1.5% 1.5% 1.5% 1.5% 1.5% 1.5% 1.5% 1.5%
30.25 30.25 30.25 30.25 30.25 30.25 30.25 30.25 30.25 30.25 30.25 30.25 30.25 30.25 30.25 30.25
4.0% 4.0% 4.0% 4.0% 4.0% 4.0% 4.0% 4.0% 4.0% 4.0% 4.0% 4.0% 4.0% 4.0% 4.0% 4.0%
25.0% 7.0% 7.0% 7.0% 7.0% 7.0% 7.0% 7.0% 7.0% 7.0% 7.0% 7.0% 7.0% 7.0% 7.0% 7.0%
4.2% 3.0% 3.0% 3.0% 3.0% 3.0% 3.0% 3.0% 3.0% 3.0% 3.0% 3.0% 3.0% 3.0% 3.0% 3.0%
5.1% 4.9% 4.9% 4.9% 4.9% 4.9% 4.9% 4.9% 4.9% 4.9% 4.9% 4.9% 4.9% 4.9% 4.9% 4.9%
2010 2011 2012 2013 2014 2015 2016 2017 2018 2019 2020 2021 2022 2023 2024 2025
Cash Flow Analysis ($000)
Company Name AMAZON COM INC
Actual Actual Actual Actual Forecast Forecast Forecast Forecast Forecast Forecast Forecast Forecast Forecast Forecast Forecast Forecast Forecast Forecast Forecast Forecast Forecast Forecast Forecast Forecast Forecast Forecast Forecast Forecast Forecast
Fiscal Year End Date 12/31/1997 12/31/1998 12/31/1999 12/31/2000 12/31/2001 12/31/2002 12/31/2003 12/31/2004 12/31/2005 12/31/2006 12/31/2007 12/31/2008 12/31/2009 12/31/2010 12/31/2011 12/31/2012 12/31/2013 12/31/2014 12/31/2015 12/31/2016 12/31/2017 12/31/2018 12/31/2019 12/31/2020 12/31/2021 12/31/2022 12/31/2023 12/31/2024 12/31/2025
Operating:
Net Income (31,020) (124,546) (719,968) (1,411,273) (688,034) (54,239) 96,135 269,470 523,691 549,912 767,755 1,086,929 1,515,321 2,086,100 2,213,404 2,368,342 2,534,126 2,711,515 2,901,321 3,104,413 3,321,722 3,554,242 3,803,039 4,069,252 4,354,100 4,658,887 4,985,009 5,333,960 5,707,337
+Depreciation & Amortization 0 42,599 214,694 406,232 120,288 90,904 103,766 117,873 132,376 148,720 169,098 193,222 221,513 256,220 284,866 304,807 326,143 348,973 373,401 399,539 427,507 457,432 489,453 523,714 560,374 599,601 641,573 686,483 734,537
+Increase in Deferred Taxes 00000000000000000000000000000
+Increase in Other Liabilities 00000000000000000000000000000
+Increase in Minority Interest 00000000000000000000000000000
+Preferred Dividends 00000000000000000000000000000
=Funds From Operations (31,020) (81,947) (505,274) (1,005,041) (567,746) 36,666 199,901 387,344 656,068 698,632 936,853 1,280,151 1,736,834 2,342,321 2,498,270 2,673,148 2,860,269 3,060,488 3,274,722 3,503,952 3,749,229 4,011,675 4,292,492 4,592,967 4,914,474 5,258,487 5,626,582 6,020,442 6,441,873
-Increase in Receivables 00000000000000000000000000000
-Increase in Inventory (8,400) (20,530) (191,145) 46,083 (41,895) (54,115) (67,643) (84,554) (105,692) (132,116) (165,144) (206,431) (258,038) (322,548) (112,892) (120,794) (129,250) (138,297) (147,978) (158,336) (169,420) (181,279) (193,969) (207,547) (222,075) (237,620) (254,254) (272,052) (291,095)
-Increase in Other Current Assets (3,042) (17,945) (58,335) (6,401) (20,651) (26,674) (33,342) (41,678) (52,097) (65,121) (81,401) (101,752) (127,190) (158,987) (55,646) (59,541) (63,709) (68,168) (72,940) (78,046) (83,509) (89,355) (95,609) (102,302) (109,463) (117,126) (125,324) (134,097) (143,484)
+Increase in Accounts Payable 30,175 80,246 349,753 22,357 116,492 150,469 188,086 235,107 293,884 367,355 459,194 573,993 717,491 896,864 313,902 335,875 359,387 384,544 411,462 440,264 471,083 504,058 539,342 577,096 617,493 660,718 706,968 756,456 809,408
+Increase in Taxes Payable 00000000000000000000000000000
+Increase in Other Curr. Liabilities 8,006 37,470 208,392 217,110 66,369 191,864 84,161 91,821 98,052 101,658 100,941 93,511 35,225 (7,009) 93,071 99,586 106,557 114,016 121,998 130,537 139,675 149,452 159,914 171,108 183,085 195,901 209,614 224,287 239,988
=Cash From Operations (4,281) (2,706) (196,609) (725,892) (447,431) 298,211 371,163 588,041 890,215 970,409 1,250,442 1,639,472 2,104,322 2,750,641 2,736,706 2,928,275 3,133,254 3,352,582 3,587,263 3,838,371 4,107,057 4,394,552 4,702,170 5,031,322 5,383,515 5,760,361 6,163,586 6,595,037 7,056,689
Investing:
-Capital Expenditures (8,741) (62,664) (502,516) (455,035) (94,437) (137,009) (160,558) (173,938) (192,335) (219,513) (261,325) (293,990) (347,072) (408,320) (361,931) (387,266) (414,375) (443,381) (474,418) (507,627) (543,161) (581,182) (621,865) (665,396) (711,973) (761,811) (815,138) (872,198) (933,252)
-Increase in Investments 0 (7,740) (363,722) 279,212 92,250000000000000000000000000
-Purchases of Intangibles 0 (178,638) (551,506) 474,819 255,325000000000000000000000000
-Increase in Other Assets (2,263) (5,628) (32,117) (19,895) 60,049000000000000000000000000
=Cash From Investing (11,004) (254,670) (1,449,861) 279,101 313,187 (137,009) (160,558) (173,938) (192,335) (219,513) (261,325) (293,990) (347,072) (408,320) (361,931) (387,266) (414,375) (443,381) (474,418) (507,627) (543,161) (581,182) (621,865) (665,396) (711,973) (761,811) (815,138) (872,198) (933,252)
Financing:
+Increase in Debt 78,202 270,746 1,131,712 663,381 (1,477,566) 127,420 158,432 183,054 218,653 269,143 340,181 410,650 512,909 636,268 246,623 263,887 282,359 302,124 323,272 345,901 370,115 396,023 423,744 453,406 485,145 519,105 555,442 594,323 635,926
-Dividends Paid on Preferred 00000000000000000000000000000
+Increase in Pref. Stock (6) 0 0 0 0000000000000000000000000
-Dividends Paid on Common 00000000000000000000000000000
+/-Net Issuance of Common Stock 56,685 234,700 847,501 177,744 511,287 (288,622) (369,037) (597,156) (916,532) (1,020,040) (1,329,298) (1,756,132) (2,270,160) (2,978,588) (2,621,398) (2,804,896) (3,001,238) (3,211,325) (3,436,118) (3,676,646) (3,934,011) (4,209,392) (4,504,049) (4,819,333) (5,156,686) (5,517,654) (5,903,890) (6,317,162) (6,759,363)
+/-Clean Surplus Plug (Ignore) (469) 0 0 0 0000000000000000000000000
=Cash From Financing 134,412 505,446 1,979,213 841,125 (966,278) (161,202) (210,605) (414,103) (697,880) (750,896) (989,117) (1,345,482) (1,757,250) (2,342,321) (2,374,775) (2,541,009) (2,718,880) (2,909,201) (3,112,845) (3,330,744) (3,563,896) (3,813,369) (4,080,305) (4,365,926) (4,671,541) (4,998,549) (5,348,448) (5,722,839) (6,123,438)
Net Change in Cash 119,127 248,070 332,743 394,334 (1,100,522) 0 0 0 0 0 0 0 0 0 0 0 0 0 0 0 0 0 0 0 0 0 0 0 0
+ Beginning Cash Balance 6,248 125,375 373,445 706,188 1,100,522 0 0 0 0 0 0 0 0 0 0 0 0 0 0 0 0 0 0 0 0 0 0 0 0
= Ending Cash Balance 125,375 373,445 706,188 1,100,522 0000000000000000000000000
Net Income (31,020) (124,546) (719,968) (1,411,273) (688,034) (54,239) 96,135 269,470 523,691 549,912 767,755 1,086,929 1,515,321 2,086,100 2,213,404 2,368,342 2,534,126 2,711,515 2,901,321 3,104,413 3,321,722 3,554,242 3,803,039 4,069,252 4,354,100 4,658,887 4,985,009 5,333,960 5,707,337
– Increase in Common Equity (25,196) (110,154) (127,533) 1,233,529 176,747 342,860 272,903 327,686 392,841 470,127 561,543 669,203 754,838 892,488 407,994 436,554 467,112 499,810 534,797 572,233 612,289 655,149 701,010 750,080 802,586 858,767 918,881 983,203 1,052,027
+/-Clean Surplus Plug (Ignore) (469) 0 0 0 0000000000000000000000000
=Free Cash Flow to Common Equity (56,685) (234,700) (847,501) (177,744) (511,287) 288,622 369,037 597,156 916,532 1,020,040 1,329,298 1,756,132 2,270,160 2,978,588 2,621,398 2,804,896 3,001,238 3,211,325 3,436,118 3,676,646 3,934,011 4,209,392 4,504,049 4,819,333 5,156,686 5,517,654 5,903,890 6,317,162 6,759,363
Computation based on SCF:
+Cash From Operations (4,281) (2,706) (196,609) (725,892) (447,431) 298,211 371,163 588,041 890,215 970,409 1,250,442 1,639,472 2,104,322 2,750,641 2,736,706 2,928,275 3,133,254 3,352,582 3,587,263 3,838,371 4,107,057 4,394,552 4,702,170 5,031,322 5,383,515 5,760,361 6,163,586 6,595,037 7,056,689
-Increase in Operating Cash (119,127) (248,070) (332,743) (394,334) 1,100,522 0 0 0 0 0 0 0 0 0 0 0 0 0 0 0 0 0 0 0 0 0 0 0 0
+Cash From Investing (11,004) (254,670) (1,449,861) 279,101 313,187 (137,009) (160,558) (173,938) (192,335) (219,513) (261,325) (293,990) (347,072) (408,320) (361,931) (387,266) (414,375) (443,381) (474,418) (507,627) (543,161) (581,182) (621,865) (665,396) (711,973) (761,811) (815,138) (872,198) (933,252)
+Increase in Debt 78,202 270,746 1,131,712 663,381 (1,477,566) 127,420 158,432 183,054 218,653 269,143 340,181 410,650 512,909 636,268 246,623 263,887 282,359 302,124 323,272 345,901 370,115 396,023 423,744 453,406 485,145 519,105 555,442 594,323 635,926
-Dividends Paid on Preferred 00000000000000000000000000000
+Increase in Preferred Stock (6) 0 0 0 0000000000000000000000000
+/-Clean Surplus Plug (Ignore) (469) 0 0 0 0000000000000000000000000
=Free Cash Flow to Common Equity (56,685) (234,700) (847,501) (177,744) (511,287) 288,622 369,037 597,156 916,532 1,020,040 1,329,298 1,756,132 2,270,160 2,978,588 2,621,398 2,804,896 3,001,238 3,211,325 3,436,118 3,676,646 3,934,011 4,209,392 4,504,049 4,819,333 5,156,686 5,517,654 5,903,890 6,317,162 6,759,363
= Free Cash Flow to Common Equity (56,685) (234,700) (847,501) (177,744) (511,287) 288,622 369,037 597,156 916,532 1,020,040 1,329,298 1,756,132 2,270,160 2,978,588 2,621,398 2,804,896 3,001,238 3,211,325 3,436,118 3,676,646 3,934,011 4,209,392 4,504,049 4,819,333 5,156,686 5,517,654 5,903,890 6,317,162 6,759,363
Free Cash Flow to all Investors
Net Operating Income -30,694 -97,907 -635,402 -1,280,352 -579,126 2,351 163,801 350,369 620,156 630,669 862,261 1,201,219 1,653,947 2,255,006 2,405,574 2,573,964 2,754,142 2,946,932 3,153,217 3,373,942 3,610,118 3,862,826 4,133,224 4,422,550 4,732,128 5,063,377 5,417,813 5,797,060 6,202,855
– Increase in Net Operating Assets (103,392) (380,900) (1,259,245) 570,148 1,654,312 215,440 114,470 144,632 174,188 200,984 221,362 258,553 241,929 256,220 161,371 172,667 184,754 197,687 211,525 226,331 242,175 259,127 277,266 296,674 317,441 339,662 363,439 388,879 416,101
+Interest Expense 326 26,639 84,566 130,921 108,908 56,589 67,666 80,899 96,465 115,367 138,978 168,073 203,861 248,391 282,603 302,386 323,553 346,201 370,436 396,366 424,112 453,799 485,565 519,555 555,924 594,838 636,477 681,031 728,703
-Tax Shield on Interest 00000 0 0 0 0 (34,610) (44,473) (53,783) (65,235) (79,485) (90,433) (96,763) (103,537) (110,784) (118,539) (126,837) (135,716) (145,216) (155,381) (166,258) (177,896) (190,348) (203,673) (217,930) (233,185)
+/-Clean Surplus Plug (Ignore) (469) 0 0 0 0000000000000000000000000
=Free Cash Flow to Investors (134,555) (478,807) (1,894,647) (710,204) 1,075,186 217,791 278,271 495,001 794,344 831,653 1,083,622 1,459,772 1,895,876 2,511,227 2,566,945 2,746,631 2,938,895 3,144,618 3,364,741 3,600,273 3,852,292 4,121,953 4,410,490 4,719,224 5,049,569 5,403,039 5,781,252 6,185,940 6,618,956
-Net Issuance of Preferred Stock 60000000000000000000000000000
=Free Cash Flow to Investors (134,555) (478,807) (1,894,647) (710,204) 1,075,186 217,791 278,271 495,001 794,344 831,653 1,083,622 1,459,772 1,895,876 2,511,227 2,566,945 2,746,631 2,938,895 3,144,618 3,364,741 3,600,273 3,852,292 4,121,953 4,410,490 4,719,224 5,049,569 5,403,039 5,781,252 6,185,940 6,618,956
+Minority Interest in Earnings 00000000000000000000000000000
+Non-Operating Income (Loss) 690 8,629 8,432 (336,984) (410,983) 0 0 0 0 0 0 0 0 0 0 0 0 0 0 0 0 0 0 0 0 0 0 0 0
+Other Income (Loss) 0 (2,905) (76,769) (304,596) 0000000000000000000000000
+Ext. Items & Disc. Ops. 00000000000000000000000000000
=Gross Cash Flow (30,694) (55,308) (420,708) (874,120) (458,838) 93,255 267,567 468,242 752,532 779,389 1,031,358 1,394,441 1,875,460 2,511,227 2,690,440 2,878,771 3,080,285 3,295,905 3,526,618 3,773,481 4,037,625 4,320,259 4,622,677 4,946,264 5,292,502 5,662,978 6,059,386 6,483,543 6,937,391
-Increase in W orking Capital (92,388) (168,829) (24,078) (115,185) 1,220,837 261,545 171,262 200,697 234,147 271,777 313,589 359,321 367,488 408,320 238,436 255,127 272,986 292,095 312,541 334,419 357,829 382,877 409,678 438,355 469,040 501,873 537,004 574,595 614,816
-Capital Expenditures (8,741) (62,664) (502,516) (455,035) (94,437) (137,009) (160,558) (173,938) (192,335) (219,513) (261,325) (293,990) (347,072) (408,320) (361,931) (387,266) (414,375) (443,381) (474,418) (507,627) (543,161) (581,182) (621,865) (665,396) (711,973) (761,811) (815,138) (872,198) (933,252)
-Increase in Investments 0 (7,740) (363,722) 279,212 92,250000000000000000000000000
=Free Cash Flow to Investors (134,555) (478,807) (1,894,647) (710,204) 1,075,186 217,791 278,271 495,001 794,344 831,653 1,083,622 1,459,772 1,895,876 2,511,227 2,566,945 2,746,631 2,938,895 3,144,618 3,364,741 3,600,273 3,852,292 4,121,953 4,410,490 4,719,224 5,049,569 5,403,039 5,781,252 6,185,940 6,618,956
Pro Forma Statement of Cash Flows
Free Cash Flow to Common Equity
Forecasting Assumptions
Company Name AMAZON COM INC
Forecast Horizon 10 Years TERMINAL
Estimated Price/Share=$14.98 YEAR
Actual Actual Actual Actual Actual Forecast Forecast Forecast Forecast Forecast Forecast Forecast Forecast Forecast Forecast Forecast Forecast Forecast Forecast Forecast Forecast Forecast Forecast Forecast Forecast Forecast Forecast Forecast Forecast Forecast
Fiscal Year End Date 12/31/1996 12/31/1997 12/31/1998 12/31/1999 12/31/2000 12/31/2001 12/31/2002 12/31/2003 12/31/2004 12/31/2005 12/31/2006 12/31/2007 12/31/2008 12/31/2009 12/31/2010 12/31/2011 12/31/2012 12/31/2013 12/31/2014 12/31/2015 12/31/2016 12/31/2017 12/31/2018 12/31/2019 12/31/2020 12/31/2021 12/31/2022 12/31/2023 12/31/2024 12/31/2025
Implied Return on Equity (1.940) (1.489) (3.555) 4.027 0.652 0.041 (0.059) (0.140) (0.229) (0.203) (0.238) (0.283) (0.332) (0.388) (0.367) (0.367) (0.367) (0.367) (0.367) (0.367) (0.367) (0.367) (0.367) (0.367) (0.367) (0.367) (0.367) (0.367) (0.367)
Income Statement Assumptions
Sales Growth 838.6% 312.6% 168.9% 68.4% 24.0% 25.0% 25.0% 25.0% 25.0% 25.0% 25.0% 25.0% 25.0% 25.0% 7.0% 7.0% 7.0% 7.0% 7.0% 7.0% 7.0% 7.0% 7.0% 7.0% 7.0% 7.0% 7.0% 7.0% 7.0%
Cost of Goods Sold/Sales 78.0% 80.5% 78.1% 82.3% 76.3% 76.3% 76.3% 76.3% 76.3% 76.3% 76.3% 76.3% 76.3% 76.3% 76.3% 76.3% 76.3% 76.3% 76.3% 76.3% 76.3% 76.3% 76.3% 76.3% 76.3% 76.3% 76.3% 76.3% 76.3% 76.3%
R&D/Sales 15.2% 0.0% 0.0% 0.0% 0.0% 0.0% 0.0% 0.0% 0.0% 0.0% 0.0% 0.0% 0.0% 0.0% 0.0% 0.0% 0.0% 0.0% 0.0% 0.0% 0.0% 0.0% 0.0% 0.0% 0.0% 0.0% 0.0% 0.0% 0.0% 0.0%
SG&A/Sales 47.6% 40.7% 31.9% 39.2% 32.2% 25.1% 21.6% 18.7% 16.7% 14.7% 13.7% 12.7% 11.7% 10.7% 9.7% 9.7% 9.7% 9.7% 9.7% 9.7% 9.7% 9.7% 9.7% 9.7% 9.7% 9.7% 9.7% 9.7% 9.7% 9.7%
Dep&Amort/Avge PP&E and Intang. 0.0% 39.1% 34.2% 48.7% 25.0% 25.0% 25.0% 25.0% 25.0% 25.0% 25.0% 25.0% 25.0% 25.0% 25.0% 25.0% 25.0% 25.0% 25.0% 25.0% 25.0% 25.0% 25.0% 25.0% 25.0% 25.0% 25.0% 25.0% 25.0%
Interest Expense/Avge Debt 0.8% 12.5% 9.2% 7.2% 7.8% 7.8% 7.8% 7.8% 7.8% 7.8% 7.8% 7.8% 7.8% 7.8% 7.8% 7.8% 7.8% 7.8% 7.8% 7.8% 7.8% 7.8% 7.8% 7.8% 7.8% 7.8% 7.8% 7.8% 7.8%
Non-Operating Income/Sales 1.3% 0.5% 1.4% 0.5% -12.2% -12.0% 0.0% 0.0% 0.0% 0.0% 0.0% 0.0% 0.0% 0.0% 0.0% 0.0% 0.0% 0.0% 0.0% 0.0% 0.0% 0.0% 0.0% 0.0% 0.0% 0.0% 0.0% 0.0% 0.0% 0.0%
Effective Tax Rate 0.0% 0.0% 0.0% 0.0% 0.0% 0.0% 0.0% 0.0% 0.0% 0.0% 30.0% 32.0% 32.0% 32.0% 32.0% 32.0% 32.0% 32.0% 32.0% 32.0% 32.0% 32.0% 32.0% 32.0% 32.0% 32.0% 32.0% 32.0% 32.0% 32.0%
Minority Interest/After Tax Income 0.0% 0.0% 0.0% 0.0% 0.0% 0.0% 0.0% 0.0% 0.0% 0.0% 0.0% 0.0% 0.0% 0.0% 0.0% 0.0% 0.0% 0.0% 0.0% 0.0% 0.0% 0.0% 0.0% 0.0% 0.0% 0.0% 0.0% 0.0% 0.0% 0.0%
Other Income/Sales 0.0% 0.0% -0.5% -4.7% -11.0% 0.0% 0.0% 0.0% 0.0% 0.0% 0.0% 0.0% 0.0% 0.0% 0.0% 0.0% 0.0% 0.0% 0.0% 0.0% 0.0% 0.0% 0.0% 0.0% 0.0% 0.0% 0.0% 0.0% 0.0% 0.0%
Ext. Items & Disc. Ops./Sales 0.0% 0.0% 0.0% 0.0% 0.0% 0.0% 0.0% 0.0% 0.0% 0.0% 0.0% 0.0% 0.0% 0.0% 0.0% 0.0% 0.0% 0.0% 0.0% 0.0% 0.0% 0.0% 0.0% 0.0% 0.0% 0.0% 0.0% 0.0% 0.0% 0.0%
Pref. Dividends/Avge Pref. Stock 0.0% 0.0% 0.0% 0.0% 0.0% 0.0% 0.0% 0.0% 0.0% 0.0% 0.0% 0.0% 0.0% 0.0% 0.0% 0.0% 0.0% 0.0% 0.0% 0.0% 0.0% 0.0% 0.0% 0.0% 0.0% 0.0% 0.0% 0.0% 0.0%
Balance Sheet Assumptions:
Working Capital Assumptions
Ending Operating Cash/Sales 39.7% 84.8% 61.2% 43.1% 39.8% 0.0% 0.0% 0.0% 0.0% 0.0% 0.0% 0.0% 0.0% 0.0% 0.0% 0.0% 0.0% 0.0% 0.0% 0.0% 0.0% 0.0% 0.0% 0.0% 0.0% 0.0% 0.0% 0.0% 0.0% 0.0%
Ending Receivables/Sales 0.0% 0.0% 0.0% 0.0% 0.0% 0.0% 0.0% 0.0% 0.0% 0.0% 0.0% 0.0% 0.0% 0.0% 0.0% 0.0% 0.0% 0.0% 0.0% 0.0% 0.0% 0.0% 0.0% 0.0% 0.0% 0.0% 0.0% 0.0% 0.0% 0.0%
Ending Inventories/COGS 4.6% 7.5% 6.2% 16.4% 8.3% 8.3% 8.3% 8.3% 8.3% 8.3% 8.3% 8.3% 8.3% 8.3% 8.3% 8.3% 8.3% 8.3% 8.3% 8.3% 8.3% 8.3% 8.3% 8.3% 8.3% 8.3% 8.3% 8.3% 8.3% 8.3%
Ending Other Current Assets/Sales 2.0% 2.3% 3.5% 4.9% 3.1% 3.1% 3.1% 3.1% 3.1% 3.1% 3.1% 3.1% 3.1% 3.1% 3.1% 3.1% 3.1% 3.1% 3.1% 3.1% 3.1% 3.1% 3.1% 3.1% 3.1% 3.1% 3.1% 3.1% 3.1% 3.1%
Ending Accounts Payable/COGS 23.2% 27.8% 23.8% 34.3% 23.0% 23.0% 23.0% 23.0% 23.0% 23.0% 23.0% 23.0% 23.0% 23.0% 23.0% 23.0% 23.0% 23.0% 23.0% 23.0% 23.0% 23.0% 23.0% 23.0% 23.0% 23.0% 23.0% 23.0% 23.0% 23.0%
Ending Taxes Payable/Sales 0.0% 0.0% 0.0% 0.0% 0.0% 0.0% 0.0% 0.0% 0.0% 0.0% 0.0% 0.0% 0.0% 0.0% 0.0% 0.0% 0.0% 0.0% 0.0% 0.0% 0.0% 0.0% 0.0% 0.0% 0.0% 0.0% 0.0% 0.0% 0.0% 0.0%
Ending Other Current Liabs/Sales 12.8% 6.8% 7.8% 15.6% 17.1% 15.7% 17.1% 15.2% 13.6% 12.0% 10.6% 9.2% 8.0% 6.5% 5.2% 5.2% 5.2% 5.2% 5.2% 5.2% 5.2% 5.2% 5.2% 5.2% 5.2% 5.2% 5.2% 5.2% 5.2% 5.2%
Other Operating Asset Assumptions
Ending Net PP&E/Sales 6.3% 6.6% 4.9% 19.4% 13.3% 9.9% 9.0% 8.3% 7.5% 6.7% 6.0% 5.5% 5.0% 4.6% 4.3% 4.3% 4.3% 4.3% 4.3% 4.3% 4.3% 4.3% 4.3% 4.3% 4.3% 4.3% 4.3% 4.3% 4.3% 4.3%
Ending Investments/Sales 0.0% 0.0% 1.3% 22.7% 3.3% 0.0% 0.0% 0.0% 0.0% 0.0% 0.0% 0.0% 0.0% 0.0% 0.0% 0.0% 0.0% 0.0% 0.0% 0.0% 0.0% 0.0% 0.0% 0.0% 0.0% 0.0% 0.0% 0.0% 0.0% 0.0%
Ending Intangibles/Sales 0.0% 0.0% 29.3% 44.5% 9.2% 0.0% 0.0% 0.0% 0.0% 0.0% 0.0% 0.0% 0.0% 0.0% 0.0% 0.0% 0.0% 0.0% 0.0% 0.0% 0.0% 0.0% 0.0% 0.0% 0.0% 0.0% 0.0% 0.0% 0.0% 0.0%
Ending Other Assets/Sales 0.9% 1.6% 1.3% 2.4% 2.2% 0.0% 0.0% 0.0% 0.0% 0.0% 0.0% 0.0% 0.0% 0.0% 0.0% 0.0% 0.0% 0.0% 0.0% 0.0% 0.0% 0.0% 0.0% 0.0% 0.0% 0.0% 0.0% 0.0% 0.0% 0.0%
Other Operating Liability Assumptions
Other Liabilities/Sales 0.0% 0.0% 0.0% 0.0% 0.0% 0.0% 0.0% 0.0% 0.0% 0.0% 0.0% 0.0% 0.0% 0.0% 0.0% 0.0% 0.0% 0.0% 0.0% 0.0% 0.0% 0.0% 0.0% 0.0% 0.0% 0.0% 0.0% 0.0% 0.0% 0.0%
Deferred Taxes/Sales 0.0% 0.0% 0.0% 0.0% 0.0% 0.0% 0.0% 0.0% 0.0% 0.0% 0.0% 0.0% 0.0% 0.0% 0.0% 0.0% 0.0% 0.0% 0.0% 0.0% 0.0% 0.0% 0.0% 0.0% 0.0% 0.0% 0.0% 0.0% 0.0% 0.0%
Financing Assumptions
Current Debt/Total Assets 0.0% 1.0% 0.1% 0.6% 0.8% 0.8% 0.8% 0.8% 0.8% 0.8% 0.8% 0.8% 0.8% 0.8% 0.8% 0.8% 0.8% 0.8% 0.8% 0.8% 0.8% 0.8% 0.8% 0.8% 0.8% 0.8% 0.8% 0.8% 0.8% 0.8%
Long-Term Debt/Total Assets 0.0% 51.2% 53.7% 59.5% 99.6% 99.6% 99.6% 99.6% 99.6% 99.6% 99.6% 99.6% 99.6% 99.6% 99.6% 99.6% 99.6% 99.6% 99.6% 99.6% 99.6% 99.6% 99.6% 99.6% 99.6% 99.6% 99.6% 99.6% 99.6% 99.6%
Minority Interest/Total Assets 0.0% 0.0% 0.0% 0.0% 0.0% 0.0% 0.0% 0.0% 0.0% 0.0% 0.0% 0.0% 0.0% 0.0% 0.0% 0.0% 0.0% 0.0% 0.0% 0.0% 0.0% 0.0% 0.0% 0.0% 0.0% 0.0% 0.0% 0.0% 0.0% 0.0%
Preferred Stock/Total Assets 0.1% 0.0% 0.0% 0.0% 0.0% 0.0% 0.0% 0.0% 0.0% 0.0% 0.0% 0.0% 0.0% 0.0% 0.0% 0.0% 0.0% 0.0% 0.0% 0.0% 0.0% 0.0% 0.0% 0.0% 0.0% 0.0% 0.0% 0.0% 0.0% 0.0%
Dividend Payout Ratio 0.0% 0.0% 0.0% 0.0% 0.0% 0.0% 0.0% 0.0% 0.0% 0.0% 0.0% 0.0% 0.0% 0.0% 0.0% 0.0% 0.0% 0.0% 0.0% 0.0% 0.0% 0.0% 0.0% 0.0% 0.0% 0.0% 0.0% 0.0% 0.0% 0.0%
Ratio Analysis Graphs
(4.000)
(3.000)
(2.000)
(1.000)
0.000
1.000
2.000
3.000
4.000
5.000
1996 1997 1998 1999 2000 2001 2002 2003 2004 2005 2006 2007 2008 2009 2010 2011 2012 2013 2014 2015 2016 2017 2018 2019 2020 2021
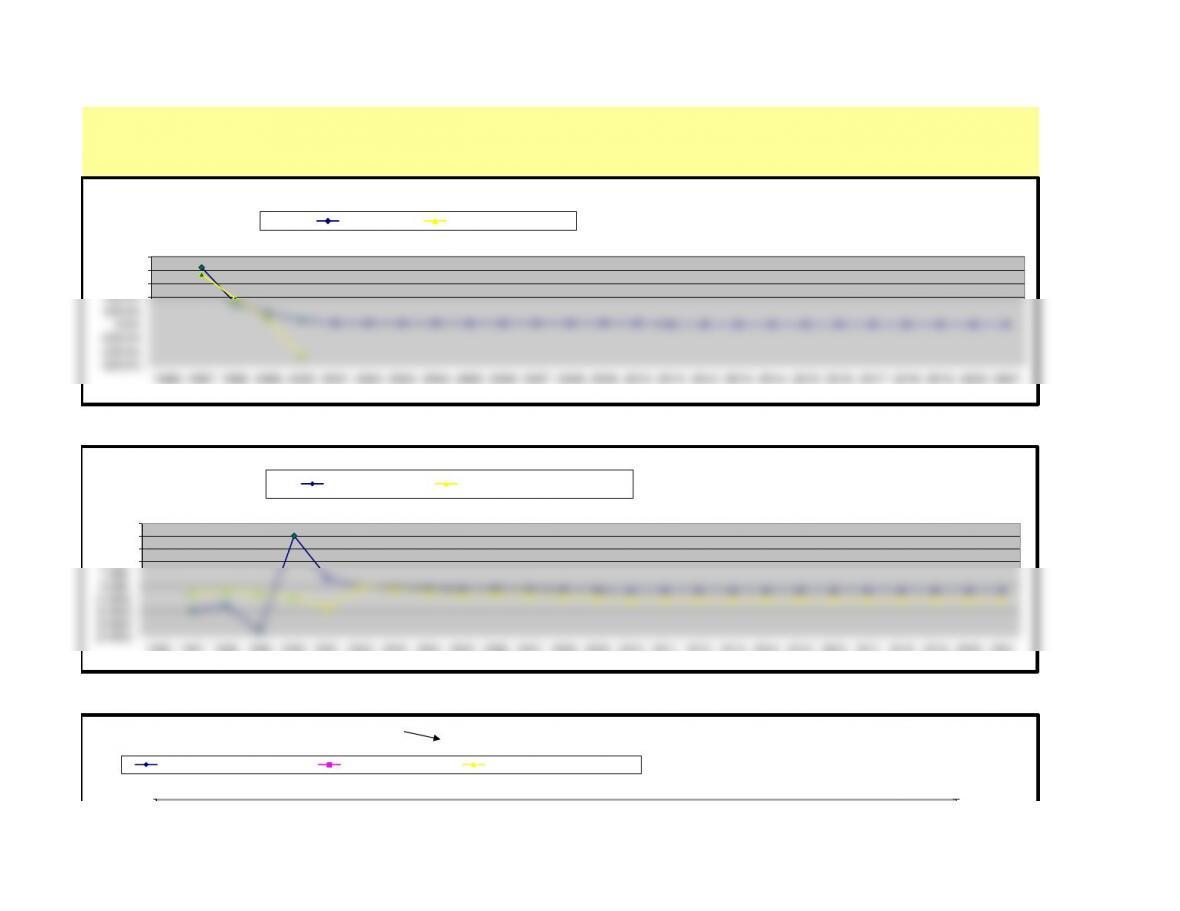
Profitability Analysis
Return on Equity Return on Net Operating Assets
actual
forecast
150.5
gin
DuPont Analysis
Return on Net Operating Assets Net Operating Margin x Net Operating Asset Turnover
actual
forecast
(See right axis for scale of Asset Turnover)
-600.0%
-400.0%
-200.0%
0.0%
200.0%
400.0%
600.0%
800.0%
1000.0%
1996 1997 1998 1999 2000 2001 2002 2003 2004 2005 2006 2007 2008 2009 2010 2011 2012 2013 2014 2015 2016 2017 2018 2019 2020 2021
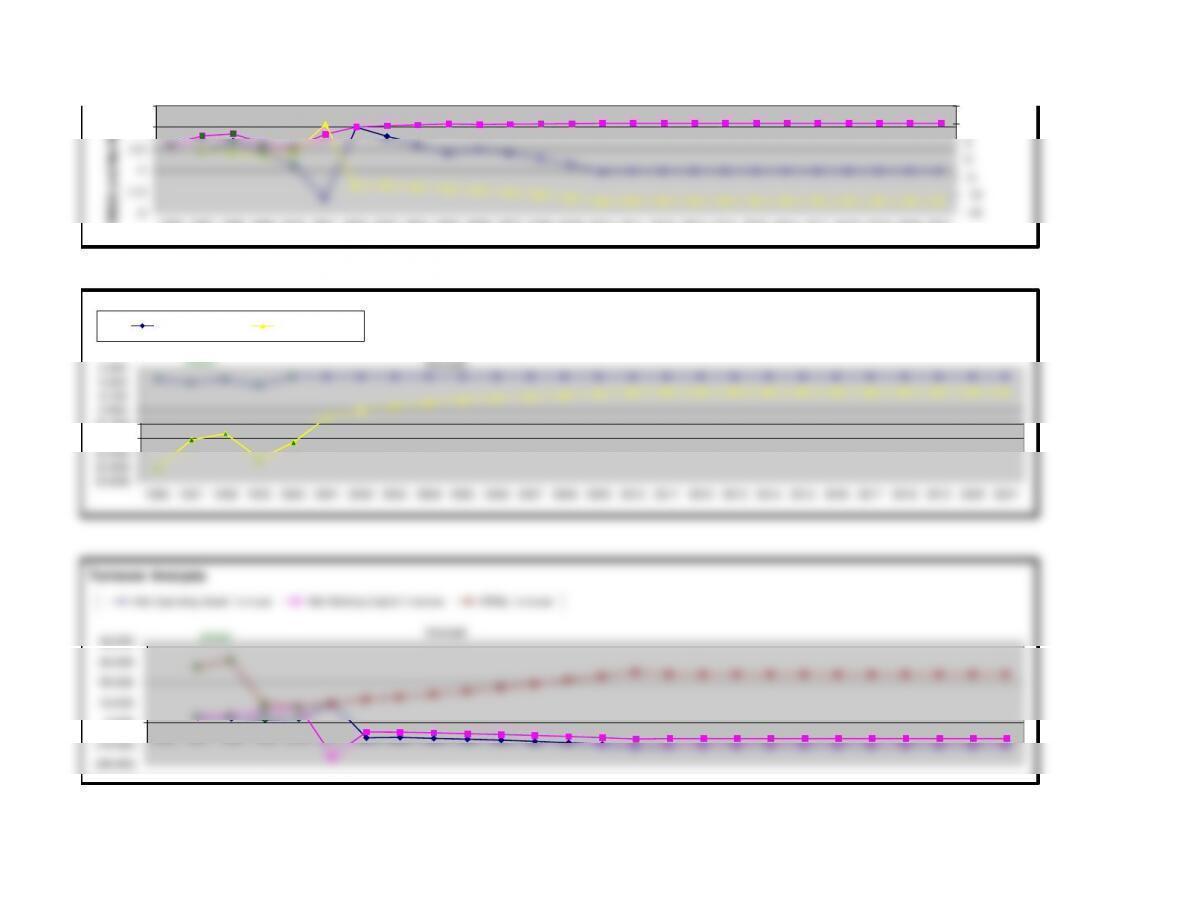
Growth Rates
Sales Common Equity
actual
forecast
-15
-10
-5
0
5
10
15
-2
-1.5
-1
-0.5
0
0.5
1996 1997 1998 1999 2000 2001 2002 2003 2004 2005 2006 2007 2008 2009 2010 2011 2012 2013 2014 2015 2016 2017 2018 2019 2020 2021
RNOA and Net Margin
(0.500)
(0.400)
(0.300)
(0.200)
(0.100)
0.000
0.100
0.200
0.300
1996 1997 1998 1999 2000 2001 2002 2003 2004 2005 2006 2007 2008 2009 2010 2011 2012 2013 2014 2015 2016 2017 2018 2019 2020 2021
Margin Analysis
Gross Margin EBIT Margin
actual
forecast
20.000
30.000
40.000
Turnover Analysis
Net Operating Asset Turnover Net Working Capital Turnover PP&E Turnover
actual
forecast
(4.000)
(2.000)
0.000
2.000
4.000
6.000
1996 1997 1998 1999 2000 2001 2002 2003 2004 2005 2006 2007 2008 2009 2010 2011 2012 2013 2014 2015 2016 2017 2018 2019 2020 2021
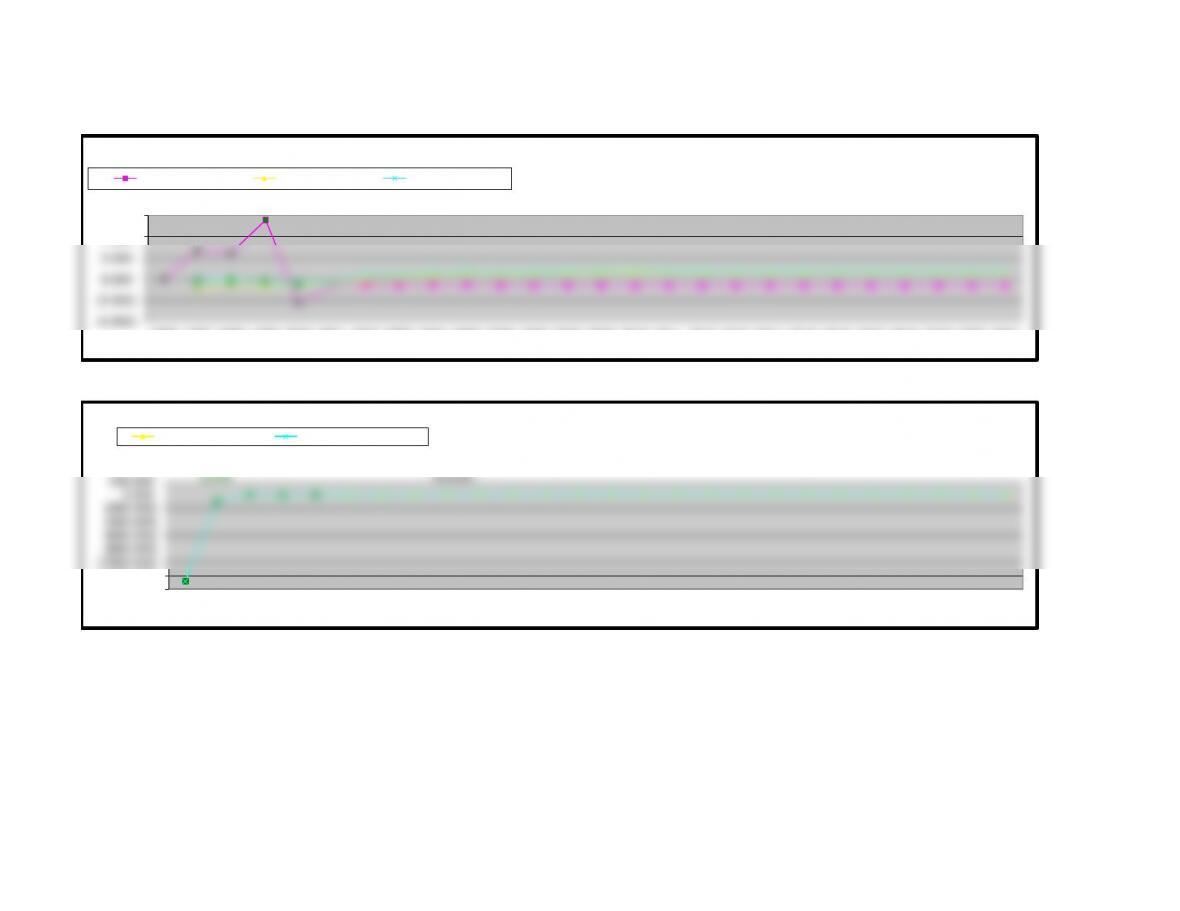
Analysis of Leverage – Capital Structure
Debt to Equity Ratio FFO to Total Debt CFO to Total Debt
actual
forecast
(1400.000)
(1200.000)
(1000.000)
(800.000)
(600.000)
(400.000)
(200.000)
0.000
200.000
1996 1997 1998 1999 2000 2001 2002 2003 2004 2005 2006 2007 2008 2009 2010 2011 2012 2013 2014 2015 2016 2017 2018 2019 2020 2021
Analysis of Leverage – Liquidity
EBIT Interest Coverage EBITDA Interest Coverage
actual
forecast