Price
Case of Beer (€) ((Euros)
50
10 MC
30
a
b
c
d
e
f
Chapter 7: Pricing with Market Power
PROFIT POTENTIAL FOR A MICROBREWERY
Discussion Question Answers:
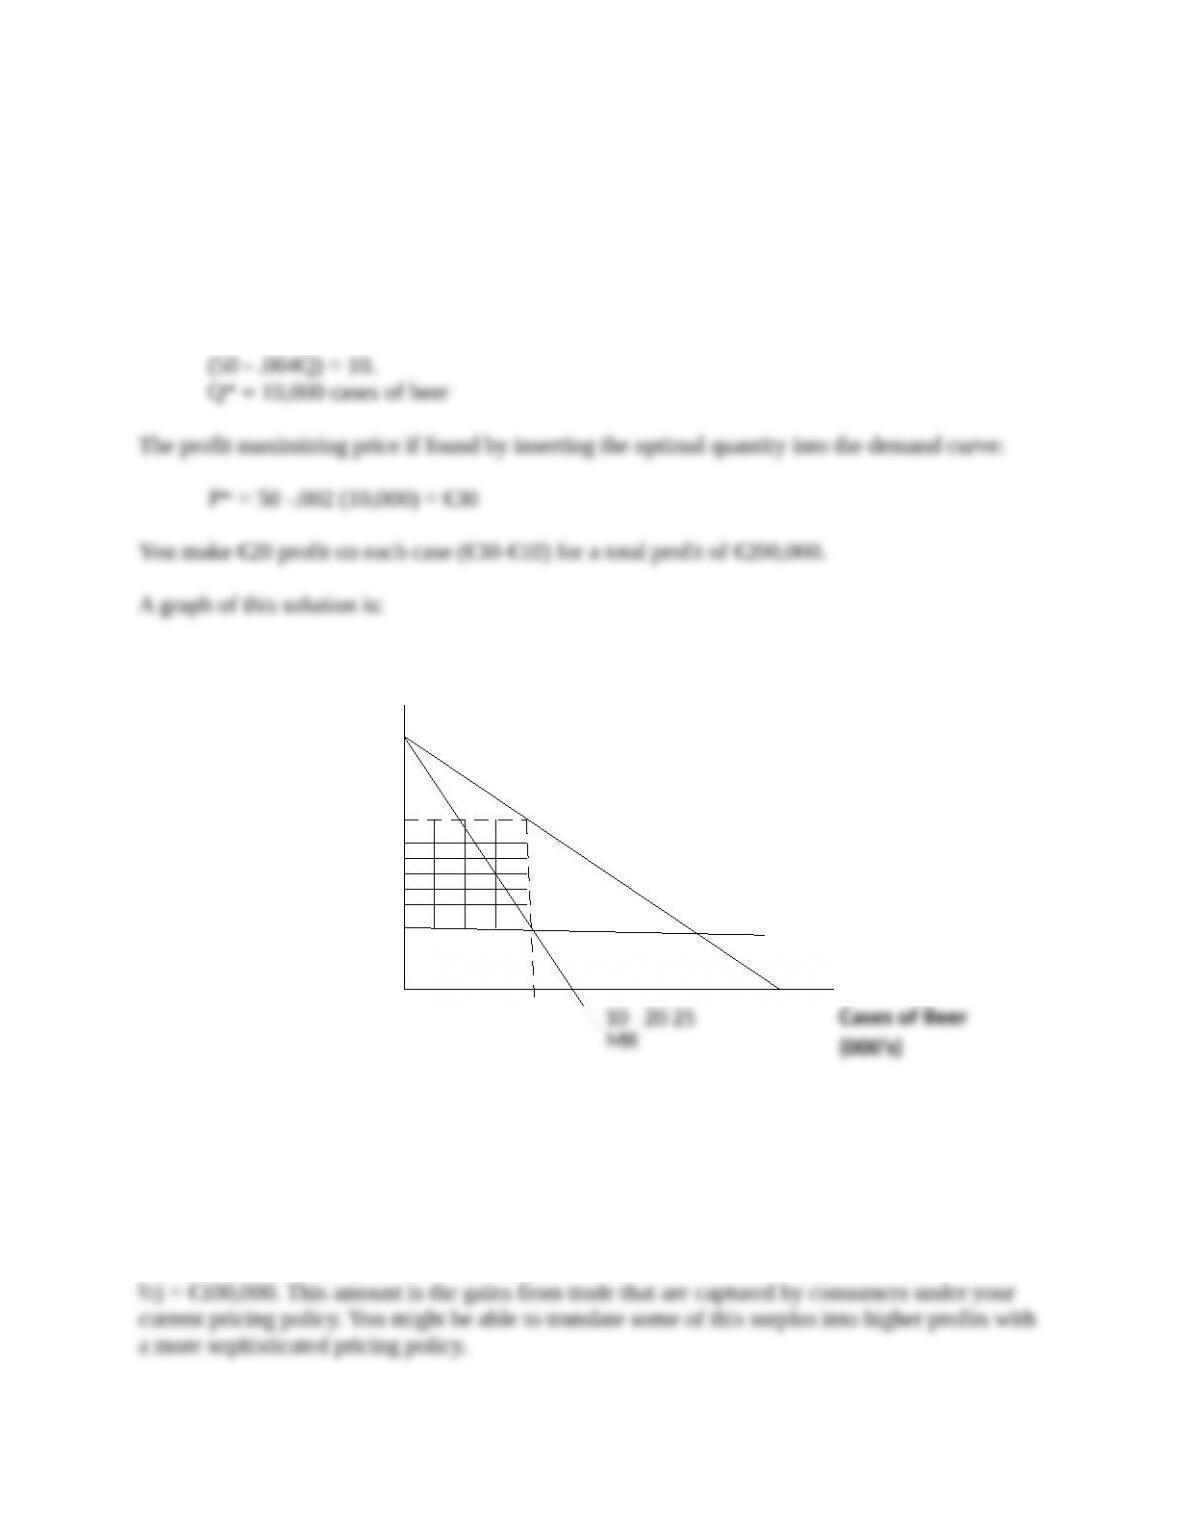
1. The profit maximizing quantity is found by setting marginal revenue equal to marginal cost:
2. The triangle at the top left of the graph labeled abc is consumer surplus. It represents the
difference between what consumers are willing to pay for the 10,000 cases and what they have to
pay. The area of a triangle is ½ base x height. Thus the total consumer surplus is (10,000 x 20 x
A
B
C
Price/Hr
Talk Time
5 10
3. The consumer surplus is not the only potential profits that you fail to capture. There is also
triangle def at the lower right of the graph. This triangle also has an area of €100,000. This is the
Your current profit of €200,000 is represented by the shaded rectangle. If you could devise a
pricing scheme to capture all of the potential profits you could earn a total of €400,000 (200,000
CELL PHONE PRICING
Discussion Question Answers:
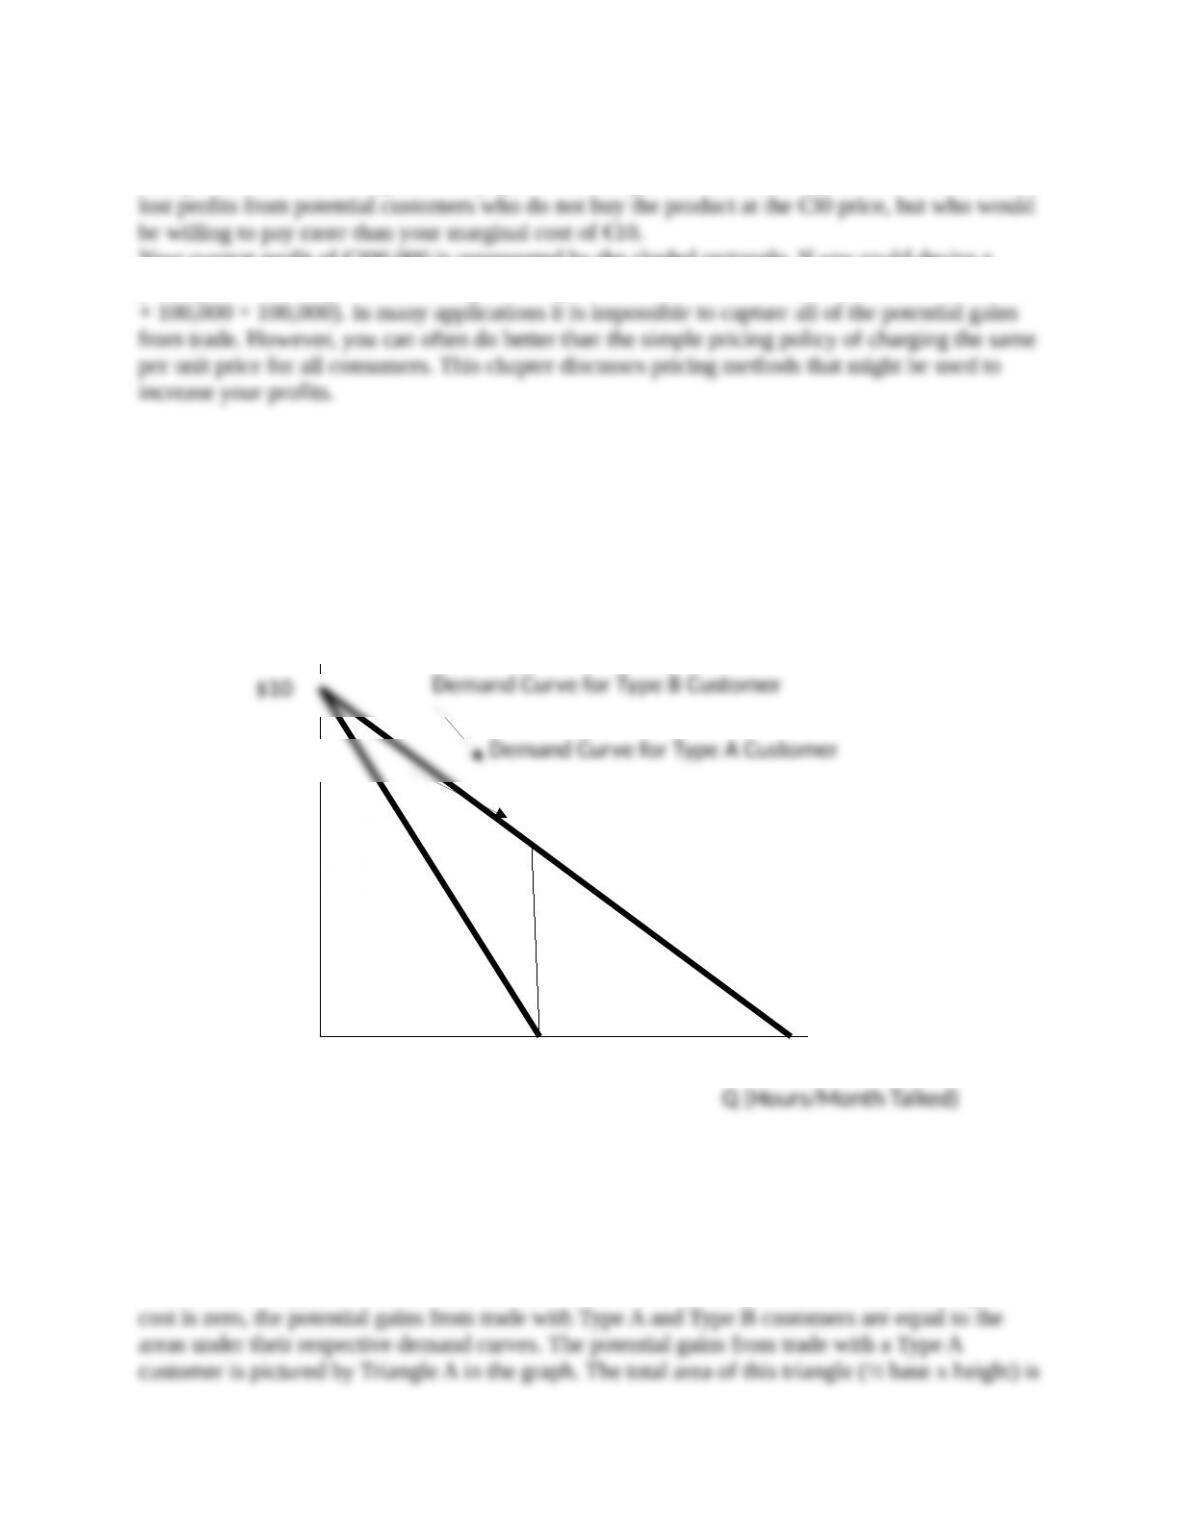
The problem is expressed graphically as follows:
1. The potential gains from trade in a transaction is the difference between the buyer’s maximum
willingness to pay for the product and the producer’s marginal cost. A demand curve displays the
consumers’ maximum willingness to pay for each unit of the product. Your customer base
consists of two types of customers (A & B) with different demand curves. Since your marginal
With a menu plan, Type B customers have the option to purchase the $25 plan. If they do, they
gain a surplus that is equal to the area of Triangle B. They must receive at least this much surplus
from any alternative plan or they will buy the $25 plan that was designed for the Type A
customers. To obtain additional profits you should offer a plan that allows the customer to talk 10
hours per month (the horizontal intercept for the Type B demand curve in the graph). You should
2. The total profits from offering the menu plan are $52,500 (i.e., $25,000 + $37,500). If you
were to use the simple pricing policy of charging a single price for each hour of talk time you
would do much worse. The optimal for each customer group is $5/hr. (this can be found by
3. If you charge more than $37.50 for the plan, the Type B customers will not buy the more
expensive plan, and you will make less profit. This application illustrates how a company can
sometimes increase its profits by offering a menu plan to potential customers who vary in their
price sensitivities for the product. With a menu plan customers self select based on their private
ITUNES MUSIC PRICING
Discussion Question Answers:
1. Different songs are likely to have varying demands, and thus the optimal price for each song
is not likely to be $1.29. Also, consumers differ in their willingness to pay for a given song, and
2. Apple has not priced a large number of songs at 69 cents. The ones they have priced at 69
cents have generally not been current hits with high demand. Rather they have tended to be
3. Students might have a wide range of suggestions. One simple strategy is to charge higher
prices for more popular songs. Suppose, for example, that the demands for two different songs
are independent and that the marginal cost for selling one more copy of either song is the same.
Suppose that both demand curves are linear with the same slope, but one has a y-intercept. A
4. As discussed in the case, some executives worry that a more sophisticated pricing policy
might scare people off. It might also motivate savvy consumer users to devise new ways to avoid
5. Apple cares about its overall profits from the sales of all products – not just the revenue from
downloaded music. For example, in 2014 less than 4% of Apple’s total revenues came from
music sales. Lower prices for Music Store songs, which are played on iPads, iPhones, Apple
6. At the time the case was written, Apple dominated the market for downloaded music.
Overtime, their market power and control over music pricing will decline. This decline will come
with increased competition from a variety of sources, such as Amazon, cell phone companies,