Managerial Economics and Organizational Architecture – Solutions Manual
Chapter 23: Organizational Architecture and the Process of Management Innovation
SOFTWARE DEVELOPMENT, INC.
Discussion Question Answers:
1. One often hears that “quality is free.” In fact a well-known quality expert has
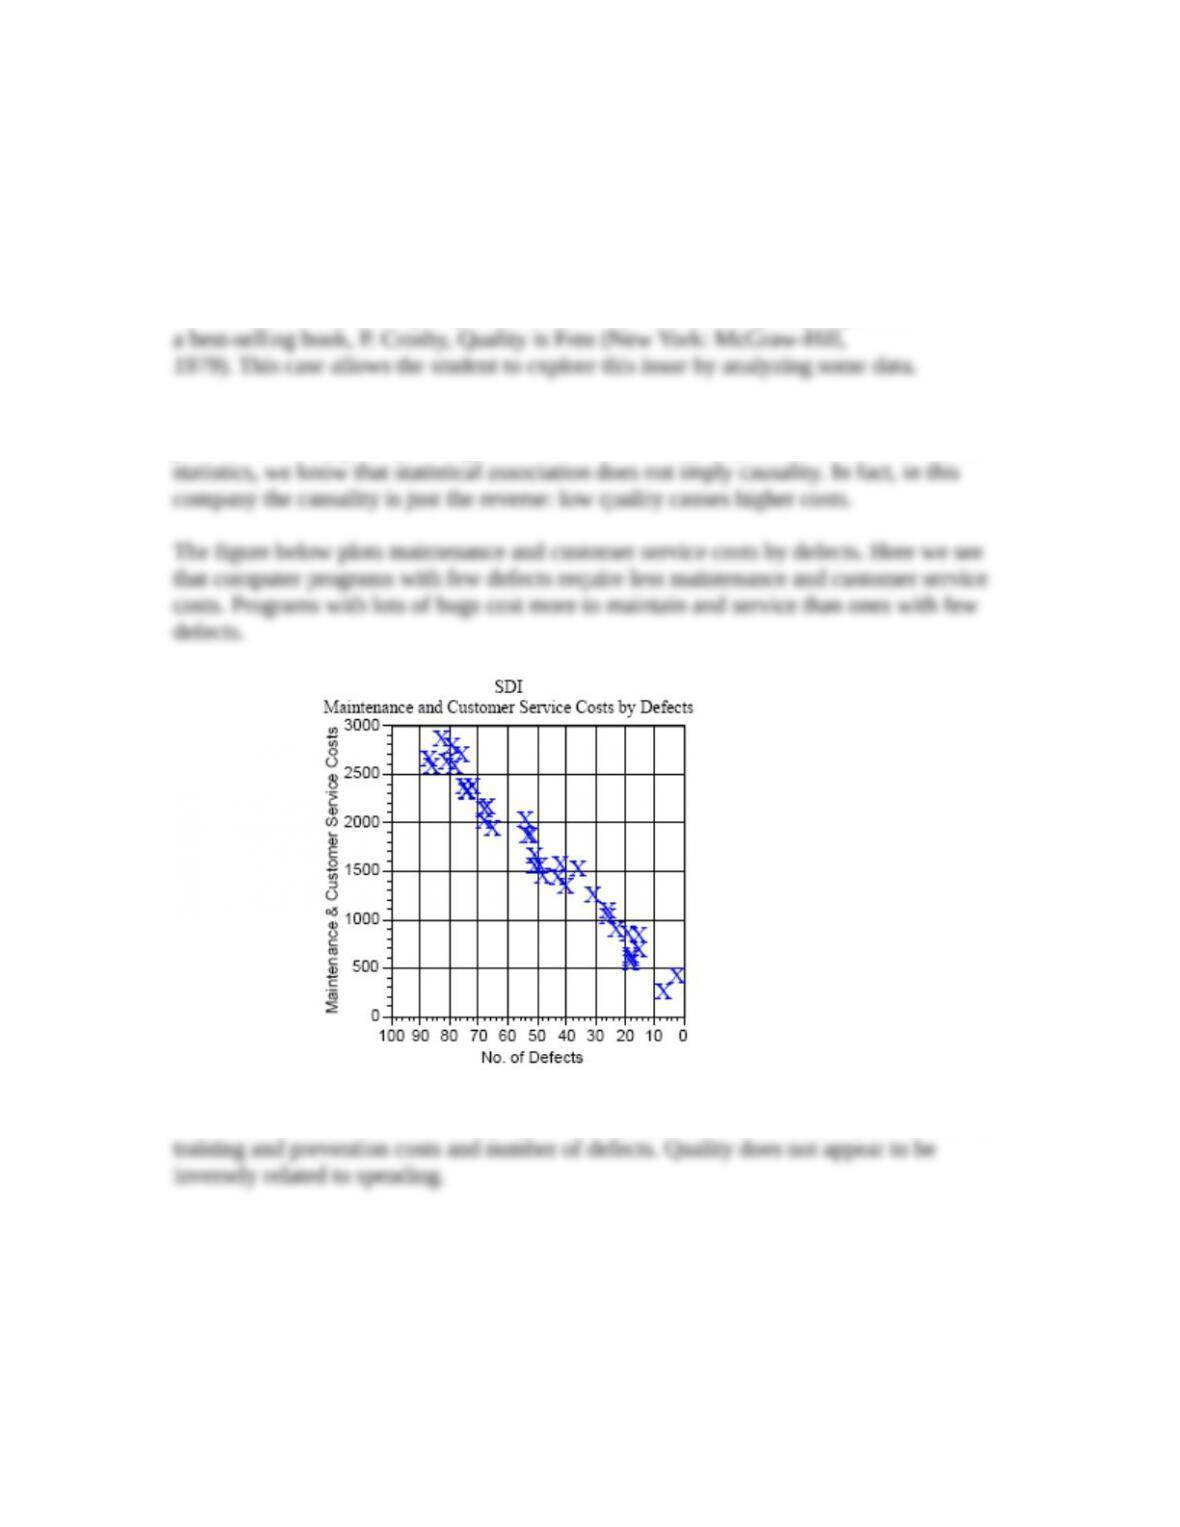
The VP’s conclusion is not supported by the data. The data plotted in the figure in the
problem certainly portrays a negative relation between quality and total costs. But from
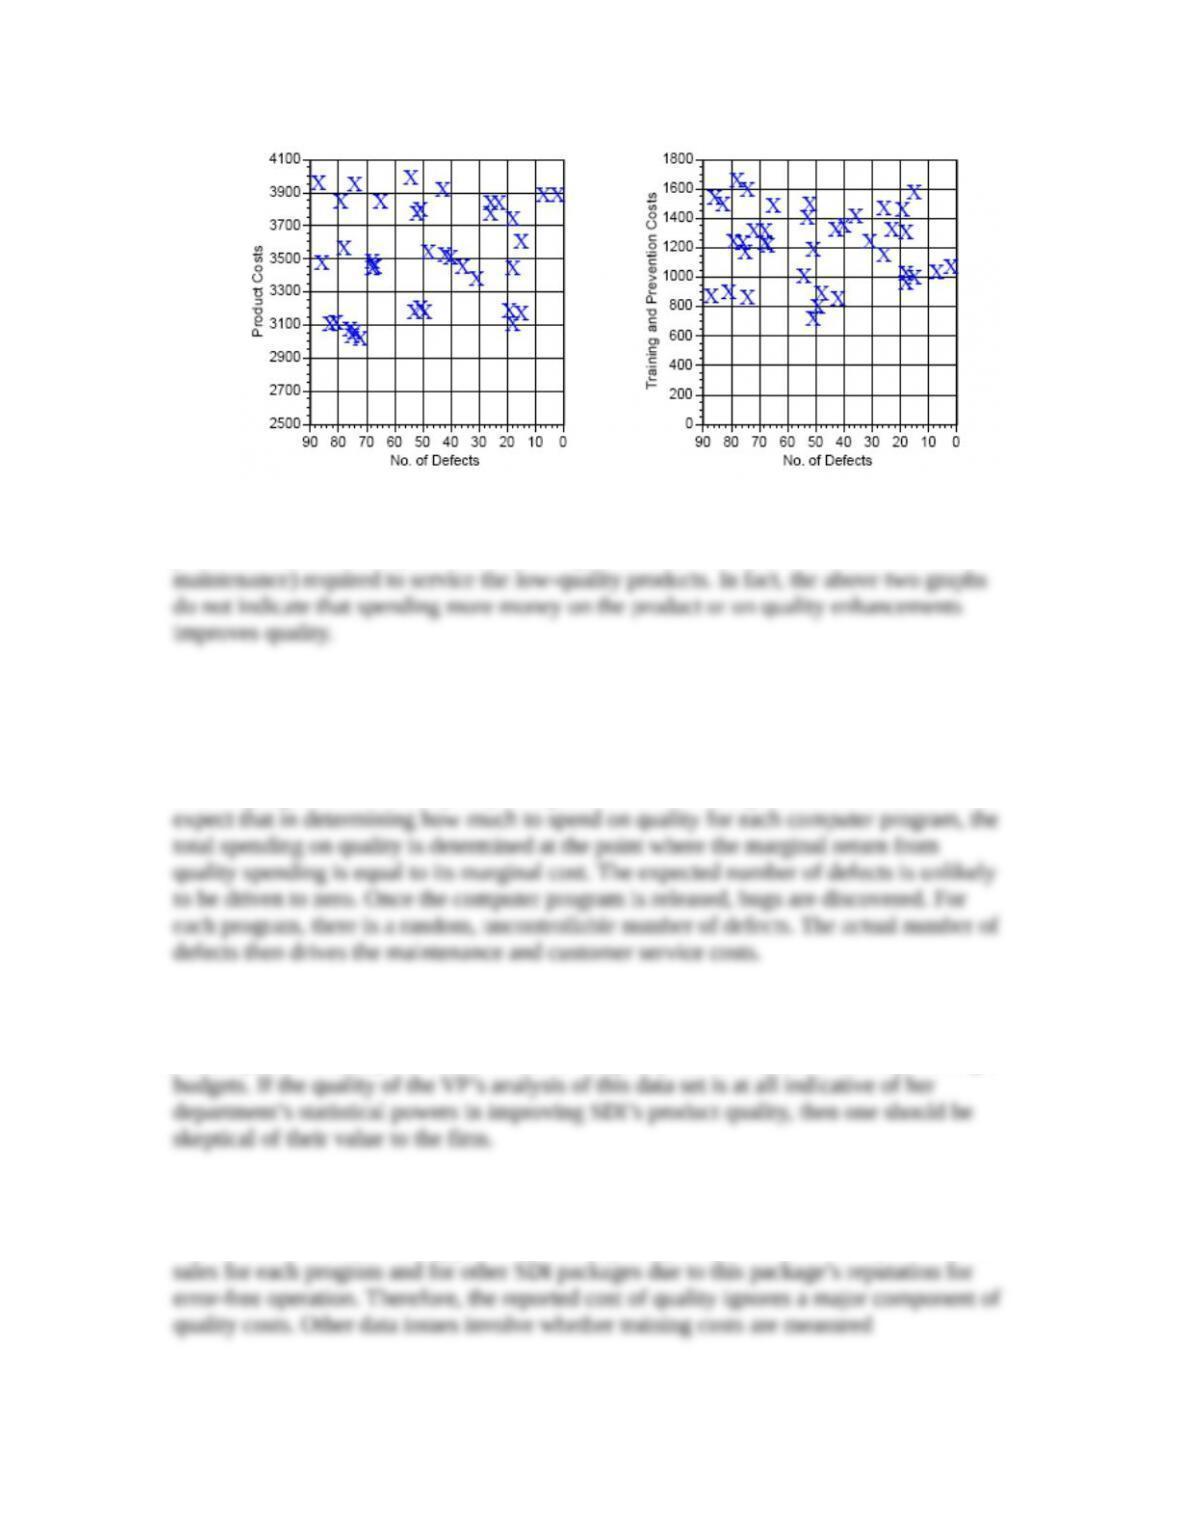
The next two figures plot product costs and training plus prevention costs by number of
defects. It is clear from these two graphs that there is no relation between product costs or
1
© 2016 by McGraw-Hill Education. This is proprietary material solely for authorized instructor use. Not authorized for sale or distribution in
any manner. This document may not be copied, scanned, duplicated, forwarded, distributed, or posted on a website, in whole or part.
Managerial Economics and Organizational Architecture – Solutions Manual
The downward-sloping relation between quality and costs observed in the figure in the
problem is induced solely because of the higher after-sale costs (customer service and
From the data presented, can one conclude that quality does not pay? Again, the answer is
no. The data presented is consistent with the need for SDI to optimize the amount spent
on quality for each software release. Presumably, for those computer programs for which
quality is expected to be a problem, SDI would spend more on training and prevention
than on programs for which quality is expected to be less of a problem. In fact, we would
The major point of this problem is to beware of causality statements based on statistical
tests of association. Associations (or the lack of them) do not prove (or disprove)
causality. It is certainly the case that the VP of quality has an incentive to lobby for larger
2. There are a number of problems with the VP’s analysis. One set of criticisms involves
the integrity of the data being used to reach the conclusion that quality pays. Clearly, SDI
does not track or report the opportunity cost of poor quality. SDI does not report the lost
2
© 2016 by McGraw-Hill Education. This is proprietary material solely for authorized instructor use. Not authorized for sale or distribution in
any manner. This document may not be copied, scanned, duplicated, forwarded, distributed, or posted on a website, in whole or part.

Managerial Economics and Organizational Architecture – Solutions Manual
3
© 2016 by McGraw-Hill Education. This is proprietary material solely for authorized instructor use. Not authorized for sale or distribution in
any manner. This document may not be copied, scanned, duplicated, forwarded, distributed, or posted on a website, in whole or part.