Module 25 – Using Visuals
Part 2: Answers to Textbook Assignments
Questions for Comprehension
25.1 How can you find stories in data? (LO 25-1)
25.2 What is the difference between a table and a figure? (LO 25-2)
25.3 What is chartjunk? (LO 25-4)
25.4 Why does each visual need to tell a story? (LO 25-1)
Dumps of uninterpreted data confuse and frustrate your audience; they undercut the credibility
25.5 Why are charts more memorable than tables? (LO 25-1)
© 2014 by McGraw-Hill Education. This is proprietary material solely for authorized instructor use. Not authorized for sale or distribution in any
manner. This document may not be copied, scanned, duplicated, forwarded, distributed, or posted on a website, in whole or part.
25-1
Module 25 – Using Visuals
25.6 When is chartjunk most likely to be acceptable? Why? (LO 25-4)
Chartjunk is most appropriate in presentation slides to an internal audience. Presentations to an
25.7 When is a truncated scale most likely to be acceptable? (LO 25-5)
Truncated graphs are most acceptable when the audience knows the basic data set well. For
25.8 Identifying Stories (LO 25-1)
1. Not a story
2. A simple story
25.9 Matching Visuals with Stories (LO 25-1)
1. Pie chart
2. Bar or line chart
25.10 Evaluating Visuals (LO 25-01 to LO 25-5)
1.
The pie chart does not have a title in the printed textbook.
Based on the segments and corresponding percentages shown in the chart, it’s unclear
© 2014 by McGraw-Hill Education. This is proprietary material solely for authorized instructor use. Not authorized for sale or distribution in any
manner. This document may not be copied, scanned, duplicated, forwarded, distributed, or posted on a website, in whole or part.
25-2
Module 25 – Using Visuals
2. “Number of Lottery Participants”
The title doesn’t tell a story. Would be more useful if it described a specific state or
region and whether the number of participants was on the increase or in decline.
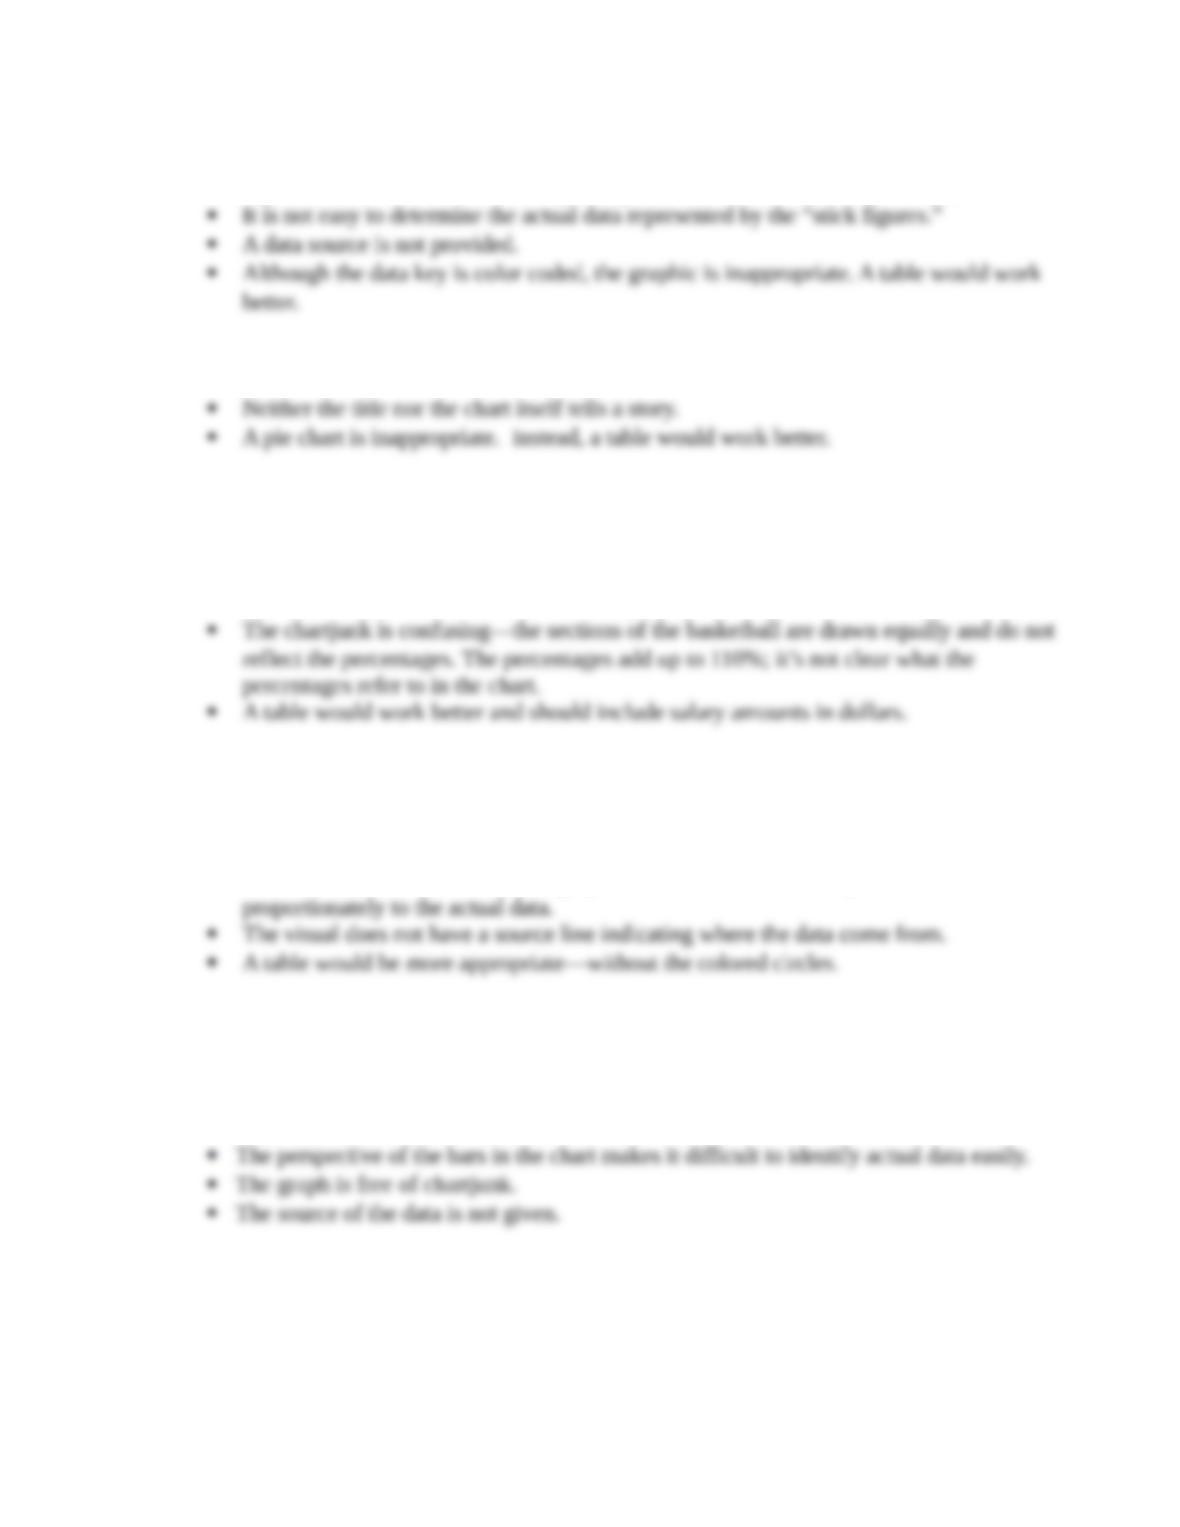
3. “How My Time Will Be Used”
4. ”NBA Player Salaries by Team”
The title doesn’t tell a story because the data only pertains to certain NBA teams—not the
entire league.
There is no time reference for the data displayed.
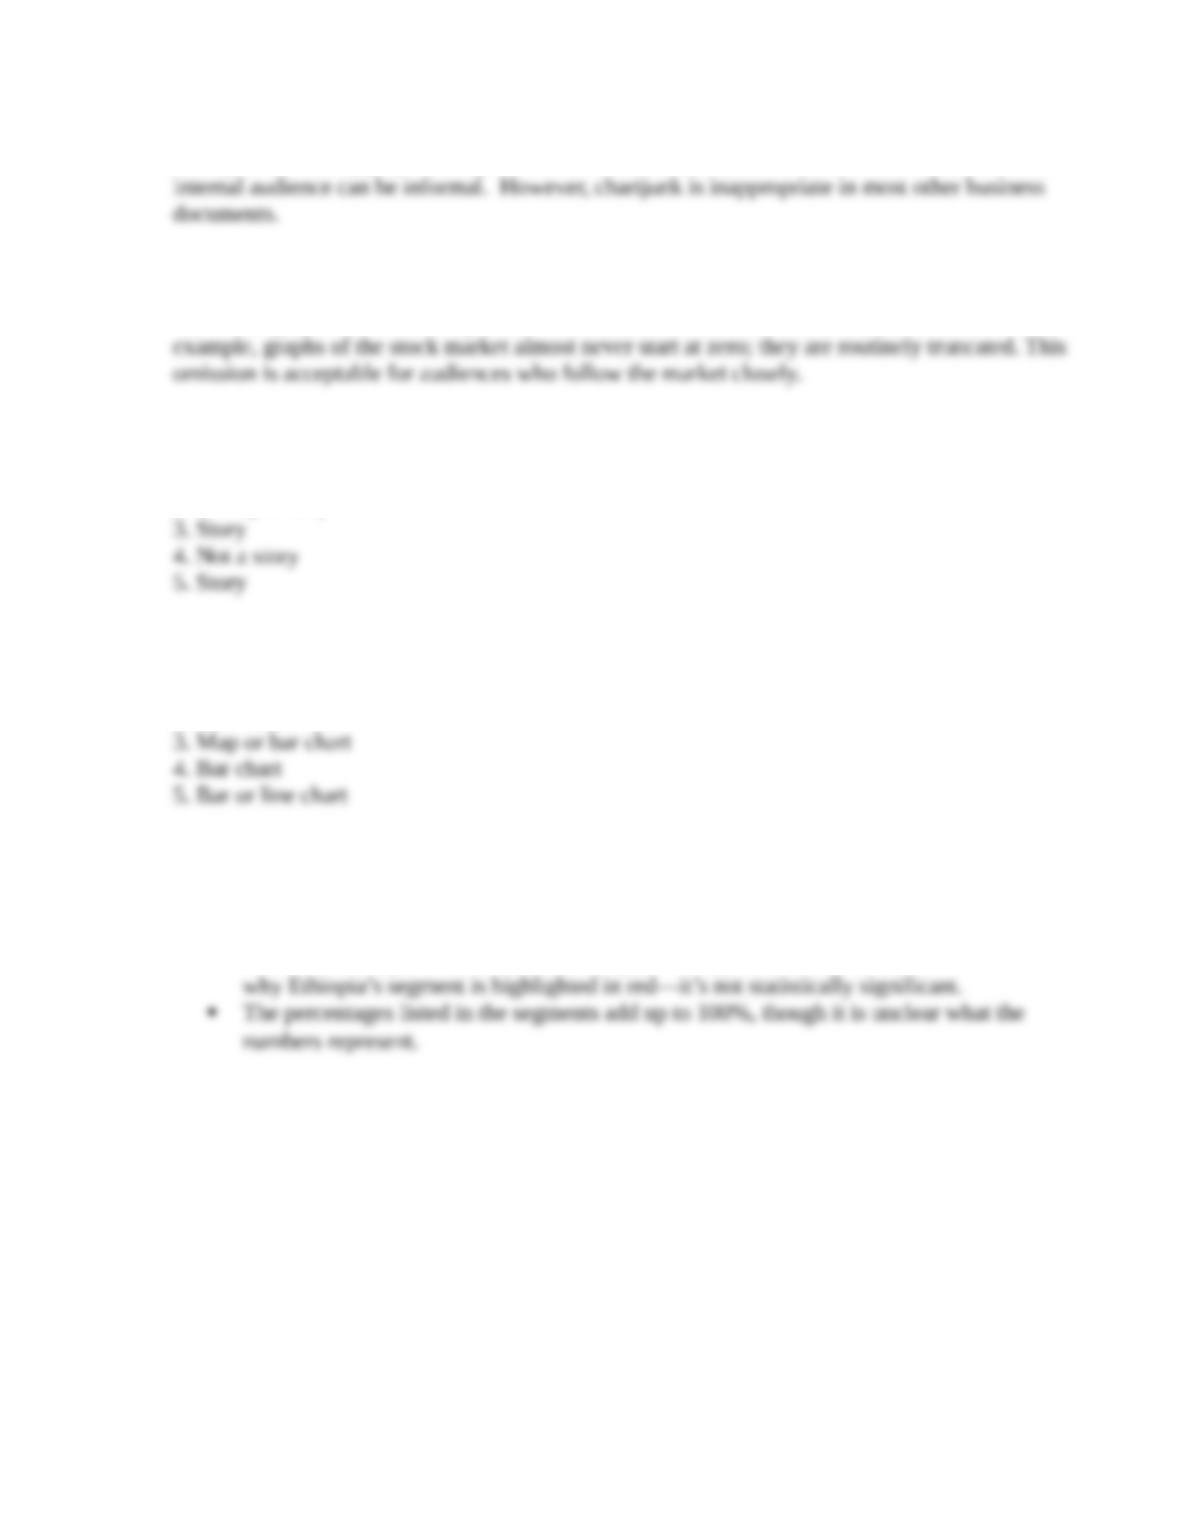
5. “Cancer Occurrence Among Men in Various Countries”
The chart does not carry a title in the printed textbook.
The countries are not listed in alphabetical or ranking order.
The size of the circles used in the graphic can be considered chartjunk—not drawn
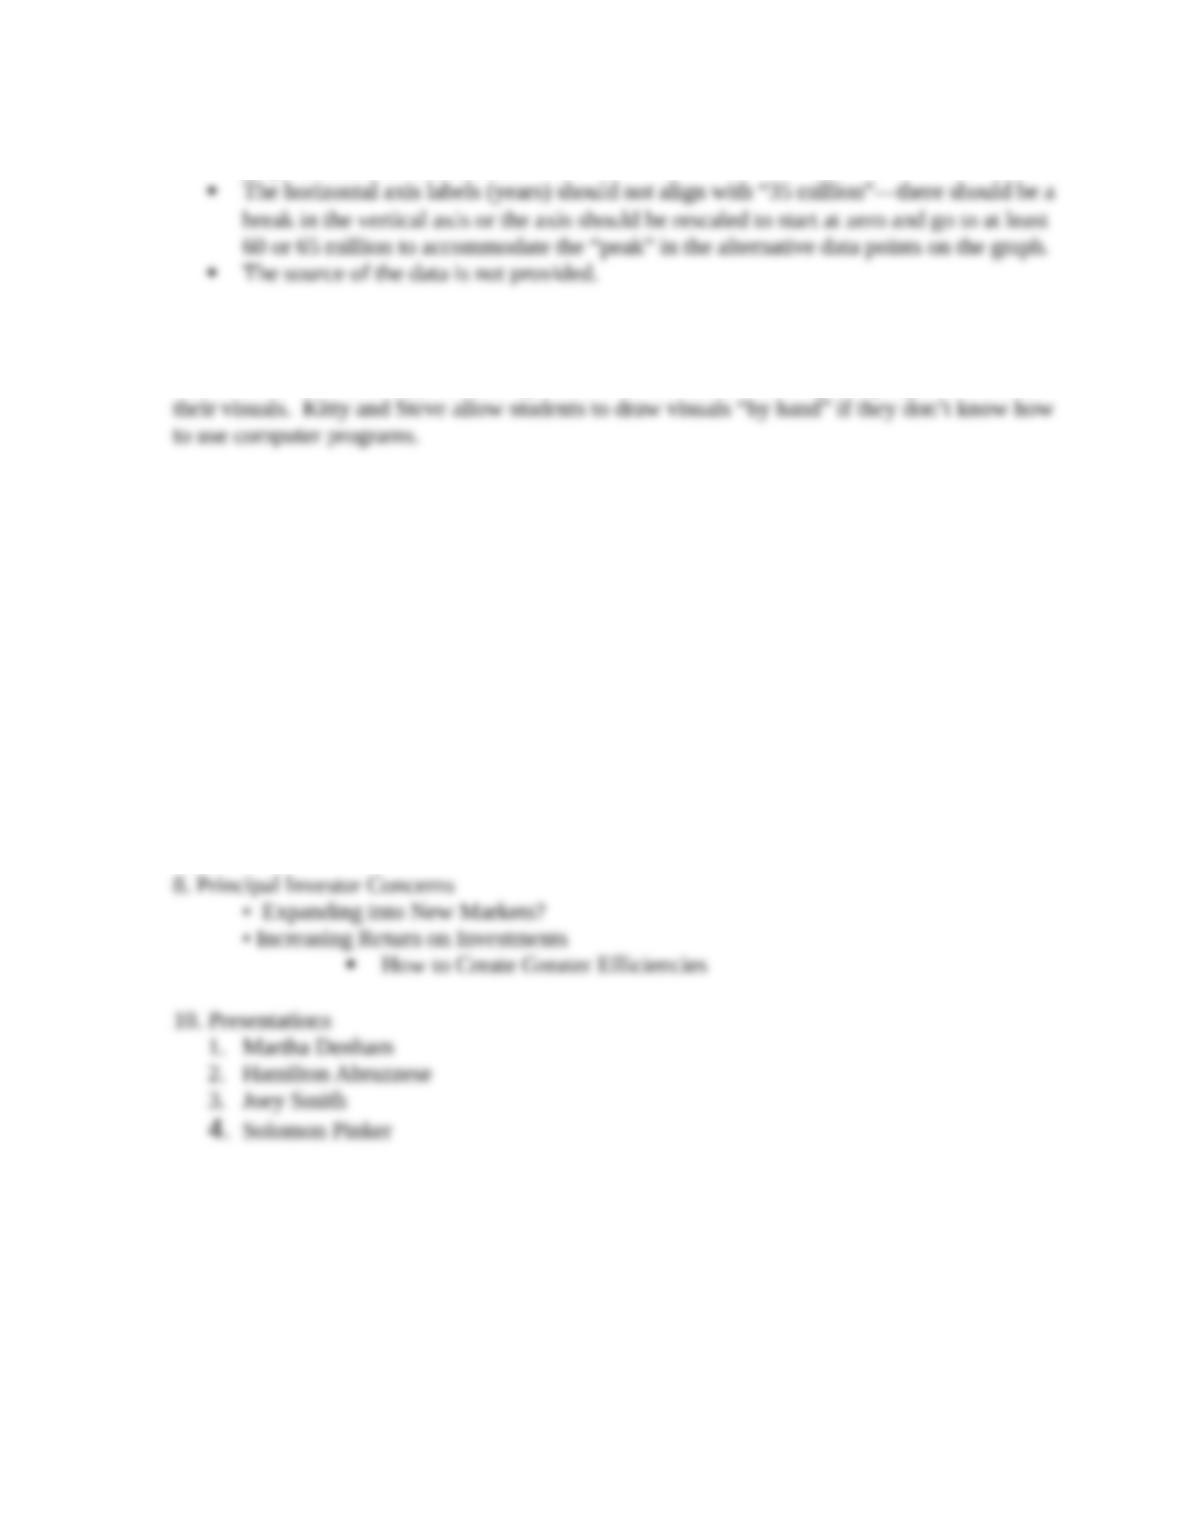
6. “Students Enrolled in After-School Programs”
The title could be more specific—indicating a certain region or city.
The bar graph shows change over time and allows comparison. However, the vertical axis
should start at zero, not 1 million.
7. “Alternative and Country Album Sales”
© 2014 by McGraw-Hill Education. This is proprietary material solely for authorized instructor use. Not authorized for sale or distribution in any
manner. This document may not be copied, scanned, duplicated, forwarded, distributed, or posted on a website, in whole or part.
25-3
Module 25 – Using Visuals
The title hints at a story.
A graph is appropriate; however, the labels for the vertical axis should be at the left of the
graph to eliminate confusion.
25.11 Interpreting Data (LO 25-1 to LO 25-5)
Students’ answers will vary. Encourage students to use available computer programs to create
25.12 Graphing Data from the Web (LO 25-1 to LO 25-5)
Students’ answers will vary. Kitty and Steve allow students to draw visuals “by hand” if they
don’t know how to use computer programs.
Polishing Your Prose: Writing Subject Lines and Headings (Odd-numbered answers are in
the back of the textbook.)
Many answers are possible—here are possibilities.
2. Welcome to the Sales Department!
4. Benefits Changes Start in January
6. Vacation Dates
© 2014 by McGraw-Hill Education. This is proprietary material solely for authorized instructor use. Not authorized for sale or distribution in any
manner. This document may not be copied, scanned, duplicated, forwarded, distributed, or posted on a website, in whole or part.
25-4

Module 25 – Using Visuals
Unit 6 Case for Communicators
Waterless Wonder!
This unit case describes a company in the country of Jordan that uses a waterless car-washing
process—saving thousands of gallons of water annually. The company—Keenwash—is
expanding from Jordan to other markets in Saudi Arabia, Kuwait, Oman, Egypt, and the West
© 2014 by McGraw-Hill Education. This is proprietary material solely for authorized instructor use. Not authorized for sale or distribution in any
manner. This document may not be copied, scanned, duplicated, forwarded, distributed, or posted on a website, in whole or part.
25-5