
Skills Building Exercises
1. Construct a complete, concise title for a line chart representing employment placement
rates for graduates in your major at your school from 2010 to the present. (LO2)
2. The chart prepared in Exercise 1 requires an explanation for the academic years 2011–2012
and 2012–2013. In each of those years, data were collected in January (mid-academic year)
rather than June (end of the academic year). Provide the necessary explanation. (LO6)
A footnote is appropriate here. It might appear as follows: “Data from 2011–2012 and 2012–2013
3. For each of the types of information described below, which form of visual would you use?
Explain your decision. (LO1–4)
a. Record of annual sales for Kenyon Company for the past 20 years.
b. Comparison of Kenyon Company sales, by product, for this year and last year.
c. Monthly production of the automobile industry in units.
Breakdown of how the average middle-income family in your state (or province) disposes of its
income dollar.

Comparison of sales for the past two years for each of B&B Company’s 14 sales districts. The
districts cover all 50 states, Canada, and Puerto Rico.
National production of trucks from 1950 to present, broken down by manufacturer.
Relationship between list price and gas mileage of alternative and gasoline-fueled cars.
Home purchases by home value, geographic region, and income.
A subdivided bar chart is a clear choice here. Regions would be represented by different colors.
The total number of home purchases for that region would be subdivided with a bar for income
ranges and a bar for home values. The bars would then be shaded to show the number of
purchases made in each range.
4. For each of the following sets of facts, (a) determine the visual (or visuals) that would be
best, (b) defend your choice, and (c) construct the visual. (LO1–5)
a. Average (mean) amount of life insurance owned by Mutual Life Insurance
Company policyholders. Classification is by annual income.
Income Average Life
Insurance
A simple bar chart is probably best here since the data consist of a single series (value of
insurance) classification on one basis (income).
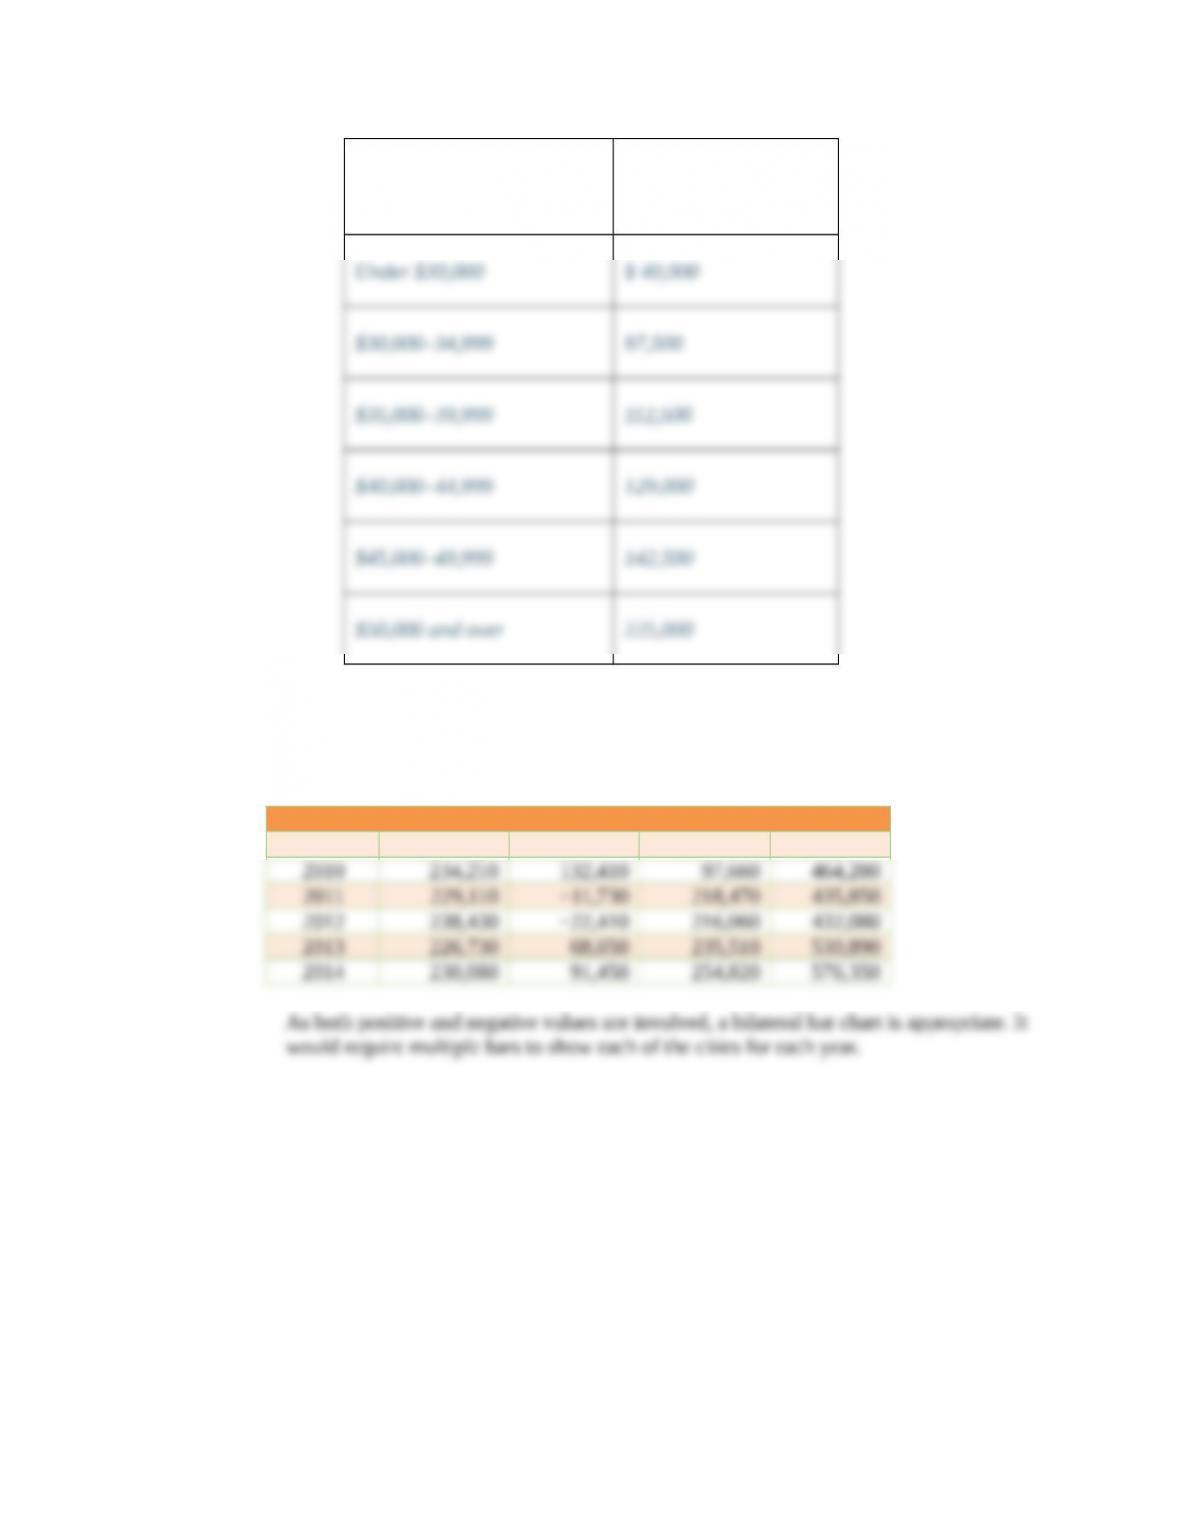
b. Profits and losses for Whole Foods Stores, by store, 2010–2014, in dollars.
Store
Year Able City Baker Charleston Total
c. Share of real estate tax payments by ward for Bigg City, 2010 and 2014, in
thousands of dollars.
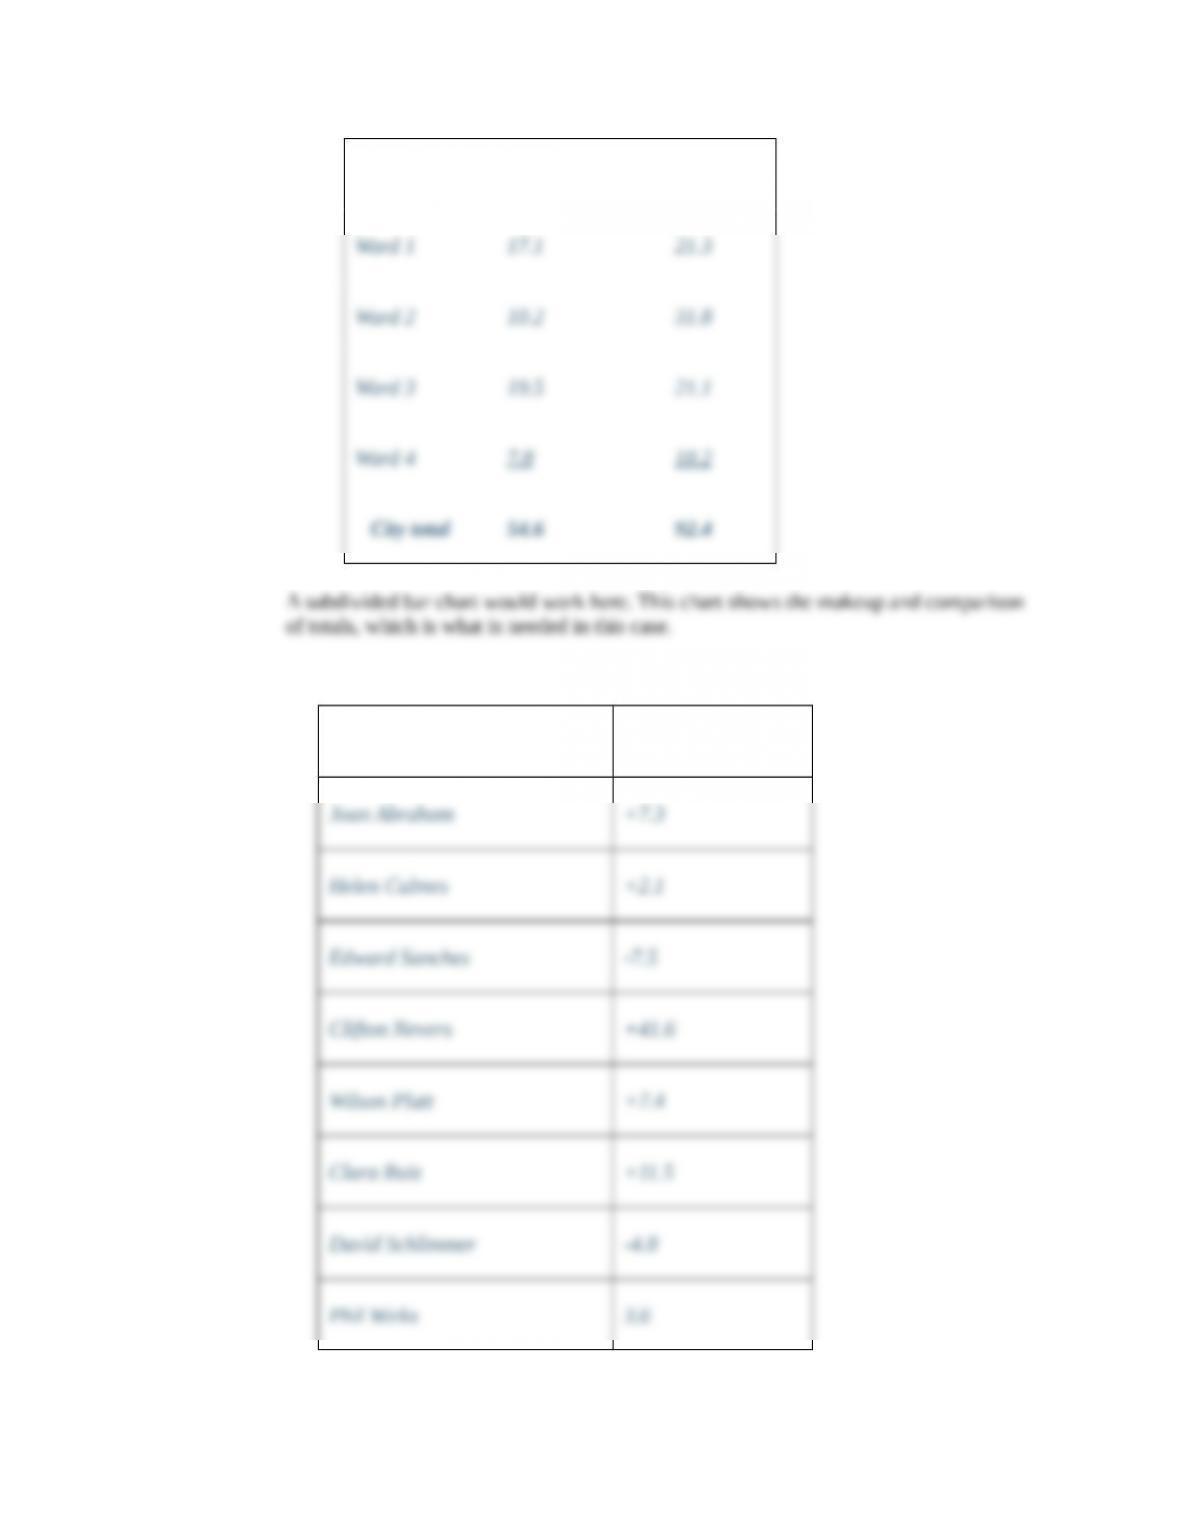
2010 2014
d. Percentage change in sales by employee, 2013–2014, District IV, Abbott, Inc.
Employee Percentage Change
As both plus and minus percentages are involved, a bilateral bar chart is appropriate.
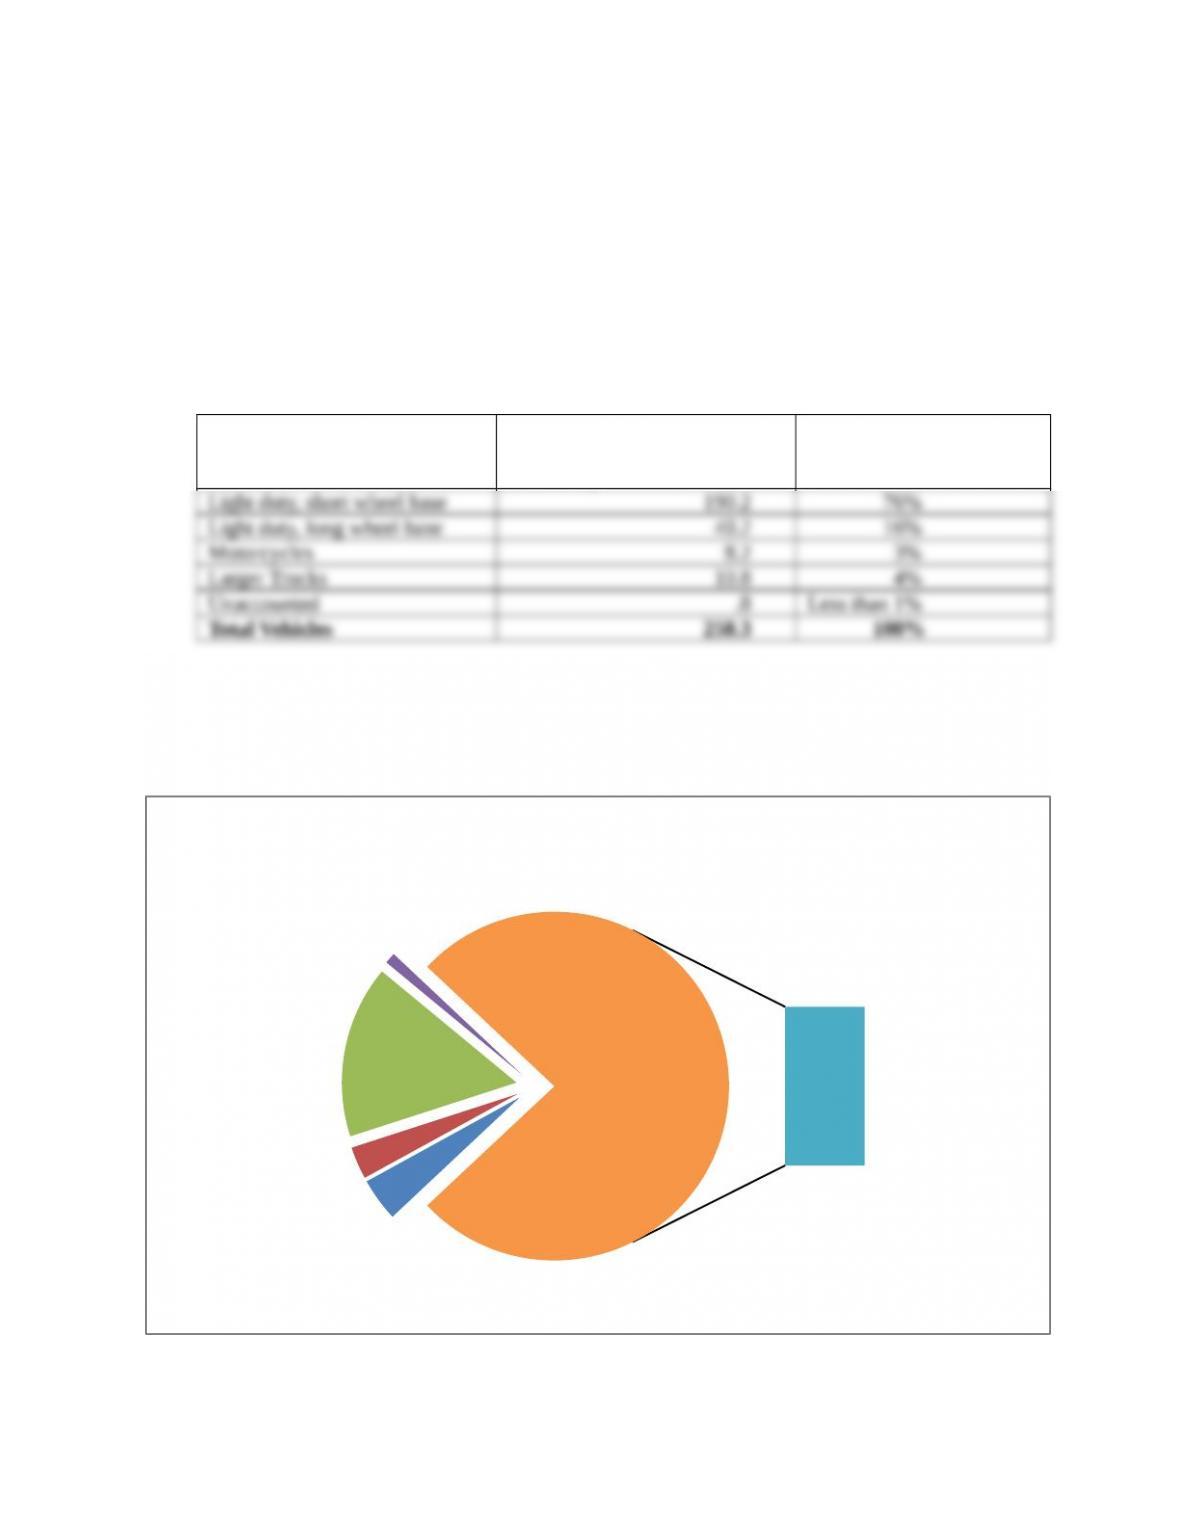
5. Determine what percentage of each type of registered vehicle is owned in the U.S., including
hybrid vehicles as appropriate. Choose an appropriate visual type and create it to convey
the data. Consult the U.S. Department of Transportation for statistics. (LO1–5)
Visual: Pie Chart
Data: U.S. Registered Passenger Vehicles
VEHICLE TYPES AMOUNT
(rounded to nearest hundred
thousand)
PERCENTAGE
Larger Trucks
4%
Motorcycles
3%
Light duty, long
wheel base
16%
Unaccounted
1%
Light duty, short
wheel base
(includes passenger
cars, light trucks,
vans and some sport
utility vehicles)
76%
Other
76%
U.S.RegisteredPassenger Vehicles
Less
than 1%
of light
duty
vehicles
are
hybrid
vehicles
Source: U.S. Department of Transportation Highway Statistics 2010
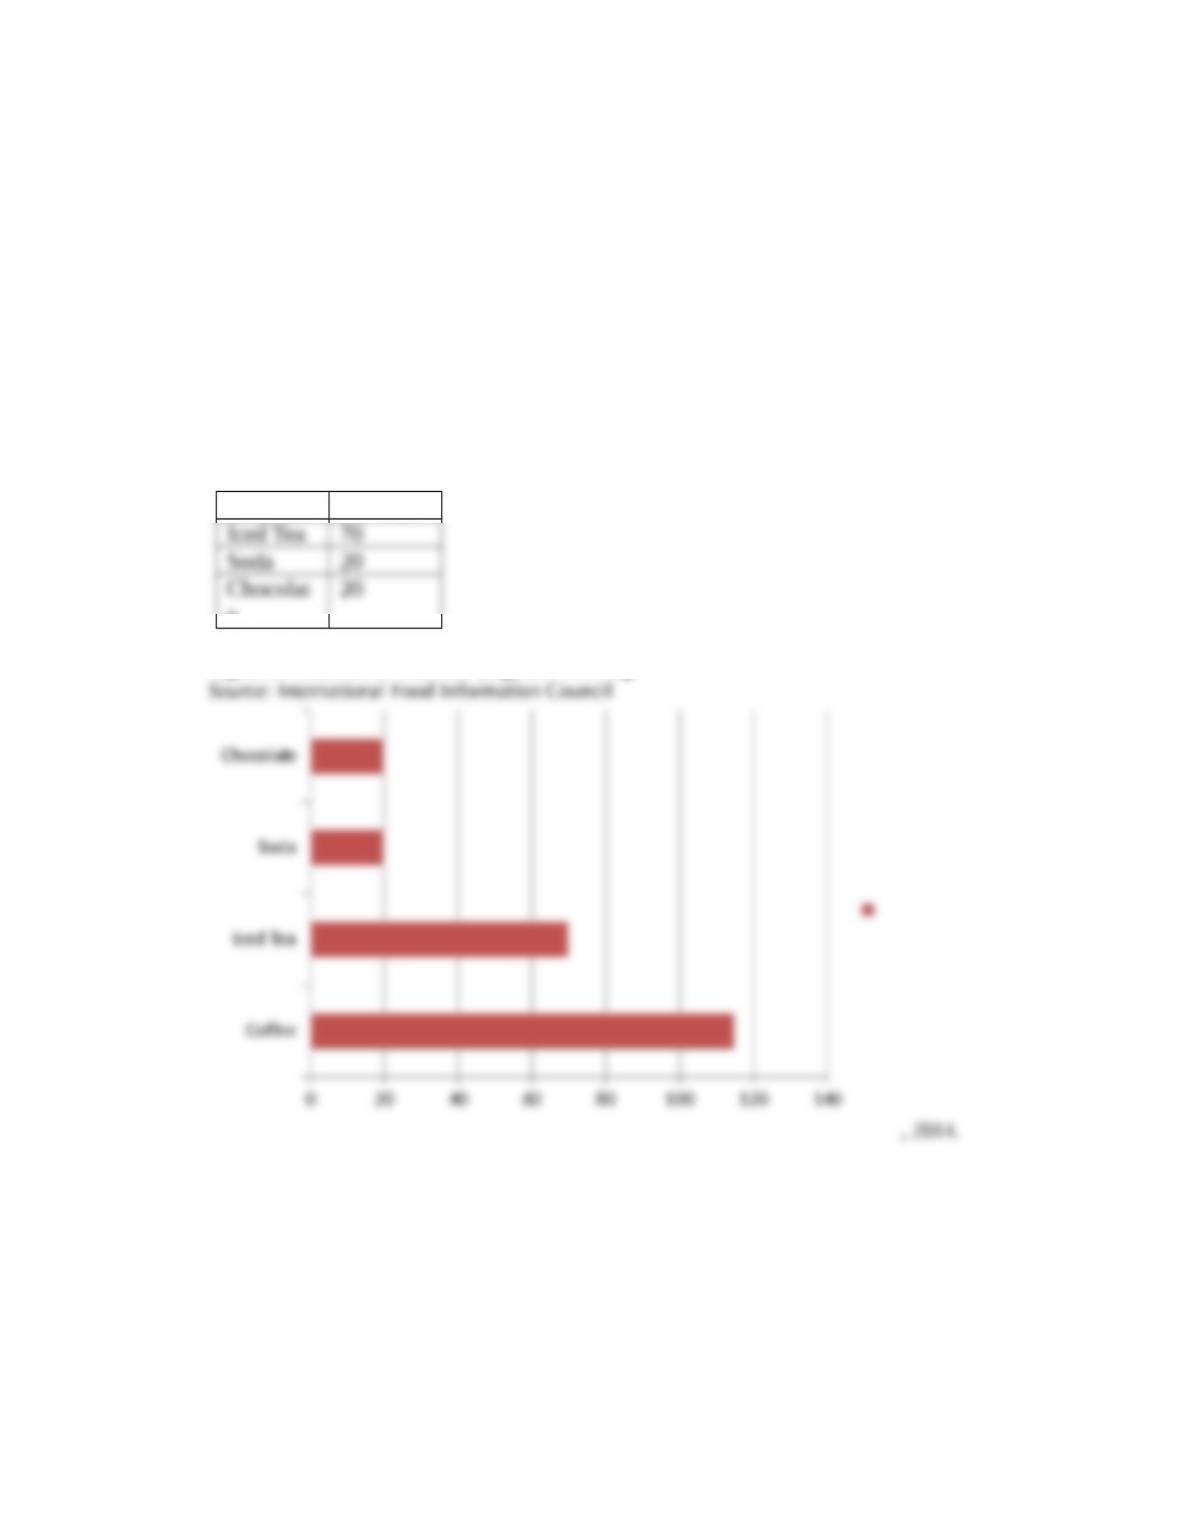
6. Through research, find the approximate milligrams of caffeine in the following items and
create an appropriate visual for Affiliated Food Products, Inc., to illustrate your findings.
(LO2–5)
a. 5-oz. cup of coffee (drip brewed)
b. 7-oz. glass of iced tea
c. 6-oz. glass of soda with caffeine
d. 1-oz. dark chocolate, semisweet
Visual: Bar Chart
Data:
Coffee 115 mg
e
Figure 2. Amount of Caffeine (mg) in a Serving
7. Choose five or six types of exercise. In a visual, identify the activity as a type of (1)
cardiovascular training, (2) strength training, or (3) muscle stretching and toning. You can
assume that some forms of exercise will incorporate all three types. You work for the Parks
and Recreation Department of a city of your choosing. Provide an interpretation of your
visual. (LO1–6)
Visual: Map
Data:
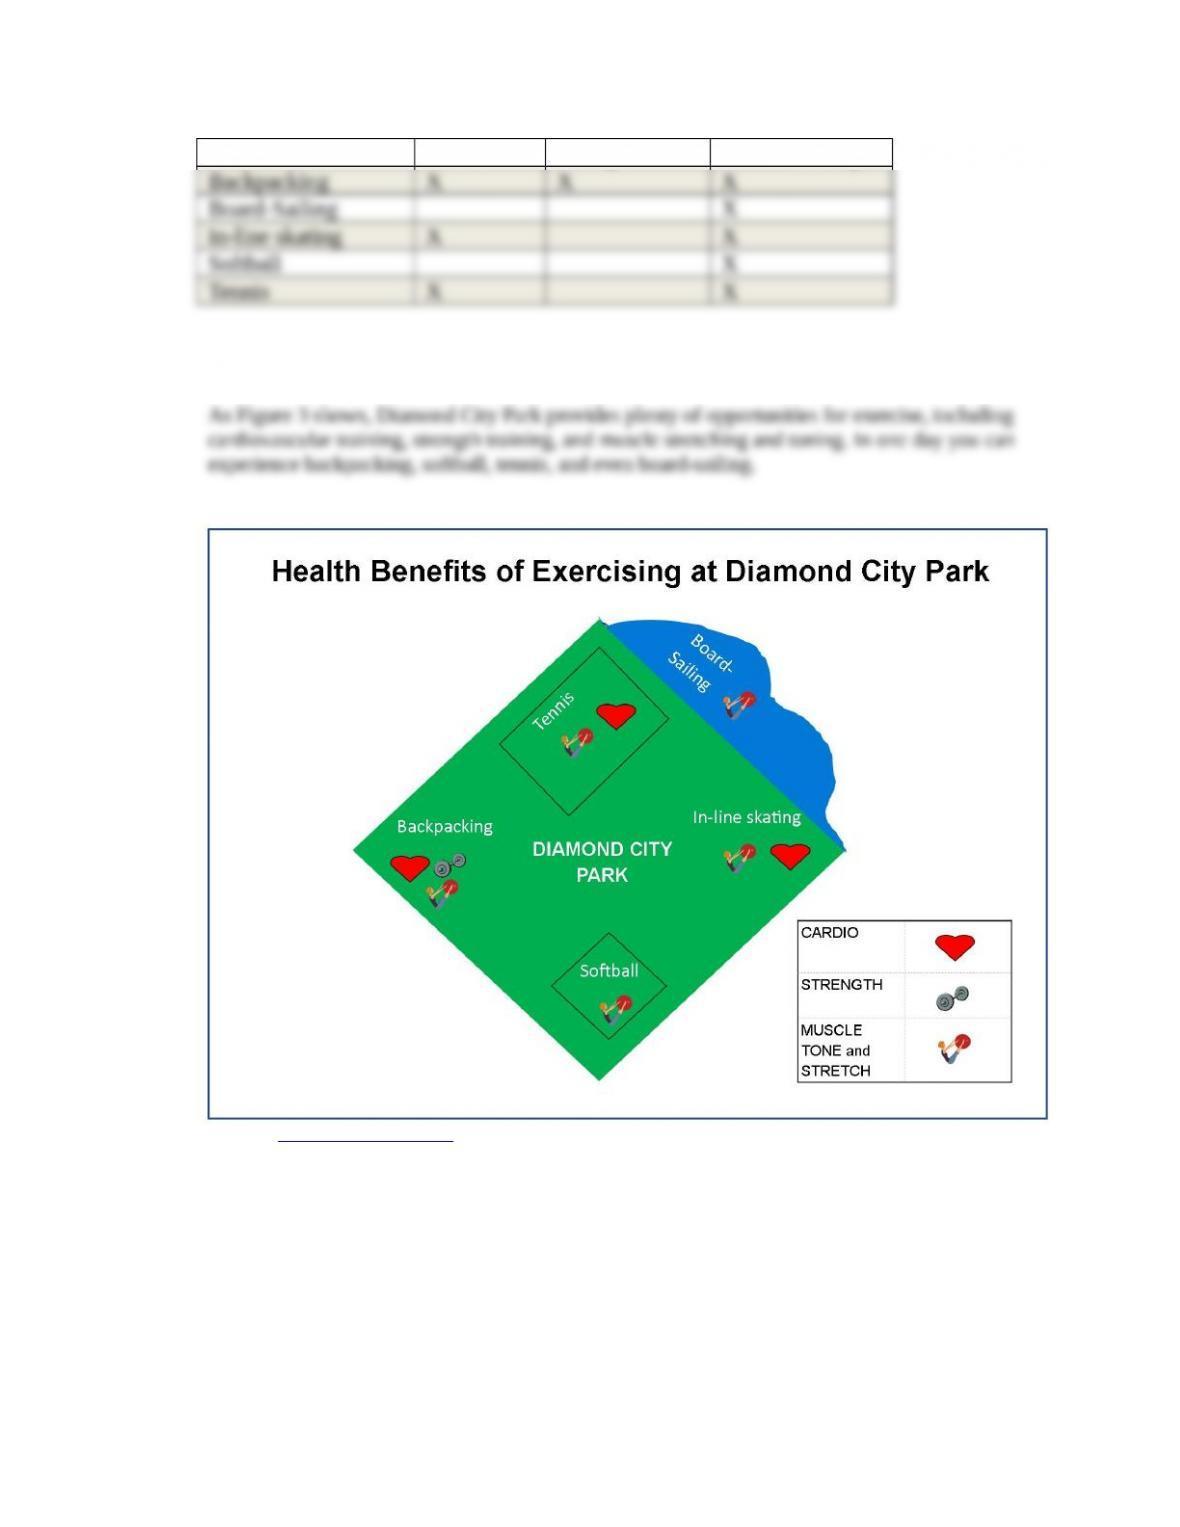
Cardio Strength Muscle Toning
Figure 3
Source: LIVESTRONG.com