6. (a) Source DF SS MS F P
Age 3 20.964 6.988 0.89095 0.453
7. (a) Source DF SS MS F P
Group 3 0.19218 0.064062 1.8795 0.142
8. (a) Source DF SS MS F P
Plant 3 12712.7 4237.6 4.8179 0.003
9. (a) Source DF SS MS F P
Temperature 2 148.56 74.281 10.53 0.011
10. (a) MSTr = 176.482/3 = 58.827
(b) 19 −3 = 16
(c) SSE = SST −SSTr = 235.958 −176.482 = 59.476
12. (a) Source DF SS MS F P
Collector 3 1.6135 0.53783 17.349 0.000
13. (a) Source DF SS MS F P
Temperature 3 58.650 19.550 8.4914 0.001
14. (a) From Exercise 12, MSE = 0.031, so s=√0.031 = 0.176.
(b) The MINITAB output for the power calculation is
Power and Sample Size
One-way ANOVA
15. (a) From Exercise 13, MSE = 2.3023, so s=√2.3023 = 1.517.
(b) The MINITAB output for the power calculation is
Power and Sample Size
One-way ANOVA
16. (a) Source DF SS MS F P
Diameter 2 20.565 10.283 7.4959 0.015
17. (a) Source DF SS MS F P
Machine 4 6862 1715.5 7.8825 0.000
18. (a) Source DF SS MS F P
Nail Type 2 316.62 158.31 2.2887 0.121
19. (a) Source DF SS MS F P
Soil 2 2.1615 1.0808 5.6099 0.0104
20. (a) The target power is 0.85.
Page 433
1. (a) Yes, F5,6= 46.64, P≈0.
(b) q6,6,.05 = 5.63. The value of MSE is 0.00508. The 5% critical value is therefore 5.63p0.00508/2 =
0.284. Any pair that differs by more than 0.284 can be concluded to be different. The following pairs
meet this criterion: A and B, A and C, A and D, A and E, B and C, B and D, B and E, B and F, D
and F.
83.394. We may conclude that treatments B and C differ.
(c) t24,.025/3= 2.5736 (the value obtained by interpolating is 2.594). The value of MSE is 5023.0. The
3. (a) MSE = 2.9659, Ji= 12 for all i. There are 7 comparisons to be made. Now t88,.025/7= 2.754, so
the 5% critical value is 2.754p2.9659(1/12 + 1/12) = 1.936. All the sample means of the non-control
Page 434
is 4.31p2.9659/12 = 2.14. All of the non-control formulations differ from the sample mean of the
control formulation by more than this amount. Therefore we conclude at the 5% level that all the
4. (a) t27,.025/2= 2.3734 (the value obtained by interpolating is 2.403). The value of MSE is 16.274. The
5% critical value is therefore 2.3734p2(16.274)/10 = 4.282.
5. (a) t16,.025/6= 3.0083 (the value obtained by interpolating is 3.080). The value of MSE is 2.3023. The 5%
critical value is therefore 3.0083p2(2.3023)/5 = 2.8869. We may conclude that the mean for 750◦C
6. (a) t16,.025/3= 2.6730 (the value obtained by interpolating is 2.696). The value of MSE is 1.1297. The
1.9251. We may We may conclude that the mean strengths for temperatures of 0◦C and 10◦C differ
from the mean strength for a temperature of 30◦C.
7. (a) t16,.025/3= 2.6730 (the value obtained by interpolating is 2.696). The value of MSE is 2.3023. The 5%
critical value is therefore 2.6730p2(2.3023)/5 = 2.5651. We may conclude that the mean for 900◦C
8. (a) t11,.025 = 2.201, MSE = 2.0133, the sample sizes are 4 and 3. The sample means are XB=
5.2525, XD= 6.990. The 95% confidence interval is 6.990 −5.2525 ±2.201p2.0133(1/4 + 1/3),
or (−0.6477,4.1227).
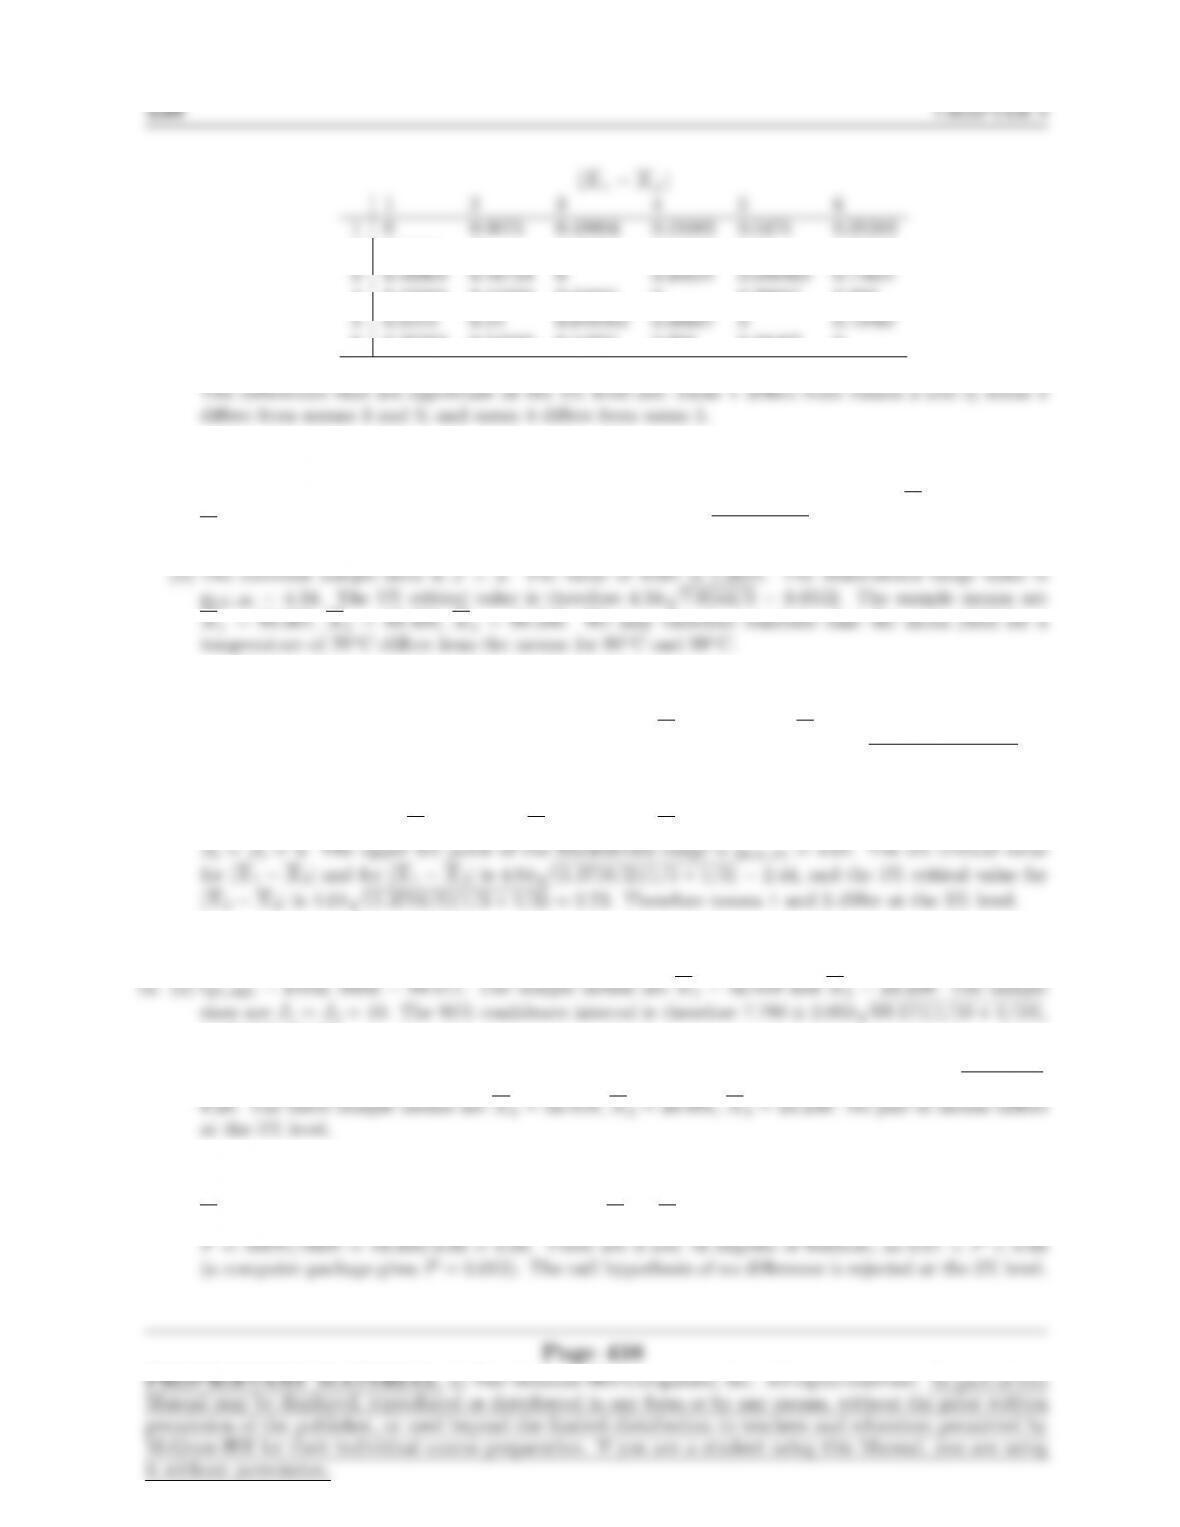
2 3.9709 −3.5020 3.5020 3.2422
44.1857 3.5020 3.7438 −3.5020
5 3.9709 3.2422 3.5020 3.5020 −
2 0.3225 0 0.94417 1.7375 1.3525
42.06 1.7375 0.79333 0 3.09
5 1.03 1.3525 2.2967 3.09 0
(0.1133,0.5923).
(b) The sample sizes are J1= 12, J2= 12, J3= 13, J4= 12, J5= 15, J6= 15. MSE = 0.096266.
We should use the Studentized range value q6,73,.05 . This value is not in the table, so we will use
20.37260 −0.36536 0.37260 0.35348 0.35348
4 0.37260 0.37260 0.36536 −0.35348 0.35348
60.35348 0.35348 0.34584 0.35348 0.33326 −
Page 437
2 0.0075 0 0.49154 0.14333 0.54 0.34533
40.15083 0.14333 0.34821 0 0.39667 0.202
6 0.35283 0.34533 0.14621 0.202 0.19467 0
10. (a) t6,.025 = 2.447, MSE = 7.0544, and both sample sizes are 3. The sample means are X1= 80.367 and
X3= 88.500. The 95% confidence interval is 8.133 ±2.447p2(7.0544)/3, or (2.827,13.440).
11. (a) t8,.025 = 2.306, MSE = 1.3718. The sample means are X1= 1.998 and X3= 5.300. The sample sizes
are J1= 5 and J3= 3. The 95% confidence interval is therefore 3.302 ±2.306p1.3718(1/5 + 1/3), or
(1.330,5.274).
(b) The sample means are X1= 1.998, X2= 3.0000, X3= 5.300. The sample sizes are J1= 5,
or (0.148,15.412).
(b) The table doesn’t contain q3,27,.05, so we’ll use q3,24,.05 = 3.53. The 5% critical value is 3.53p69.171/10 =
13. (a) X.. = 88.04, I= 4, J= 5, MSTr = PI
i=1 J(Xi. −X..)2/(I−1) = 19.554.
14. (a) X.. = 1351.5, I= 4, J= 4, MSTr = PI
i=1 J(Xi. −X..)2/(I−1) = 5158.67.
15. The value of the Fstatistic is F= MSTr/MSE = 19.554/MSE. The upper 5% point of the F3,16
distribution is 3.24. Therefore the Ftest will reject at the 5% level if 19.554/MSE ≥3.24, or,
5.099 <MSE <6.035.
16. The value of the Fstatistic is F= MSTr/MSE = 5158.67/MSE. The upper 5% point of the F3,12
distribution is 3.49. Therefore the Ftest will reject at the 5% level if 5158.67/MSE ≥3.49, or,
1. Let Ibe the number of levels of oil type, let Jbe the number of levels of piston ring type, and let K
be the number of replications. Then I= 4, J= 3, and K= 3.
Page 439
440 CHAPTER 9
Oil 3 1.0926 0.36420 5.1314 0.007
Ring 2 0.9340 0.46700 6.5798 0.005
Interaction 6 0.2485 0.041417 0.58354 0.740
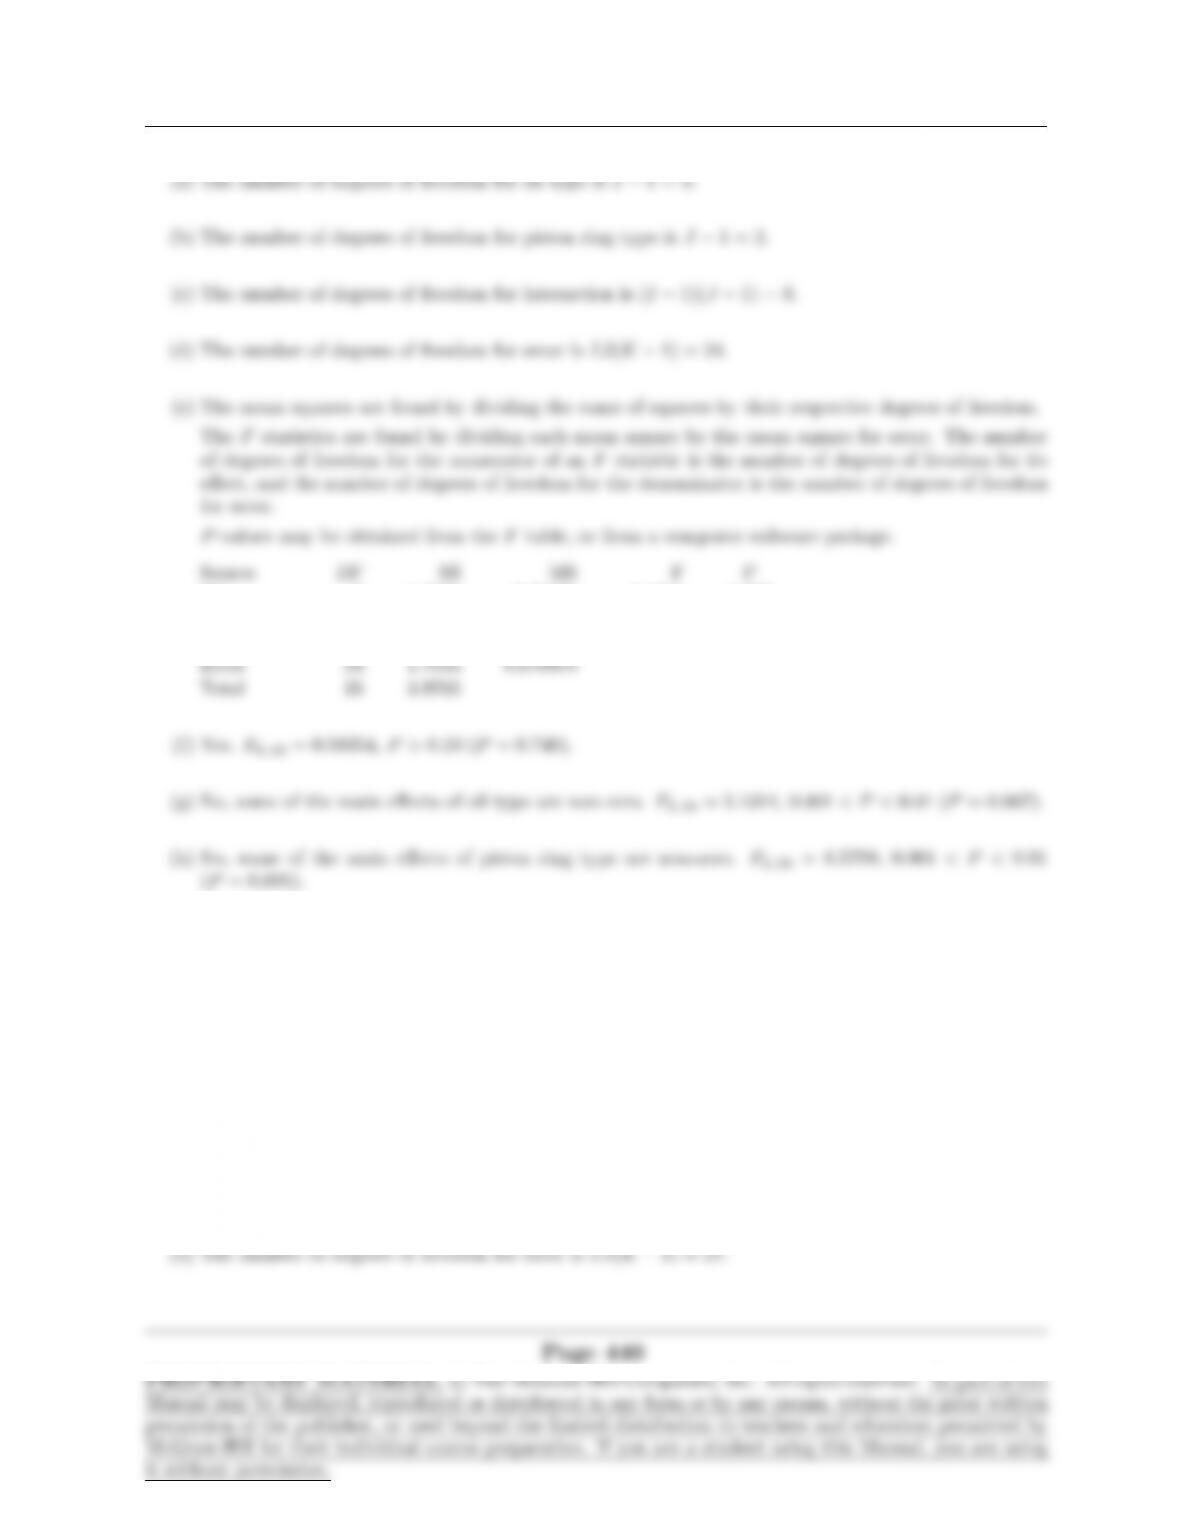
2. Let Ibe the number of levels of operator, let Jbe the number of levels of machine, and let Kbe the
number of replications. Then I= 3, J= 3, and K= 4.
(a) The number of degrees of freedom for operator is I−1 = 2.
(b) The number of degrees of freedom for machine is J−1 = 2.
(c) The number of degrees of freedom for interaction is (I−1)(J−1) = 4.
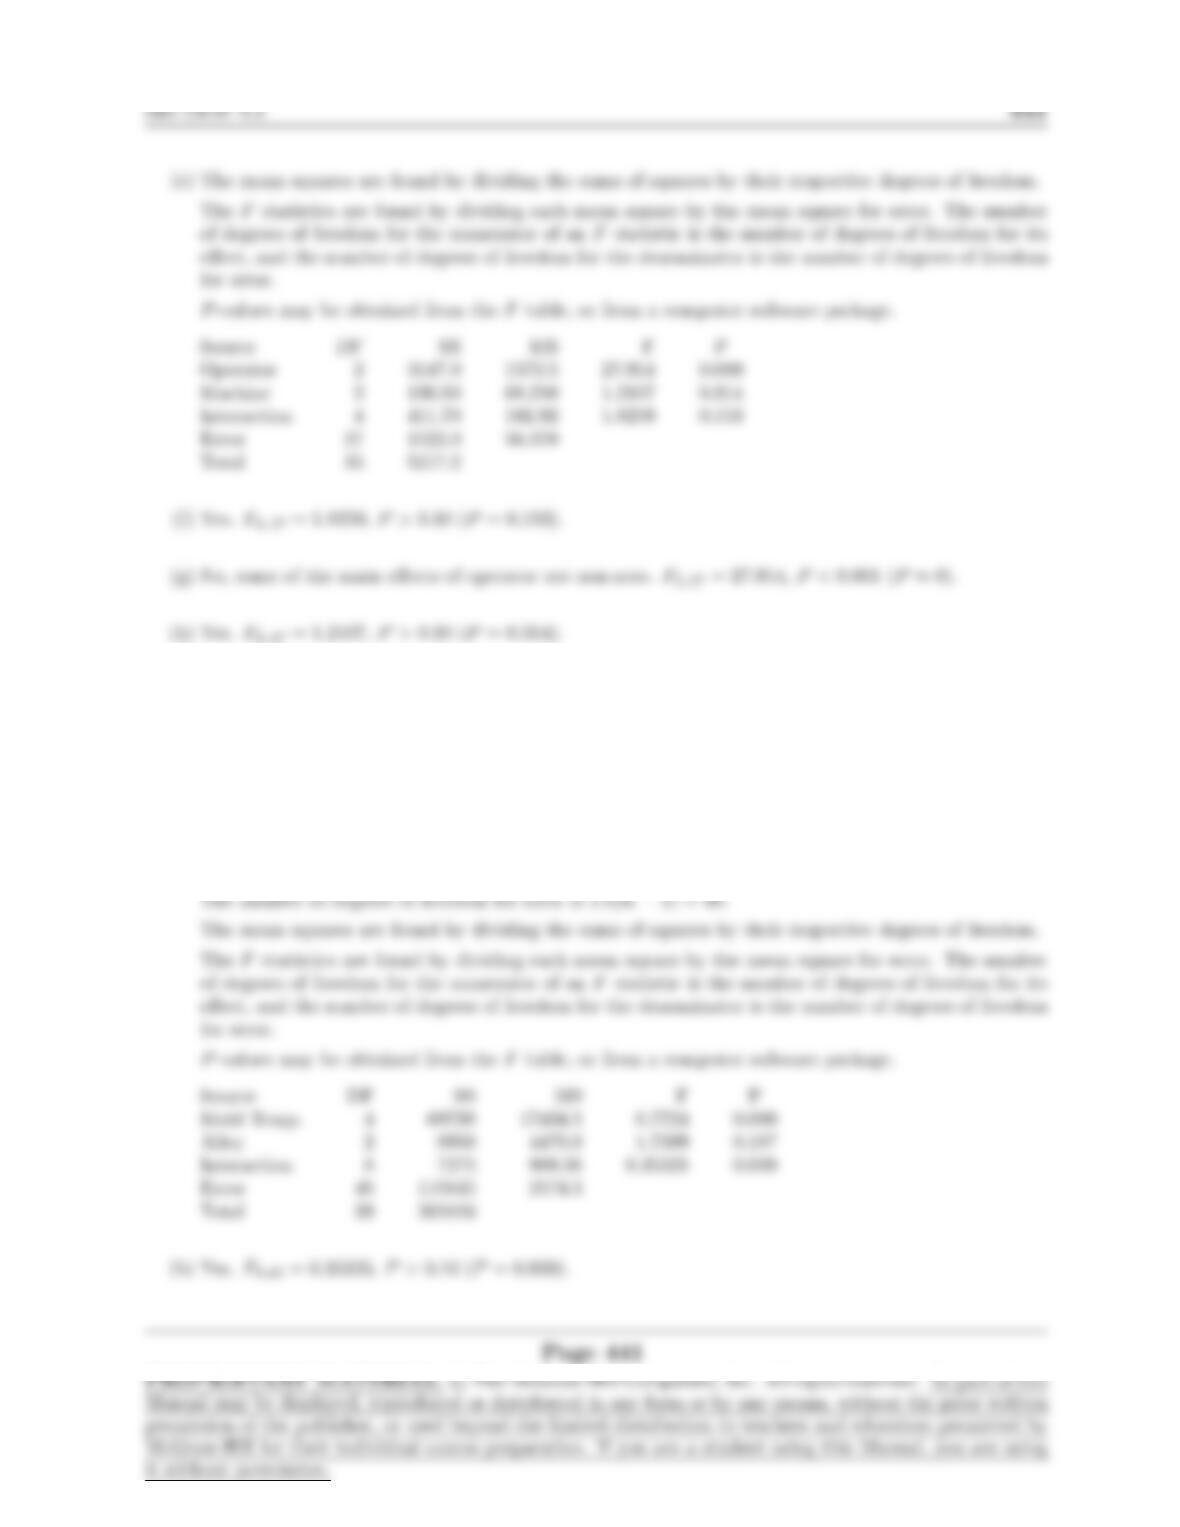
3. (a) Let Ibe the number of levels of mold temperature, let Jbe the number of levels of alloy, and let K
be the number of replications. Then I= 5, J= 3, and K= 4.
The number of degrees of freedom for mold temperature is I−1 = 4.
The number of degrees of freedom for alloy is J−1 = 2.
The number of degrees of freedom for interaction is (I−1)(J−1) = 8.
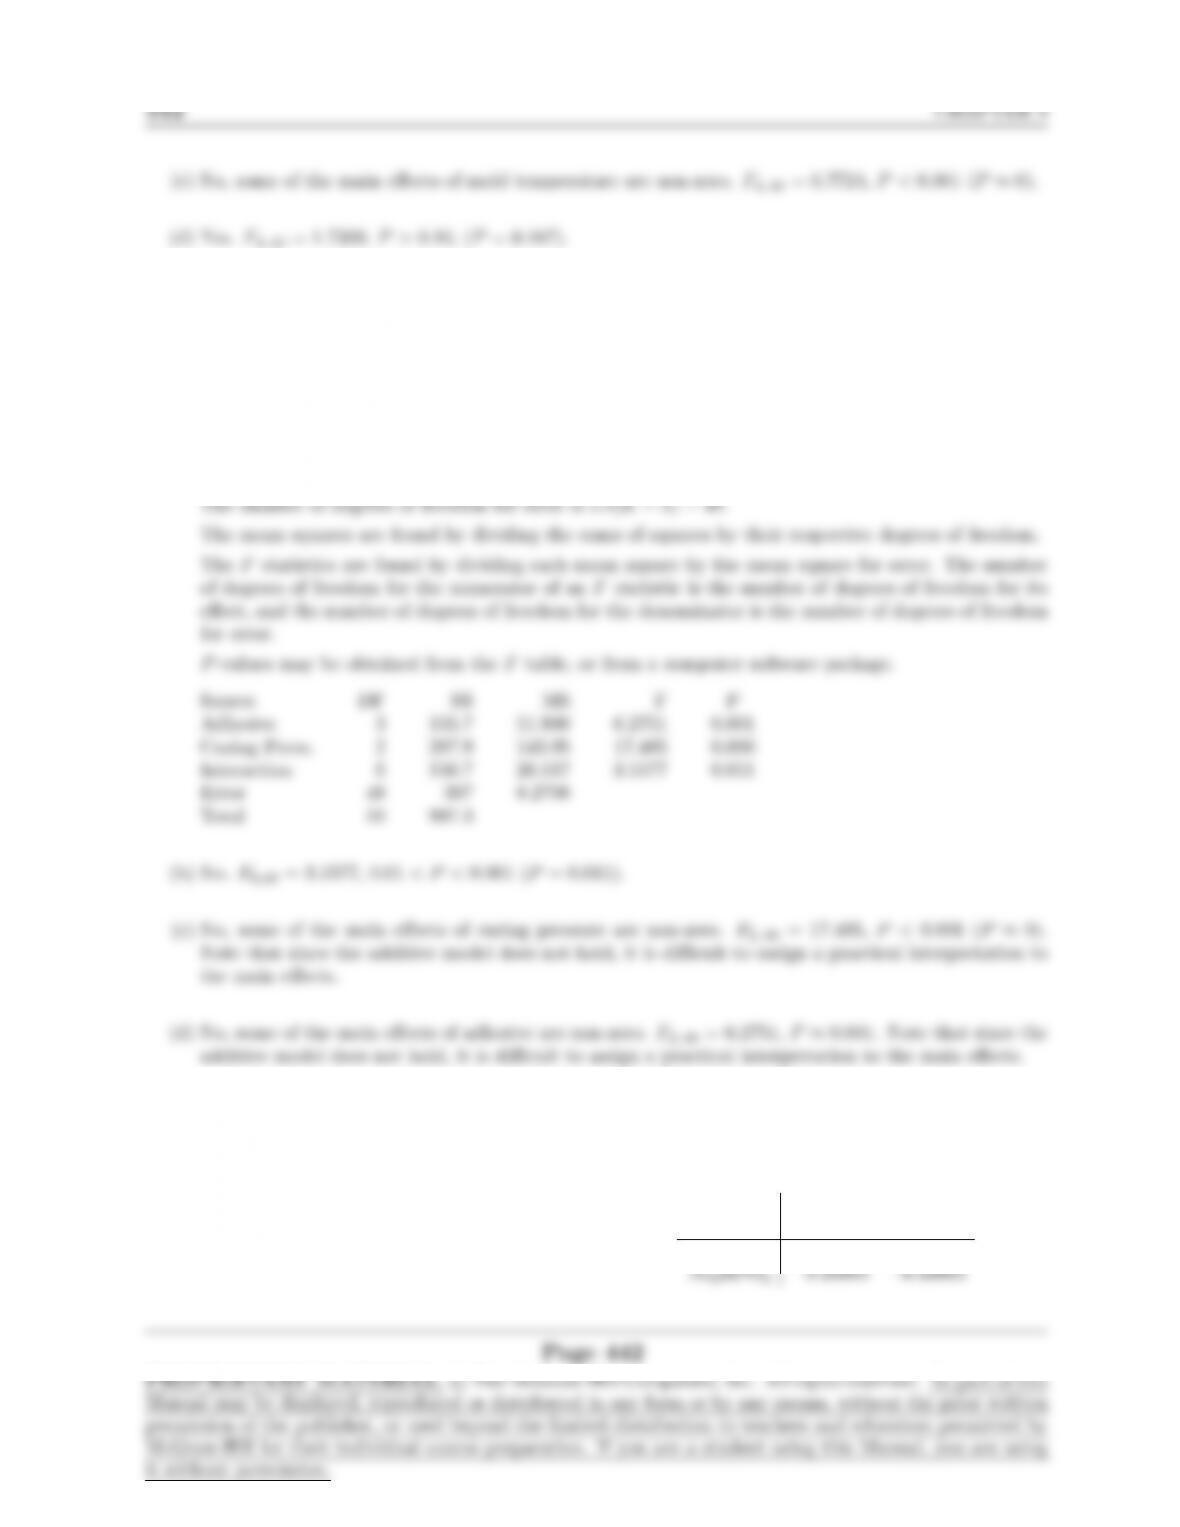
4. (a) Let Ibe the number of levels of adhesive, let Jbe the number of levels of curing pressure, and let K
be the number of replications. Then I= 4, J= 3, and K= 5.
The number of degrees of freedom for adhesive is I−1 = 3.
The number of degrees of freedom for curing pressure is J−1 = 2.
The number of degrees of freedom for interaction is (I−1)(J−1) = 6.
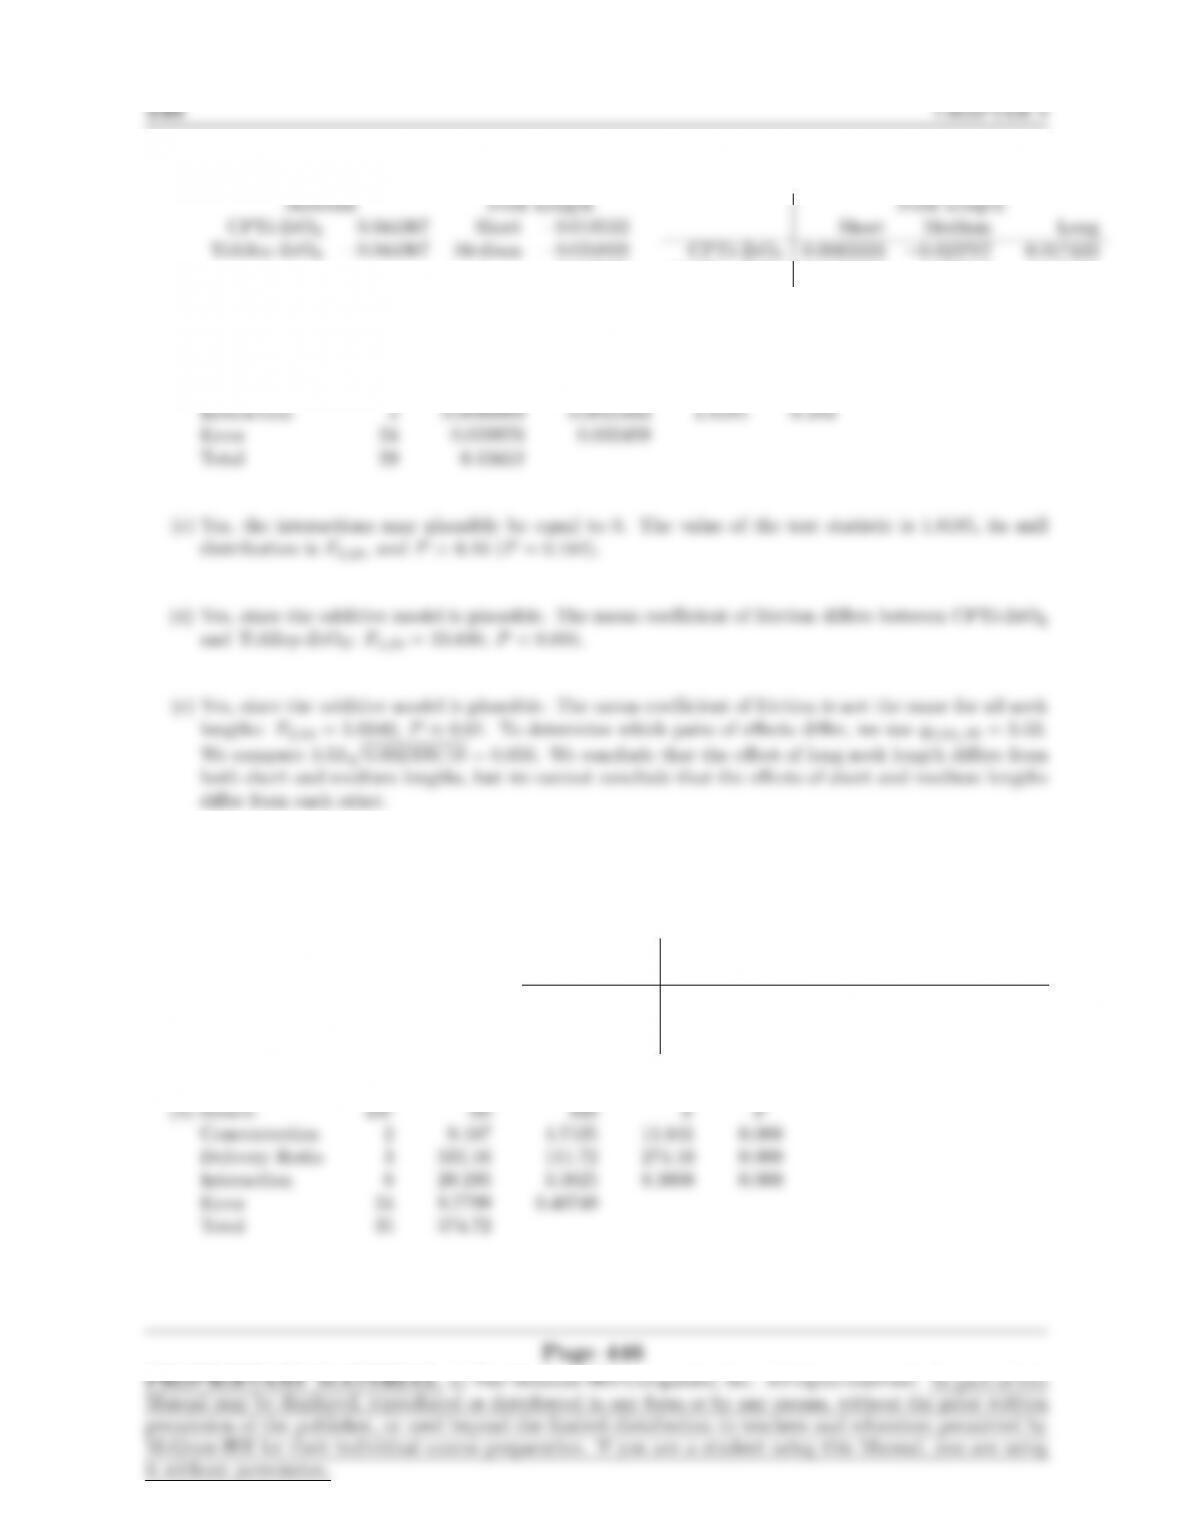
5. (a) Main Effects of
Solution
NaCl −9.1148
Na2HPO49.1148
Main Effects of
Temperature
25◦C 1.8101
37◦C−1.8101
Interactions
Temperature
Solution 25◦C 37◦C
NaCl −0.49983 0.49983
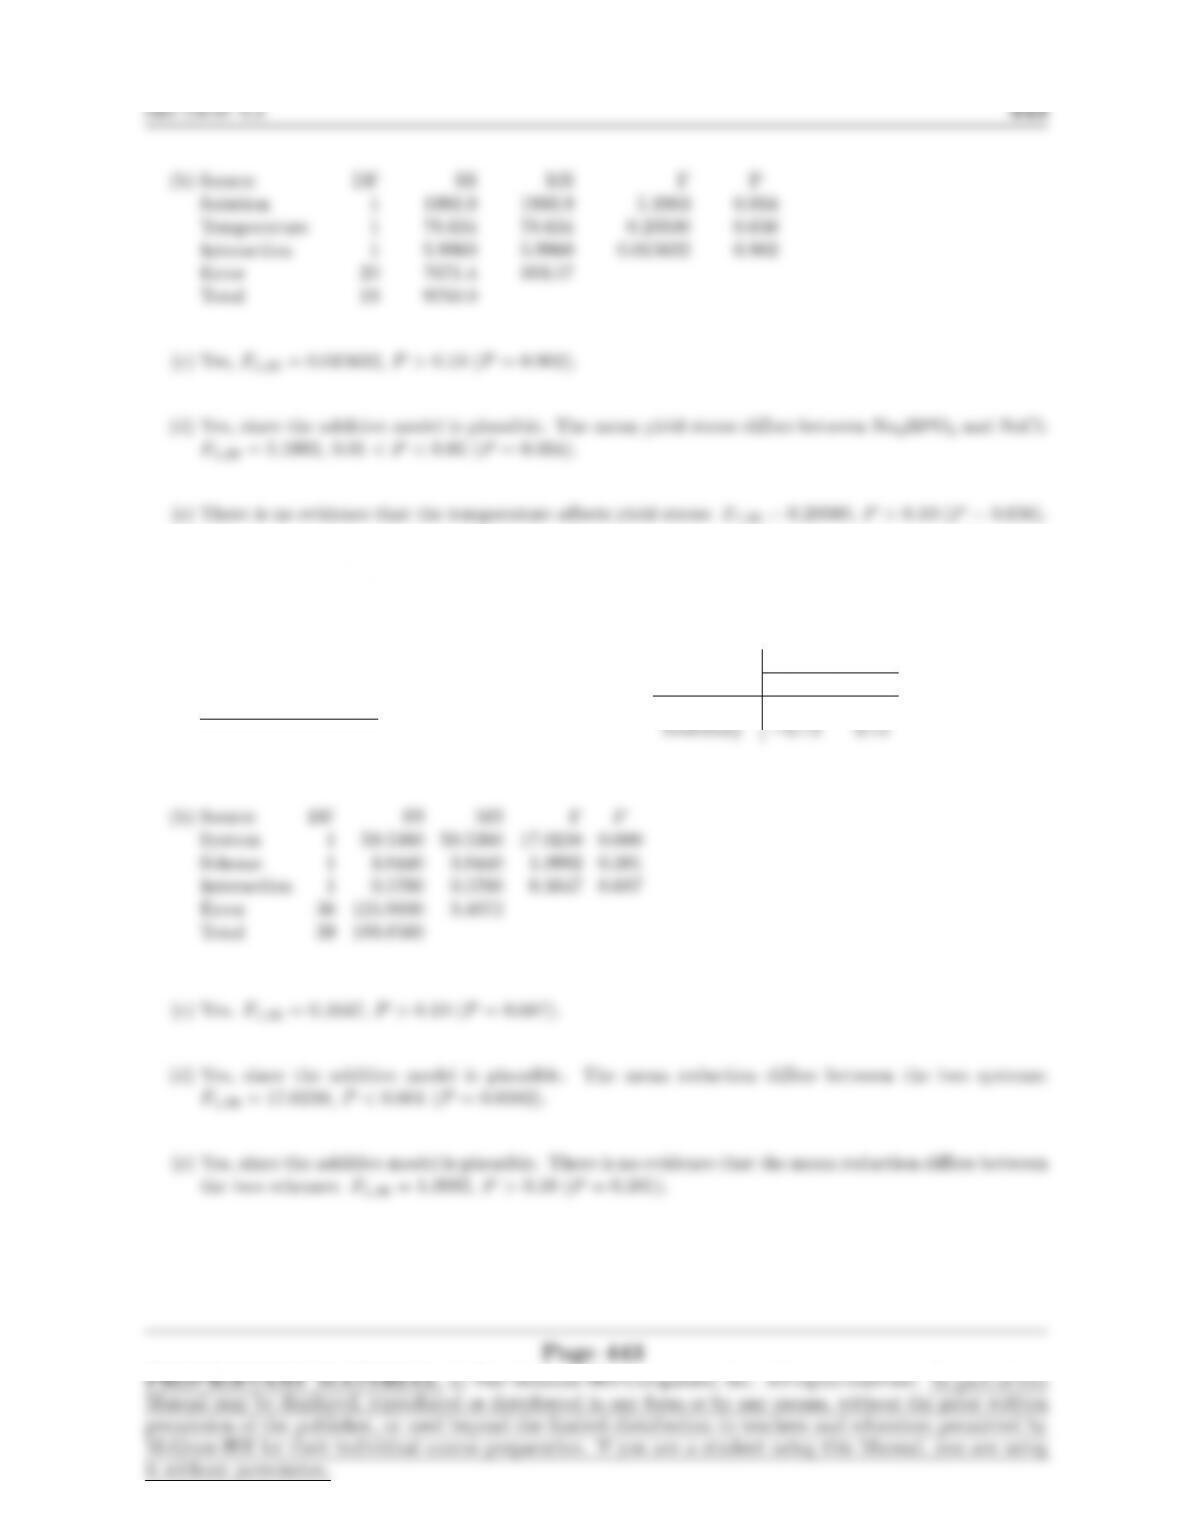
6. (a) Main Effects of
System
Serial Line −1.22
Inventory 1.22
Main Effects of
Scheme
A 0.31
B−0.31
Interactions
Scheme
System A B
Serial Line 0.12 −0.12
7. (a) Source DF SS MS F P
Adhesive 1 17.014 17.014 10.121 0.008
Pressure 2 35.663 17.832 10.607 0.002
10.607, P < 0.01 (P= 0.002).
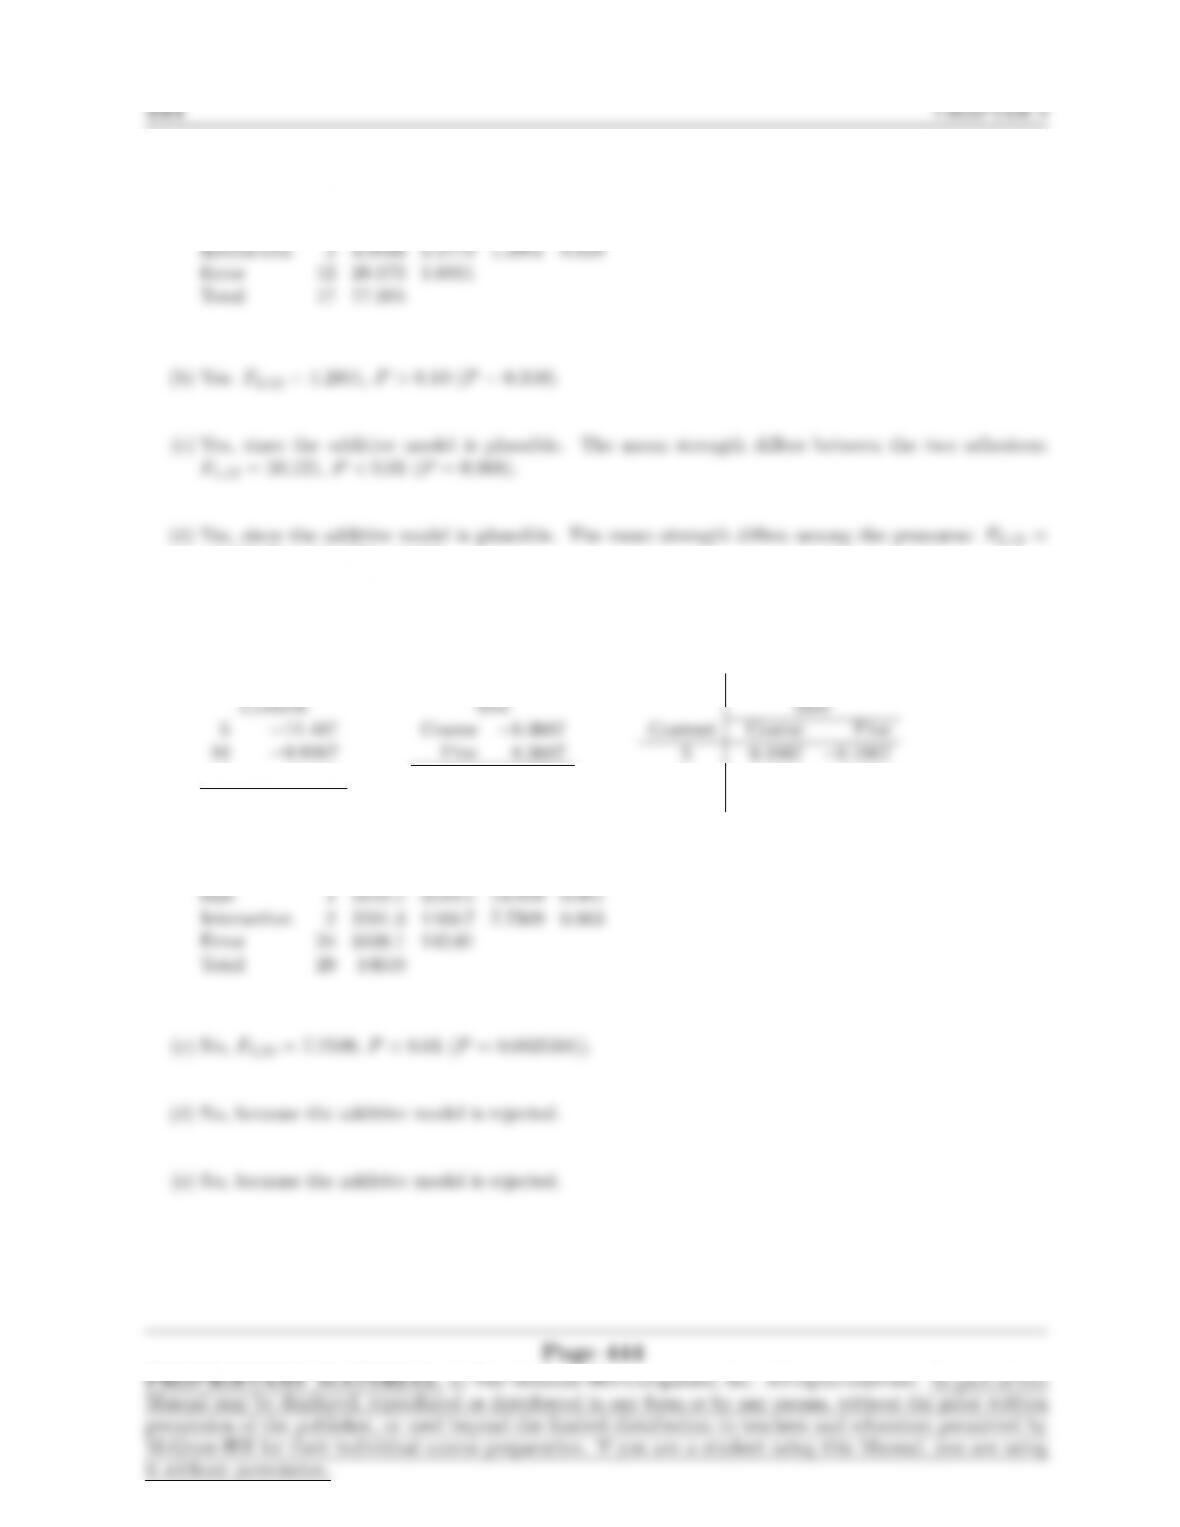
8. (a) Main Effects of
15 21.413
Main Effects of
Interactions
10 5.9267 −5.9267
15 −12.113 12.113
(b) Source DF SS MS F P
Content 2 6890.1 3445.1 24.26 0.000
9. (a) Main Effects of
150 19.463
Main Effects of
15 8.6296
Interactions
120 2.3704 −0.018519 −2.3519
150 −8.0185 −0.74074 8.7593
(b) Source DF SS MS F P
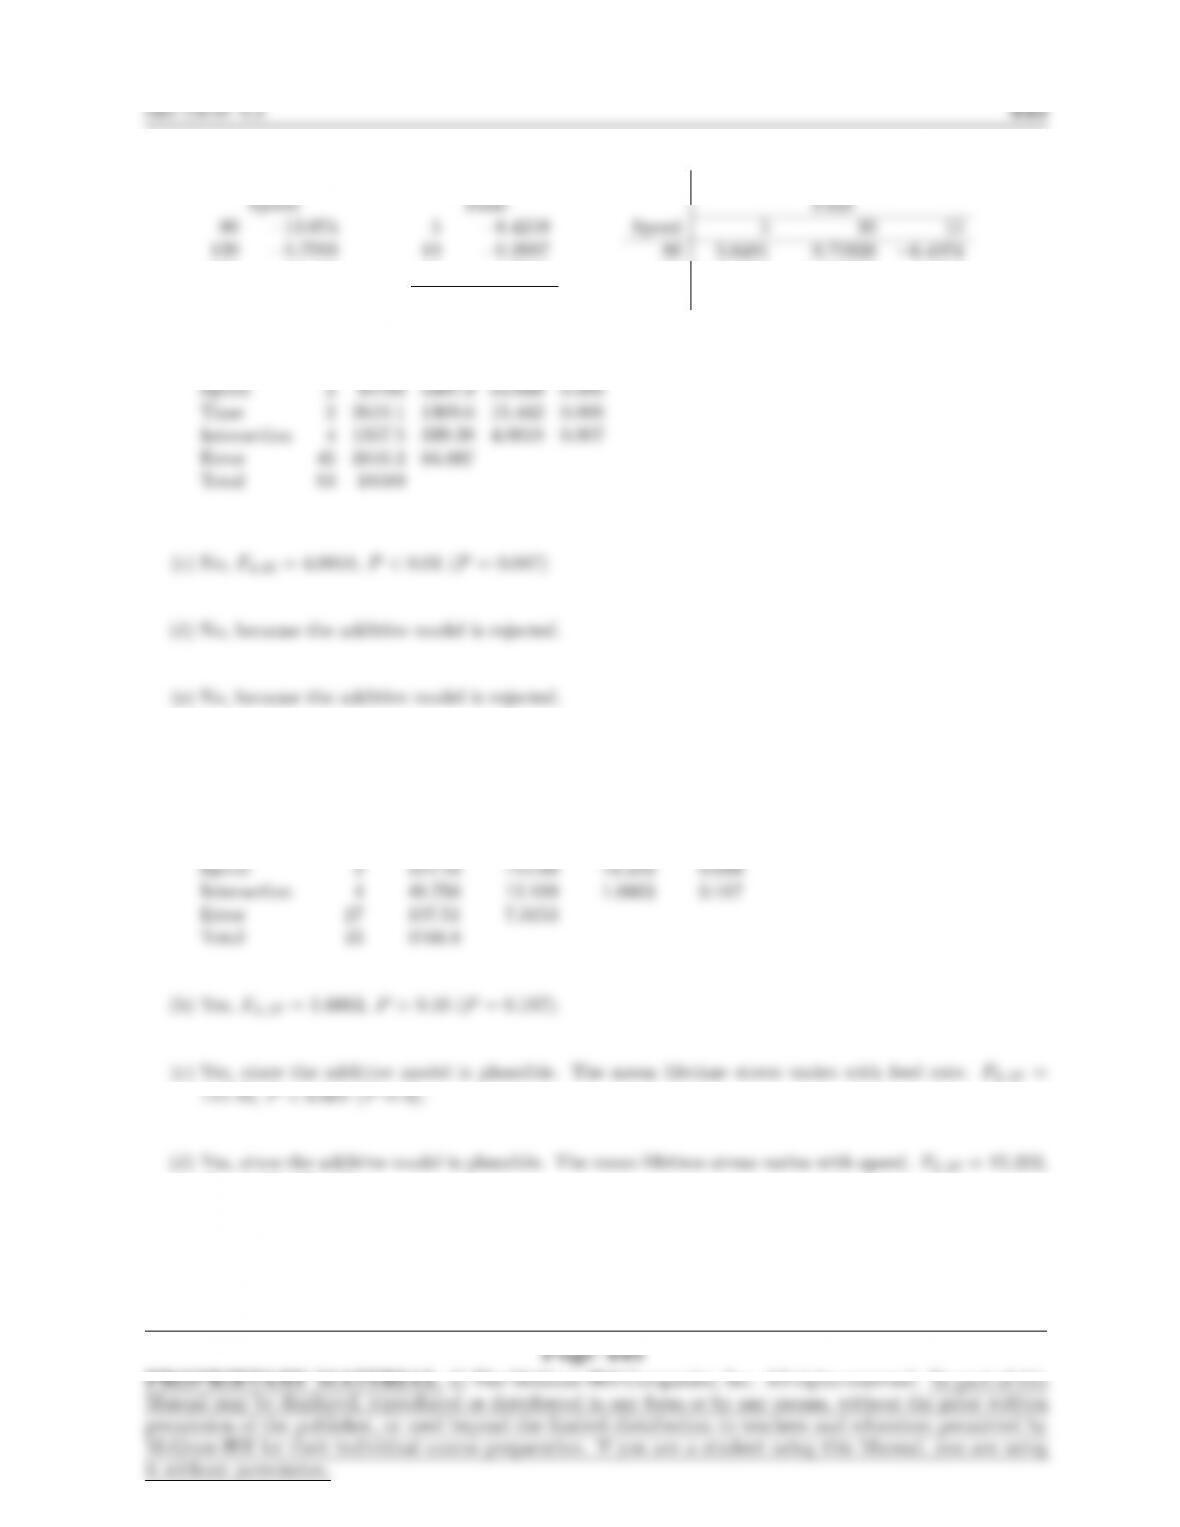
10. (a) Source DF SS MS F P
Feed Rate 2 1718.4 859.19 117.45 0.000
P < 0.001 (P≈0).
11. (a) Main Effects of
Main Effects of
Long 0.043367
Interactions
TiAlloy-ZrO20.0063333 0.023767 −0.017433
(b) Source DF SS MS F P
Taper Material 1 0.059052 0.059052 23.630 0.000
Neck Length 2 0.028408 0.014204 5.6840 0.010
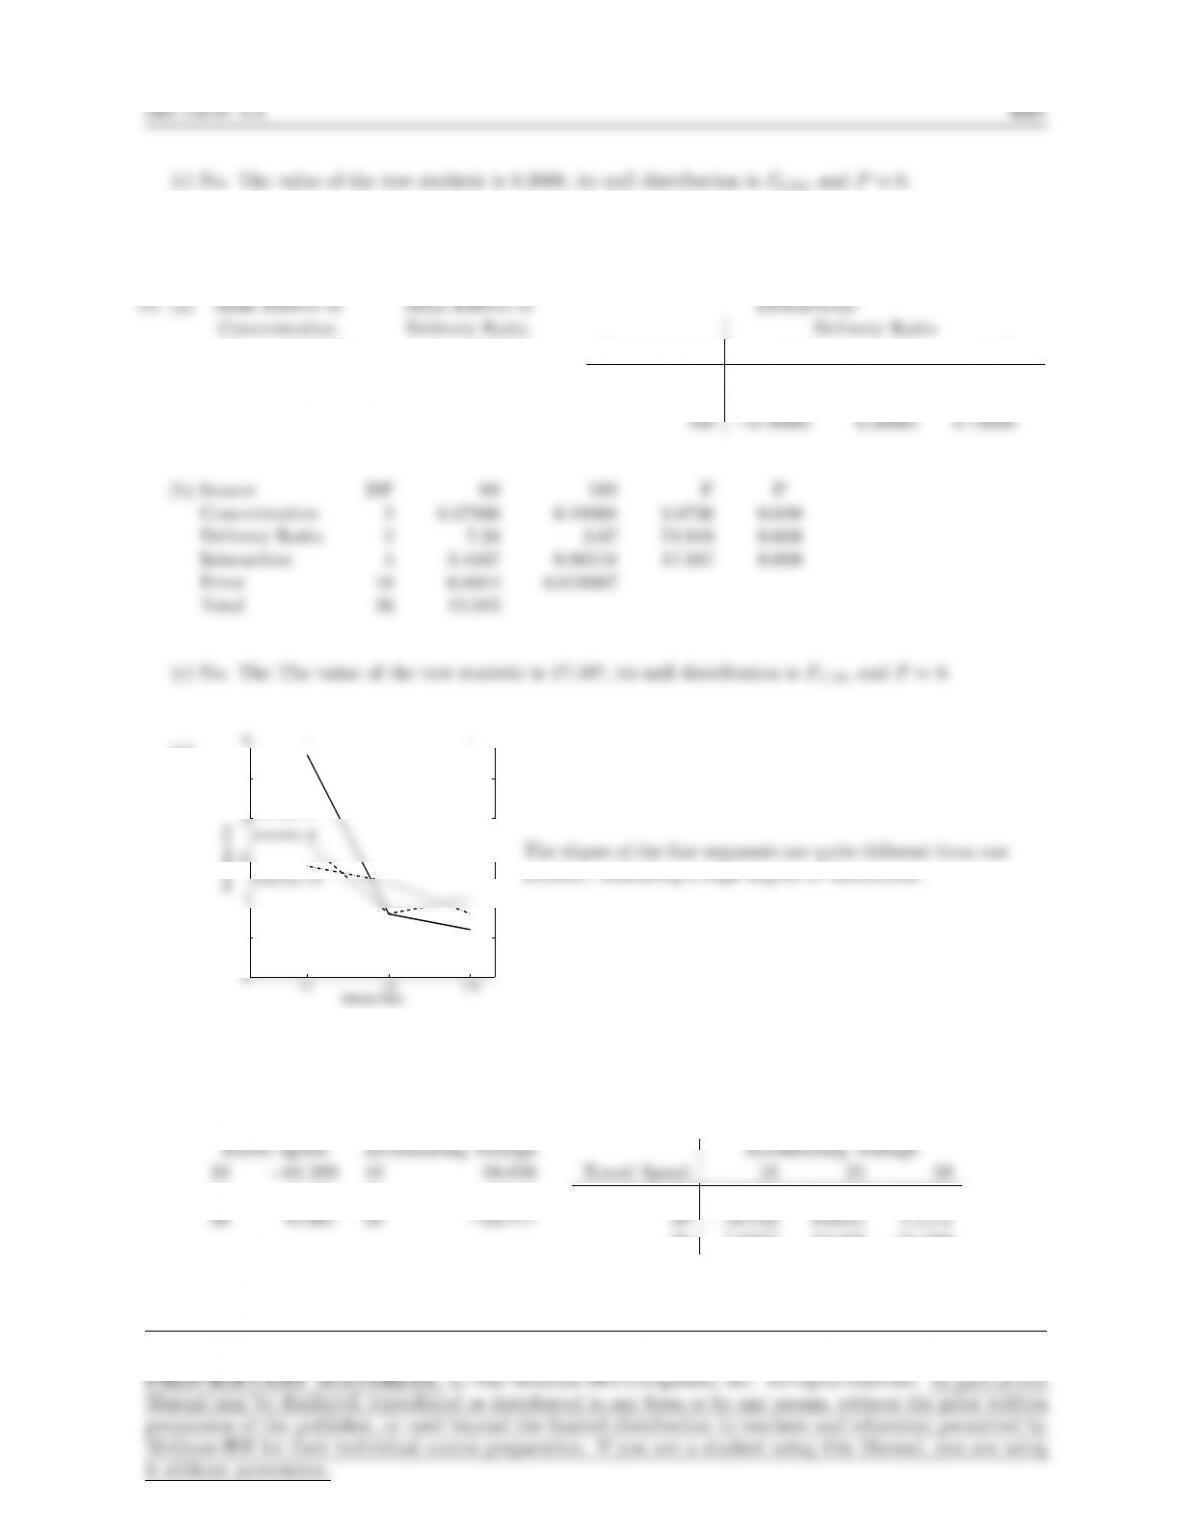
12. (a) Main Effects of
Concentration
15 0.72472
40 −0.32528
100 −0.39944
Main Effects of
Delivery Ratio
1:0 5.2267
1:1 −1.0089
1:5 −2.0422
1:10 −2.1756
Interactions
Delivery Ratio
Concentration 1:0 1:1 1 : 5 1: 10
15 1.6742 0.10972 −0.86028 −0.92361
40 −0.77250 0.056389 0.19306 0.52306
100 −0.90167 −0.16611 0.66722 0.40056
15 0.16667
40 −0.067778
100 −0.098889
1:1 0.73333
1:5 −0.30000
1:10 −0.43333
Concentration 1:1 1 : 5 1 : 10
15 0.66778 −0.30222 −0.36556
40 −0.20111 −0.064444 0.26556
(d)
1:1 1:5 1:10
0
0.5
1
1.5
2
2.5
3
Delivery Ratio
Sorption (%)
concentration = 15
concentration = 40
concentration = 100
The slopes of the line segments are quite different from one
another, indicating a high degree of interaction.
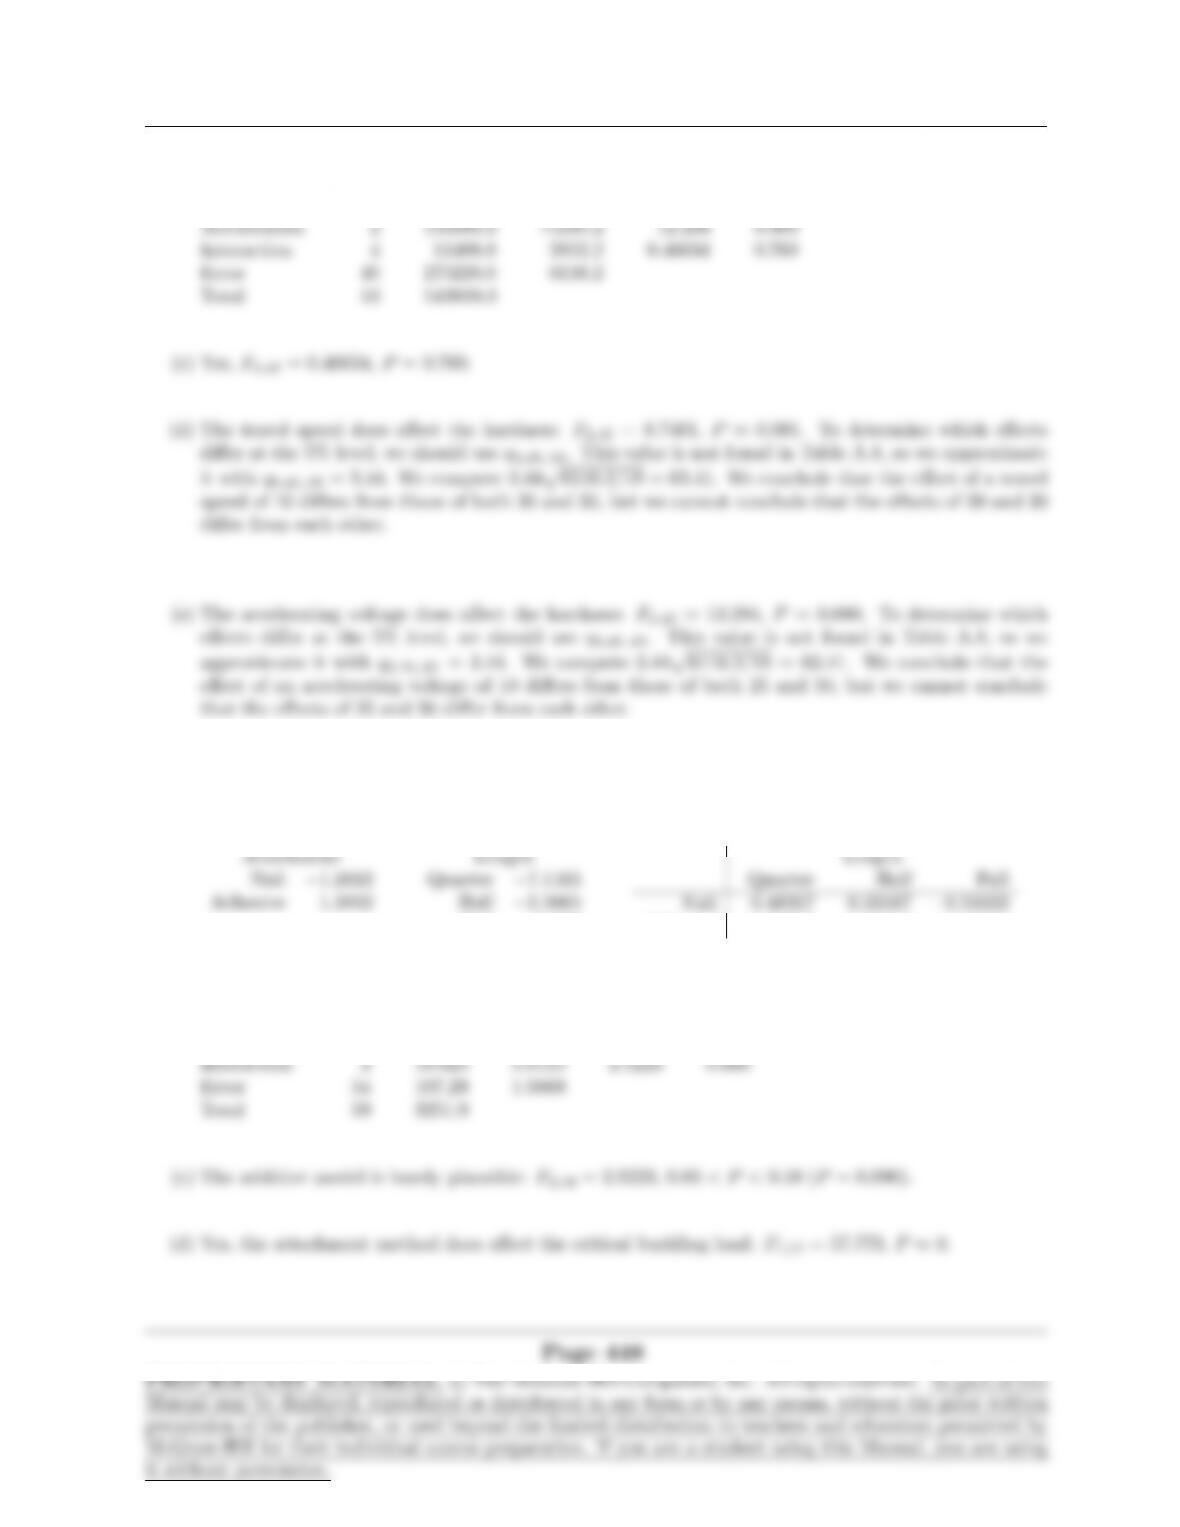
14. (a) Main Effects of
20 18.722
Main Effects of
25 −2.9444
Interactions
10 9.0556 −22.944 13.889
30 7.6667 13.333 −21.000
448 CHAPTER 9
(b) Source DF SS MS F P
Travel Speed 2 106912.1 53456.1 8.7401 0.001
15. (a) Main Effects of
Main Effects of
Full 9.683
Interactions
Adhesive −0.48317 −0.33167 0.51633
(b) Source DF SS MS F P
Attachment 1 114.79 114.79 57.773 0.000
Length 2 3019.8 1509.9 759.94 0.000
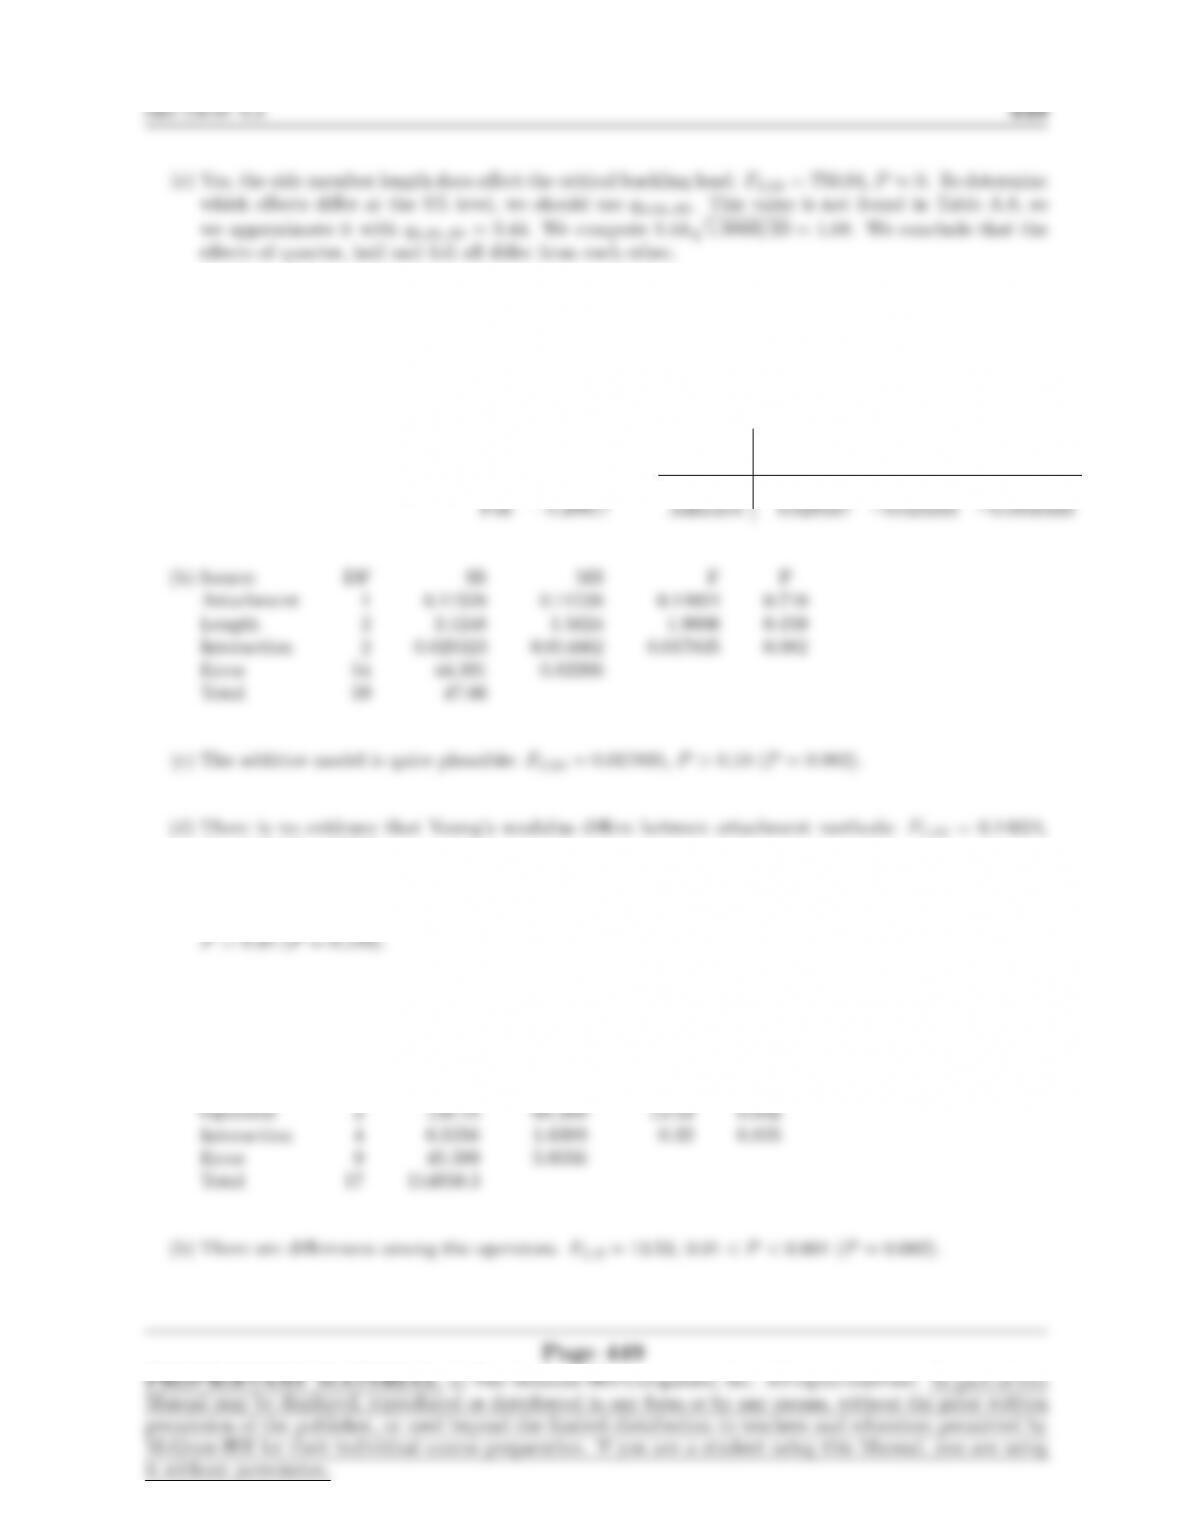
16. (a) Main Effects of
Attachment
Nail −0.043833
Adhesive 0.043833
Main Effects of
Length
Quarter −0.11917
Half 0.31933
Interactions
Length
Quarter Half Full
Nail −0.029167 0.024333 0.0048333
P > 0.10 (P= 0.710).
(e) There is no evidence that Young’s modulus differs among side member lengths: F2,54 = 1.9006,
17. (a) Source DF SS MS F P
Wafer 2 114661.4 57330.7 11340.1 0.000