Unlock document.
This document is partially blurred.
Unlock all pages and 1 million more documents.
Get Access
394 CHAPTER 8
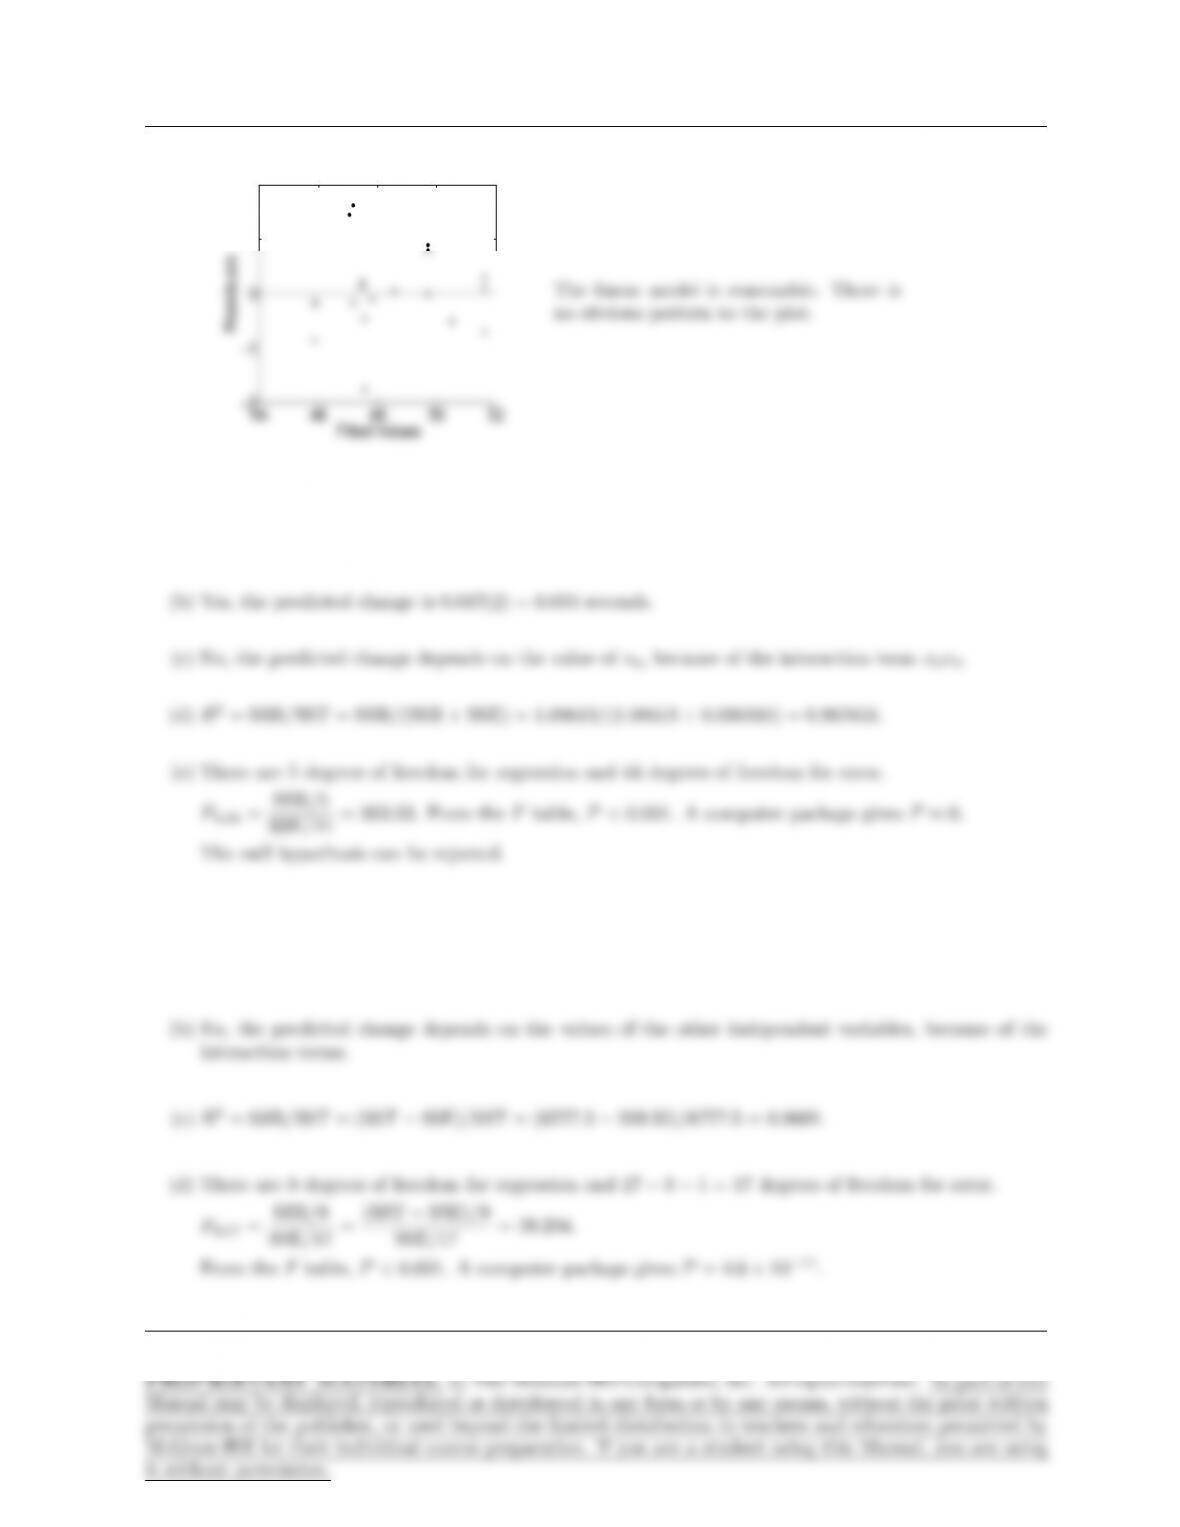
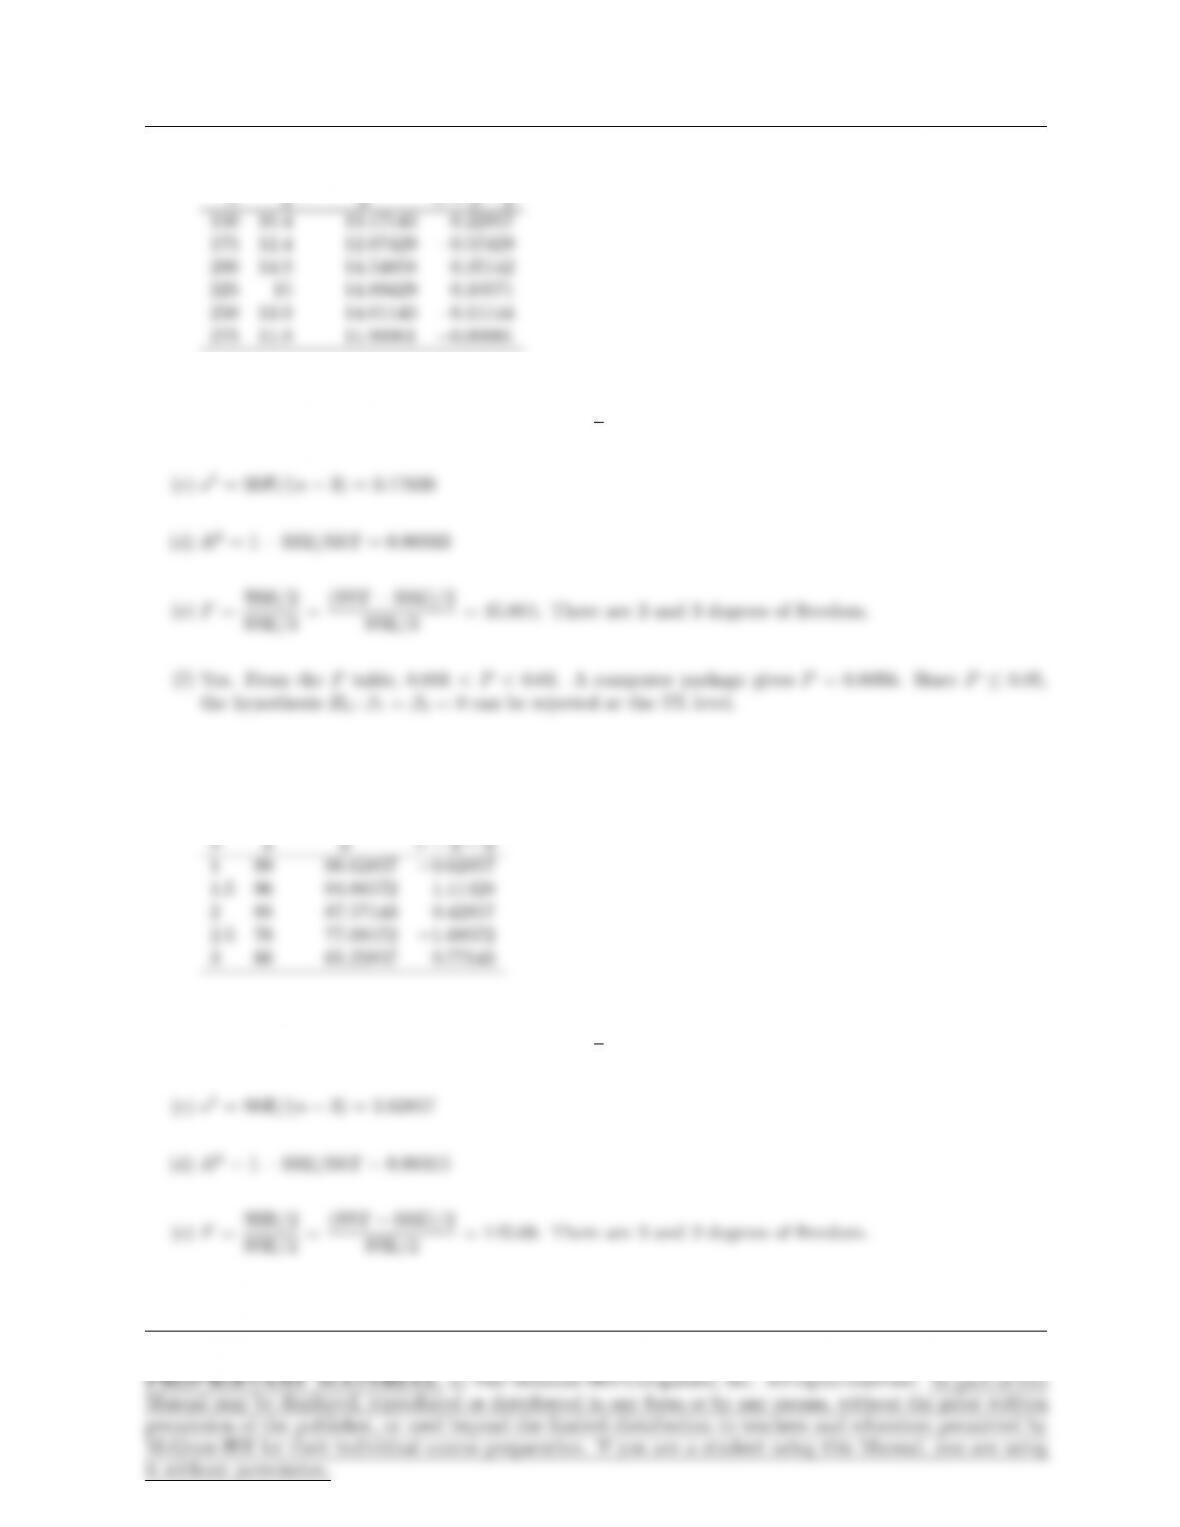
3.
44 46 48 50 52
−2
−1
0
1
2
Fitted Values
Residuals
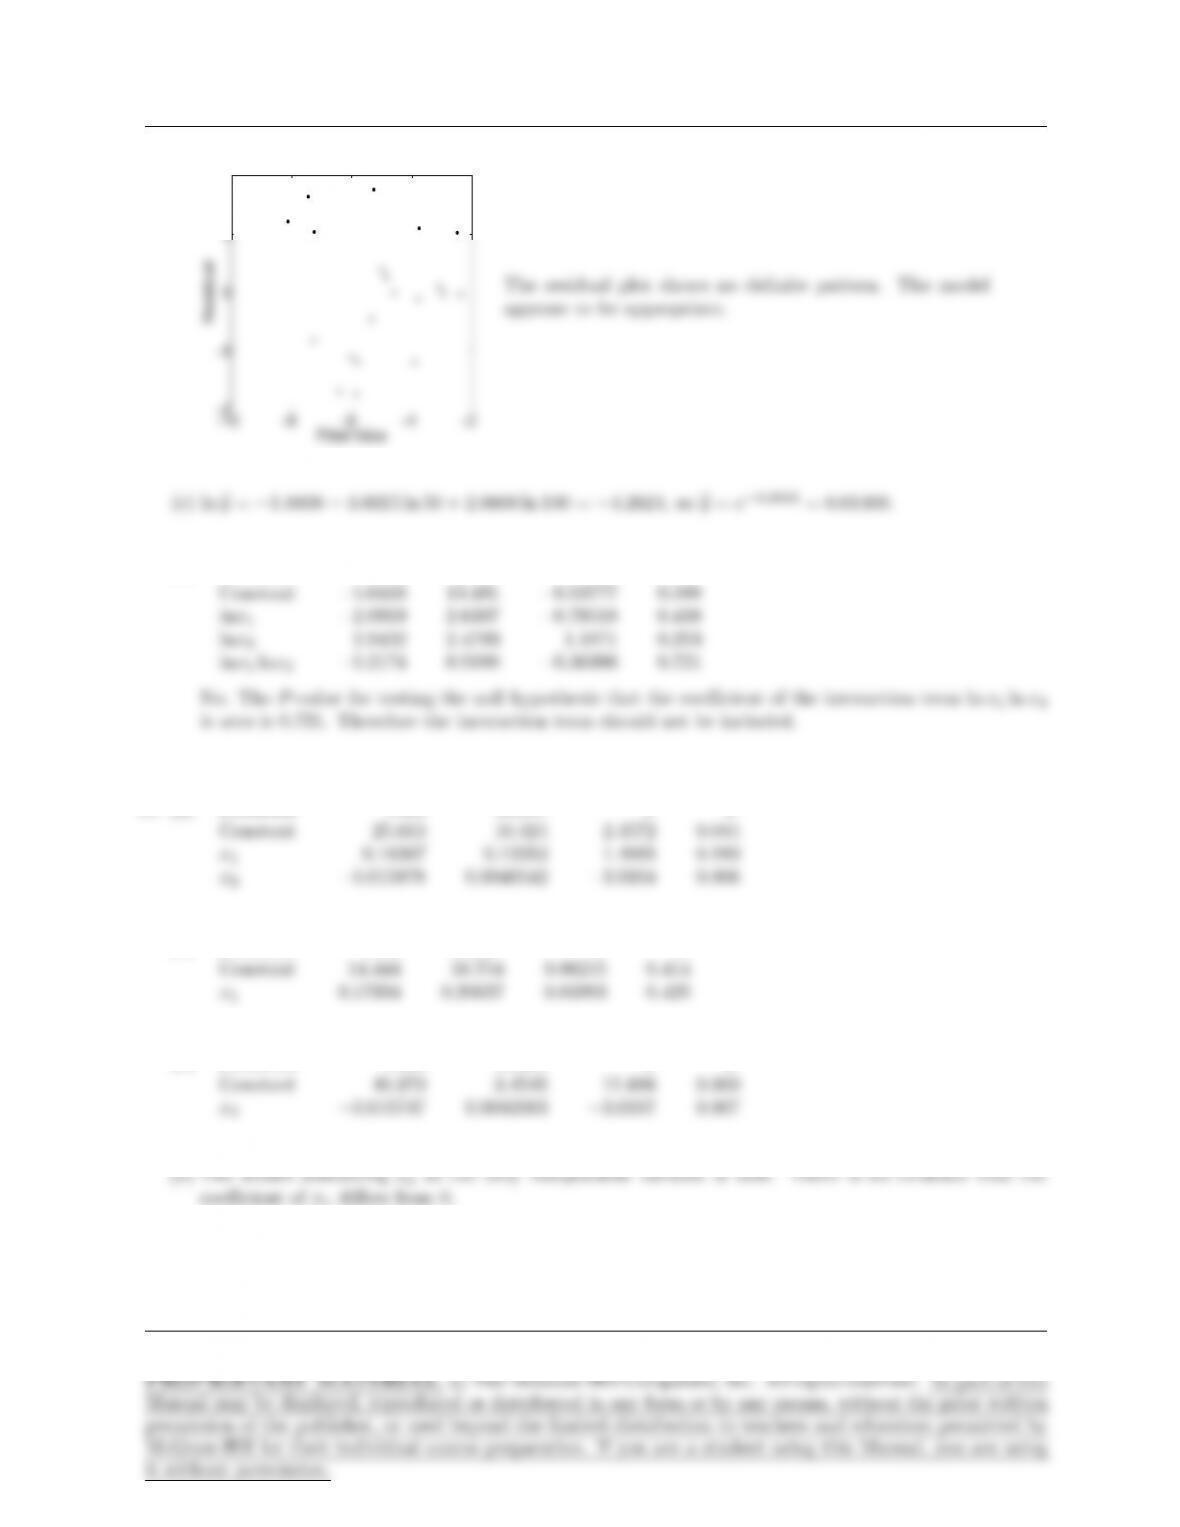
The linear model is reasonable. There is
no obvious pattern to the plot.
4. (a) by=−0.83 + 0.017(20) + 0.0895(17) + 42.771(0.006) + 0.027(10) −0.0043(17)(10) = 0.8271 seconds.
5. (a) by= 56.145 −9.046(3) −33.421(1.5) + 0.243(20) −0.5963(3)(1.5) −0.0394(3)(20) + 0.6022(1.5)(20) +
0.6901(32) + 11.7244(1.52)−0.0097(202) = 25.465.
Page 394
SECTION 8.1 395
6. (a) Yes, the predicted productivity would increase by 151.680 m3.
7. (a) by=−0.21947 + 0.779(2.113) −0.10827(0) + 1.3536(1.4) −0.0013431(730) = 2.3411 liters
8. (a) b
β1= 0.779, sb
β1= 0.04909. There are 160 degrees of freedom for error.
Since the number of degrees of freedom is large, use the ztable to compute a confidence interval.
z.025 = 1.96. A 95% confidence interval is 0.779 ±1.96(0.04909), or (0.6828, 0.8752).
Page 395
396 CHAPTER 8
9. (a) by=−1.7914 + 0.00026626(1500) + 9.8184(1.04) −0.29982(17.5) = 3.572.
10. ln y=β0+β1x1+β2x2+ε, where β0= ln αand ε= ln δ.
11. (a) t=−0.58762/0.2873 = −2.05.
Page 396
SECTION 8.1 397
12. (a) b
β0satisfies the equation 5.91 = b
β0/1.4553, so b
β0= 8.6008.
13. (a) by= 267.53 −1.5926(30) −1.3897(35) −1.0934(30) −0.002658(30)(30) = 135.92◦F
14. ln p=β0+β1t+β2(1/t) + β3ln t+ε, where ε= ln δ.
15. (a) The residuals are the values ei=yi−byifor each i. They are shown in the following table.
Page 397
398 CHAPTER 8
Fitted Value Residual
x y by e =y−by
(b) SSE = P6
i=1 e2
i= 0.52914, SST = Pn
i=1(yi−y)2= 16.70833.
16. (a) The residuals are the values ei=yi−byifor each i. They are shown in the following table.
Fitted Value Residual
(b) SSE = P6
i=1 e2
i= 5.25714, SST = Pn
i=1(yi−y)2= 768.
Page 398
SECTION 8.1 399
17. (a) by= 1.18957 + 0.17326(0.5) + 0.17918(5.7) + 0.17591(3.0) −0.18393(4.1) = 2.0711.
18. (a) Predictor Coef StDev T P
19. (a) Predictor Coef StDev T P
(b) b
β2= 2.9205, sb
β2= 0.038261. There are n−3 = 7 degrees of freedom.
Page 399

400 CHAPTER 8
Section 8.2
1. (a) Predictor Coef StDev T P
(c) Predictor Coef StDev T P
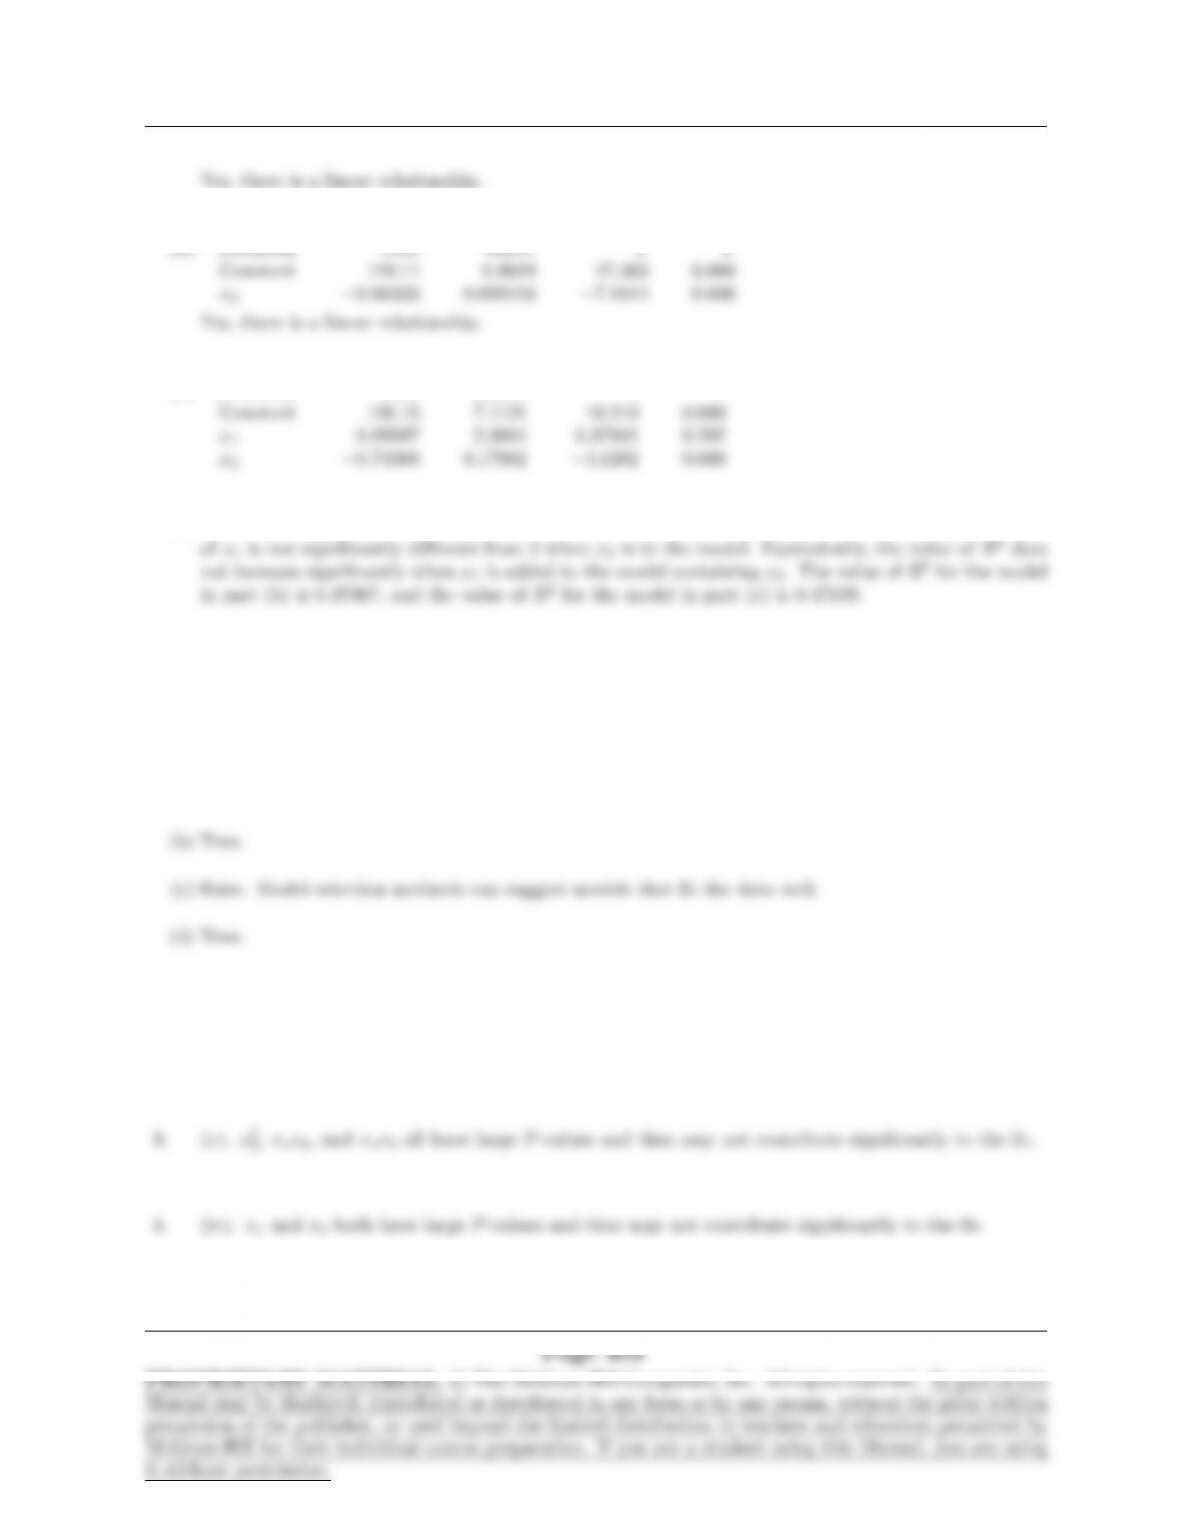
2. Torque and HP are most nearly collinear. We can tell because their coefficients are significantly
3. (a) Plot (i) came from Engineer B, and plot (ii) came from Engineer A. We know this because the variables
Page 400
SECTION 8.2 401
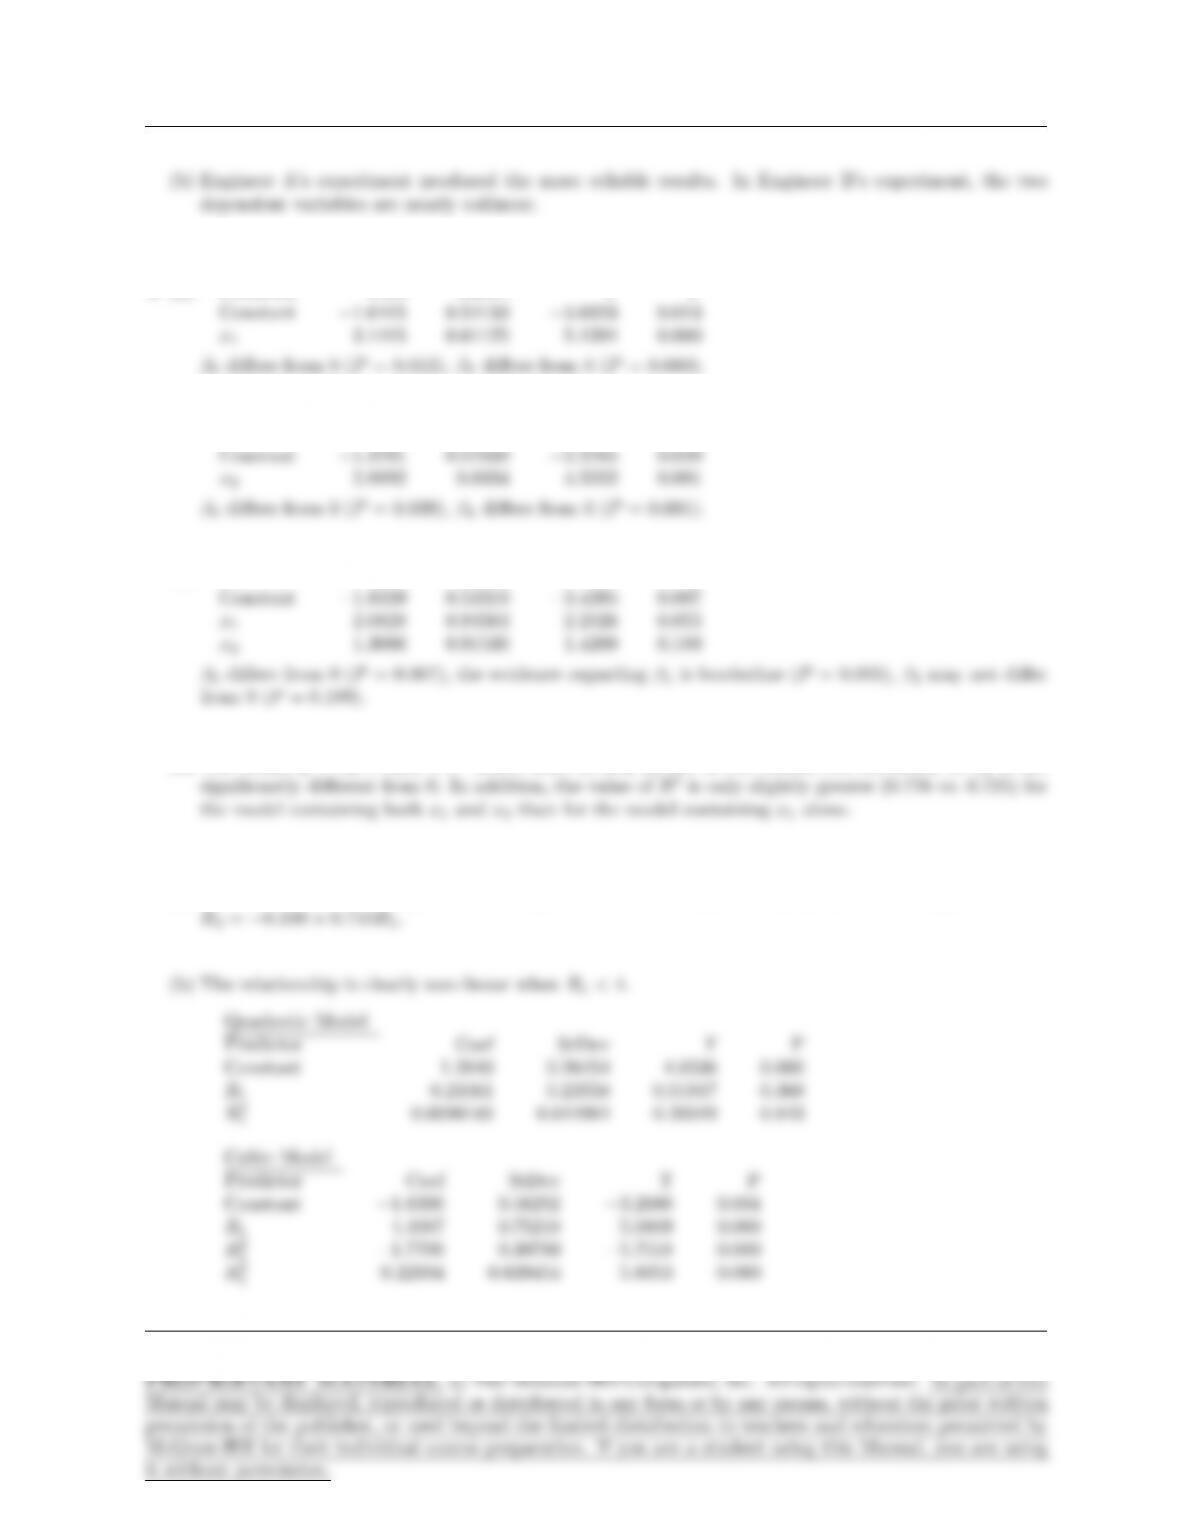
4. (a) Predictor Coef StDev T P
(b) Predictor Coef StDev T P
(c) Predictor Coef StDev T P
(d) The model y=β0+β1x1+ε. When both x1and x2are in the model, the coefficient of x2is not
5. (a) For R1<4, the least squares line is R2= 1.233 + 0.264R1. For R1≥4, the least squares line is
Page 401
402 CHAPTER 8
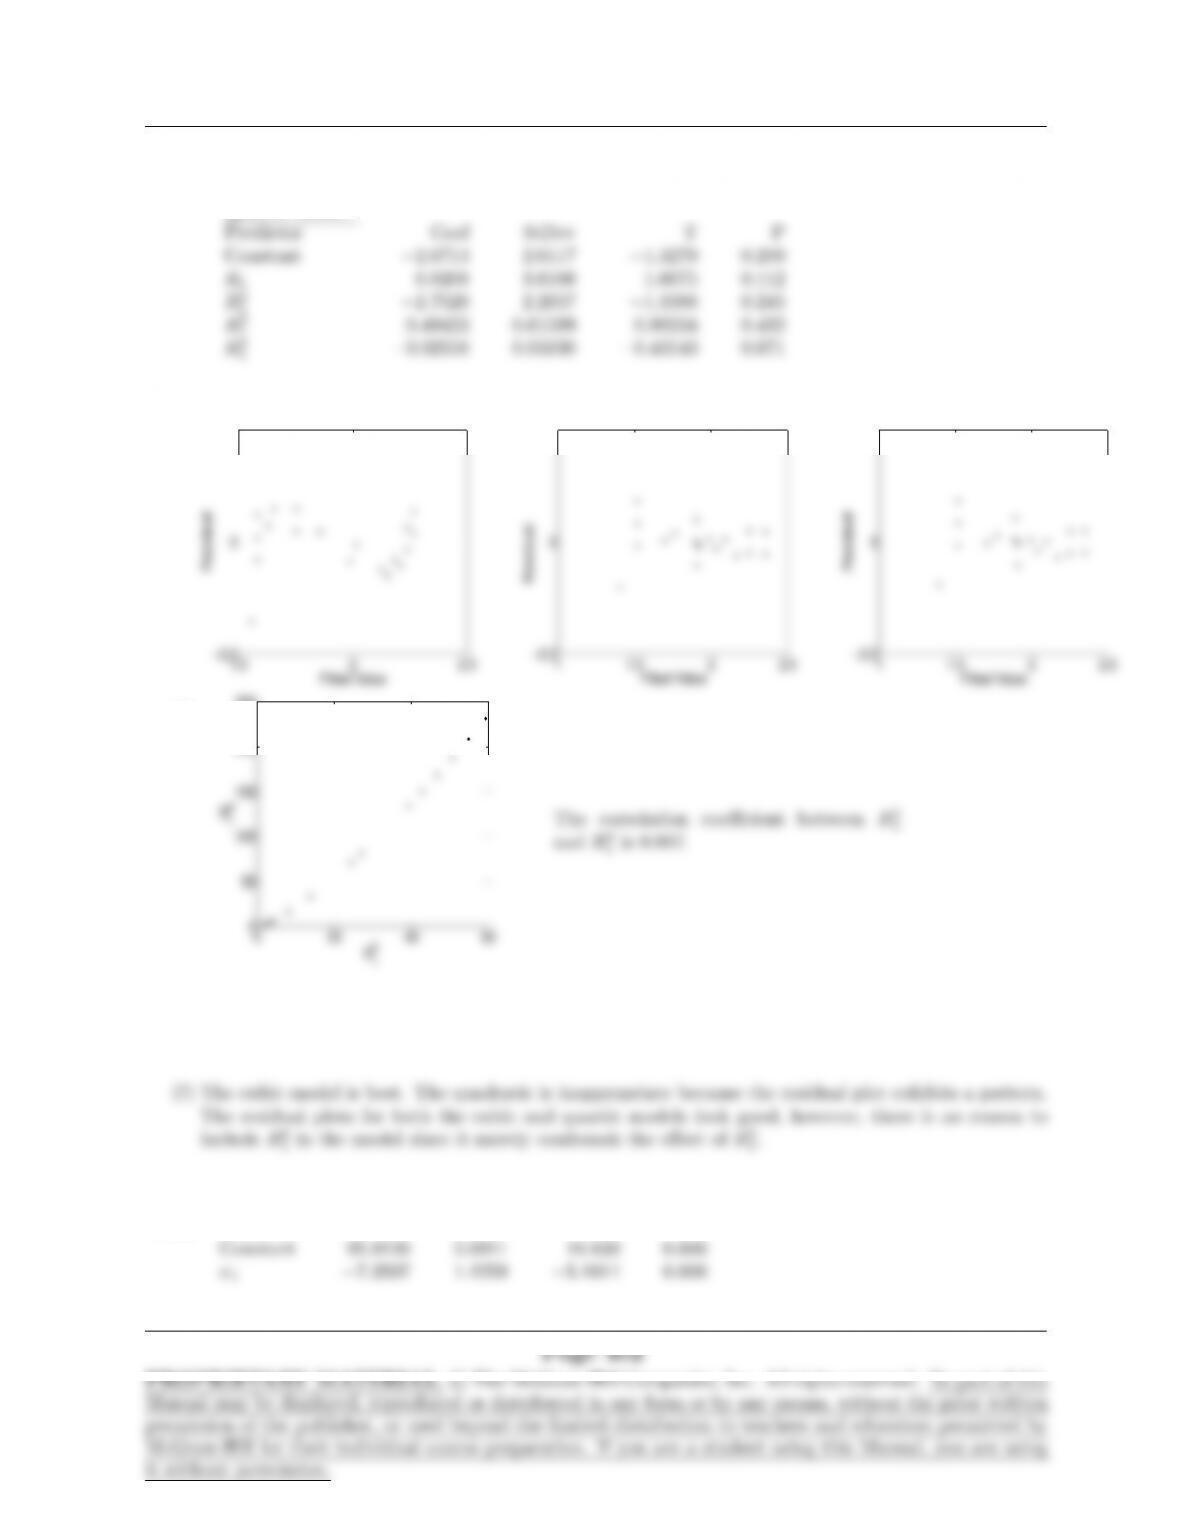
Quartic Model
(c)
1.5 2 2.5
−0.5
0
0.5
Fitted Value
Residual
Quadratic Model
1 1.5 2 2.5
−0.5
0
0.5
Fitted Value
Residual
Cubic Model
1 1.5 2 2.5
−0.5
0
0.5
Fitted Value
Residual
Quartic Model
(d)
0 20 40 60
0
50
100
150
200
250
R1
3
R1
4
The correlation coefficient between R3
1
and R4
1is 0.997.
(e) R3
1and R4
1are nearly collinear.
6. (a) Predictor Coef StDev T P
SECTION 8.3 403
(b) Predictor Coef StDev T P
(c) Predictor Coef StDev T P
(d) x2. If x2were known, it would not be much additional help to know x1. The value of the coefficient
Section 8.3
1. (a) False. There are usually several models that are about equally good.
2. (iii). x1x2,x1x3, and x2x3all have large P-values and thus may not contribute significantly to the fit.

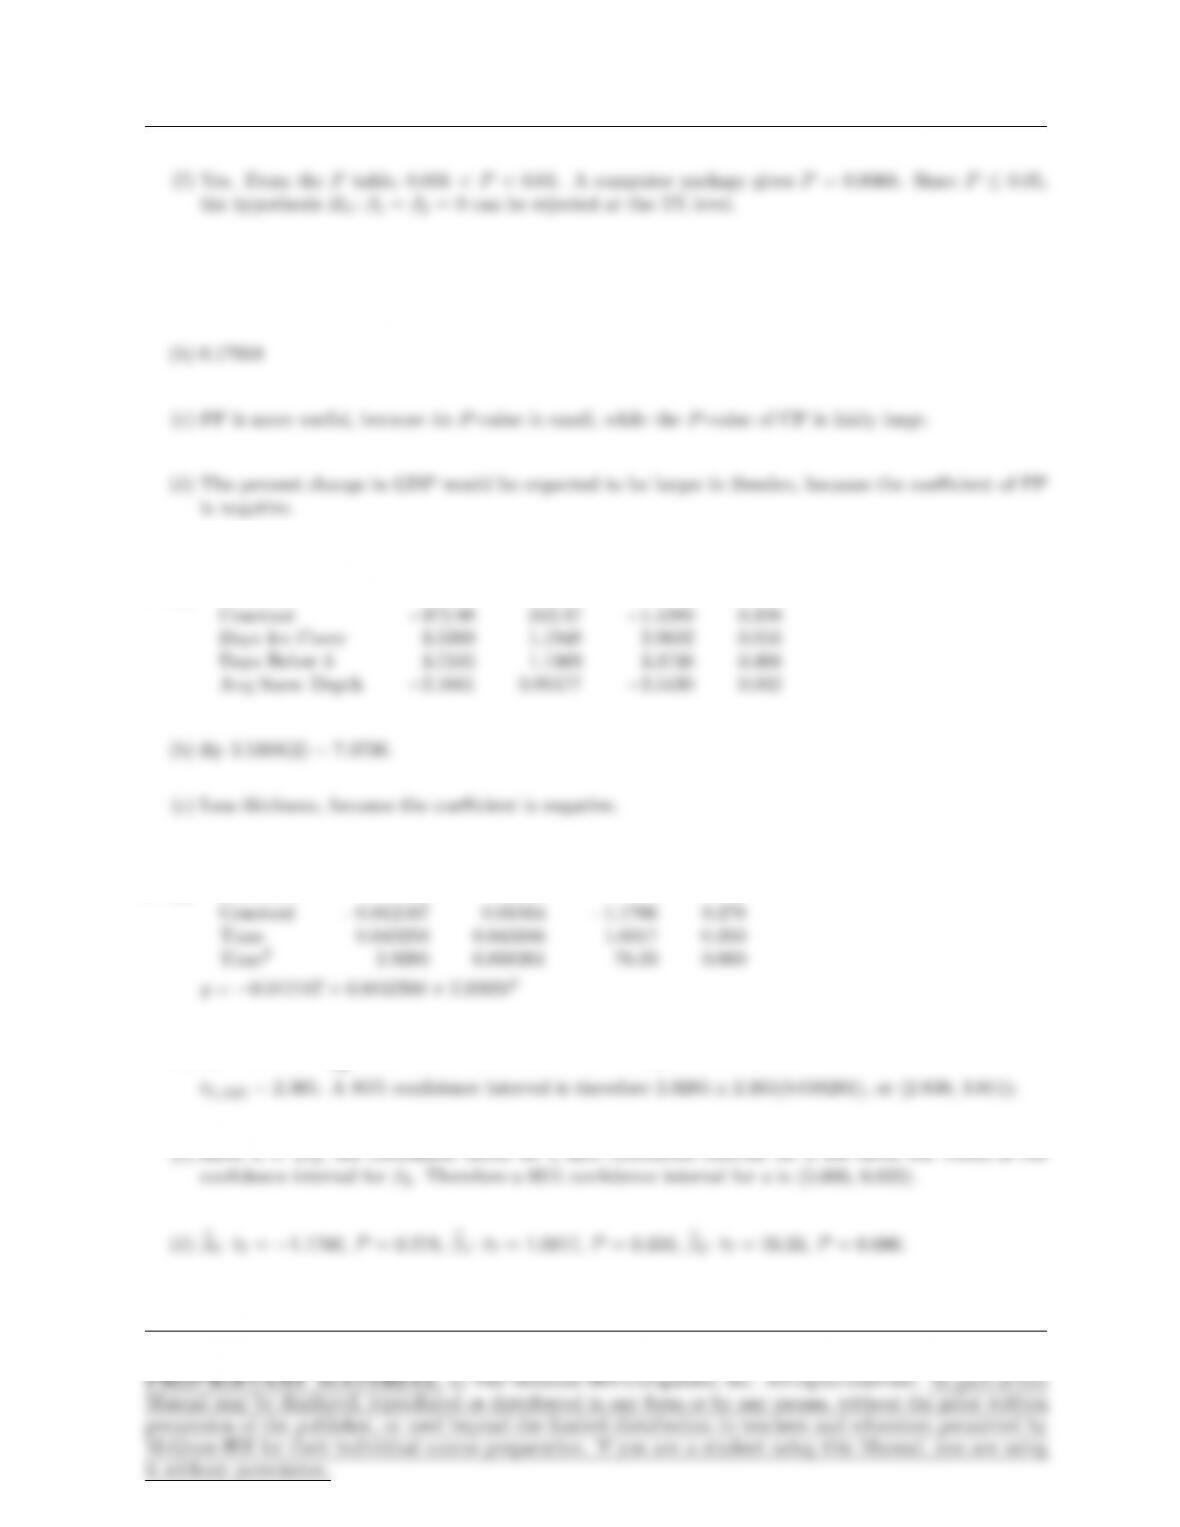
6. (a) X1,X3, and X4
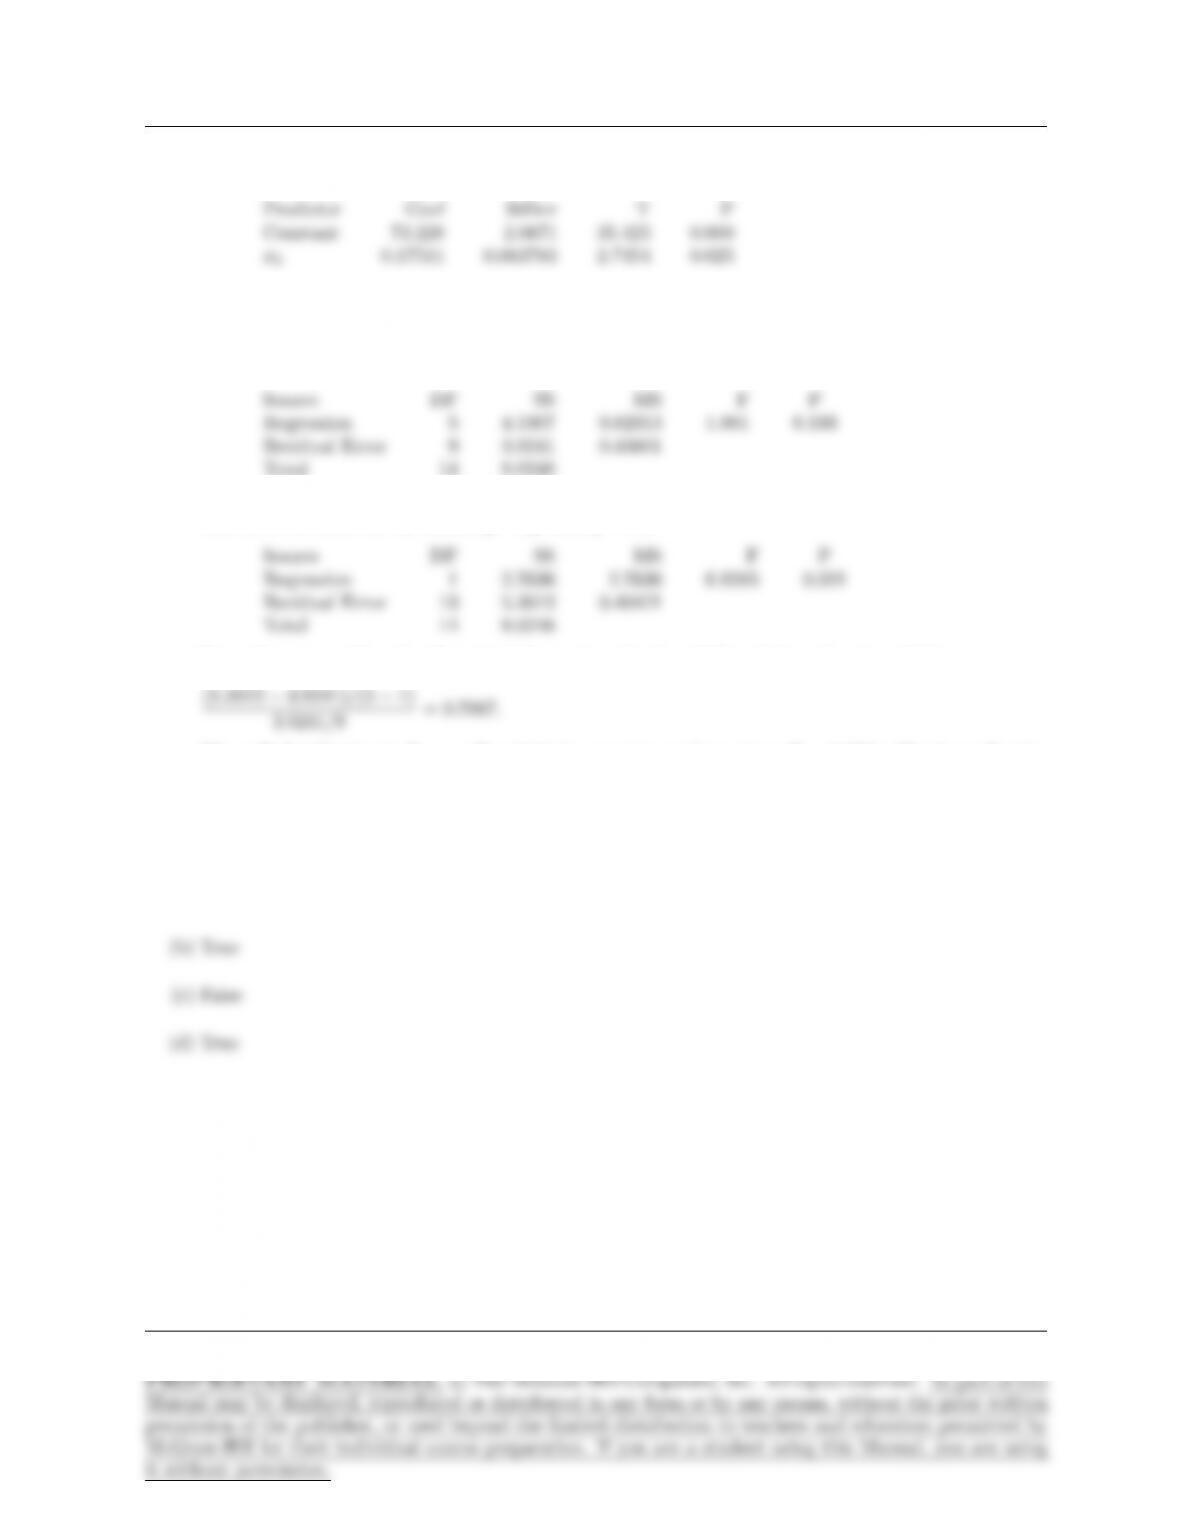
8. (a) Predictor Coef StDev T P
Constant 2.7782 0.27081 10.259 0.000
Distance −1.6303 0.24637 −6.6174 0.001
Page 404
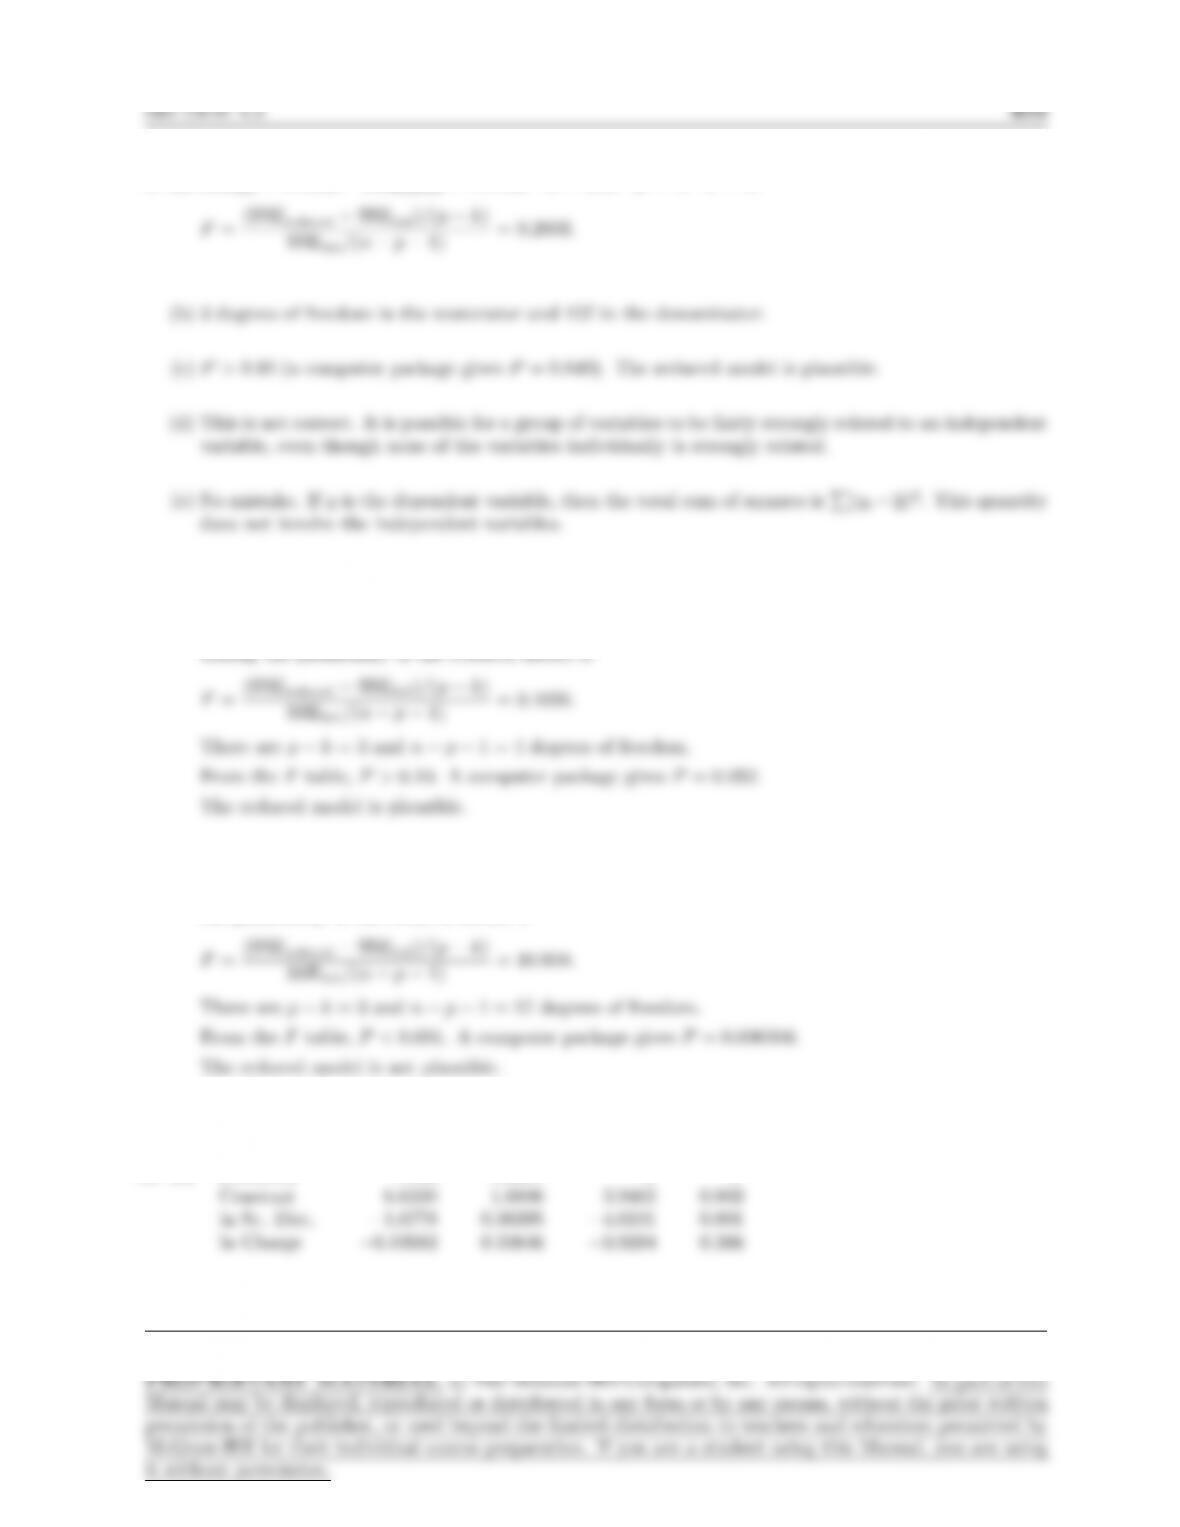
9. (a) SSEfull = 7.7302, SSEreduced = 7.7716, n= 165, p= 7, k= 4.
10. SSEfull = 62.068, SSEreduced = 66.984, n= 10, p= 5, k= 2. The value of the Fstatistic for
testing the plausibility of the reduced model is
11. SSEfull = 9.37, SSEreduced = 27.49, n= 24, p= 6, k= 3. The value of the Fstatistic for testing
the plausibility of the reduced model is
12. (a) Predictor Coef StDev T P
Page 405
406 CHAPTER 8
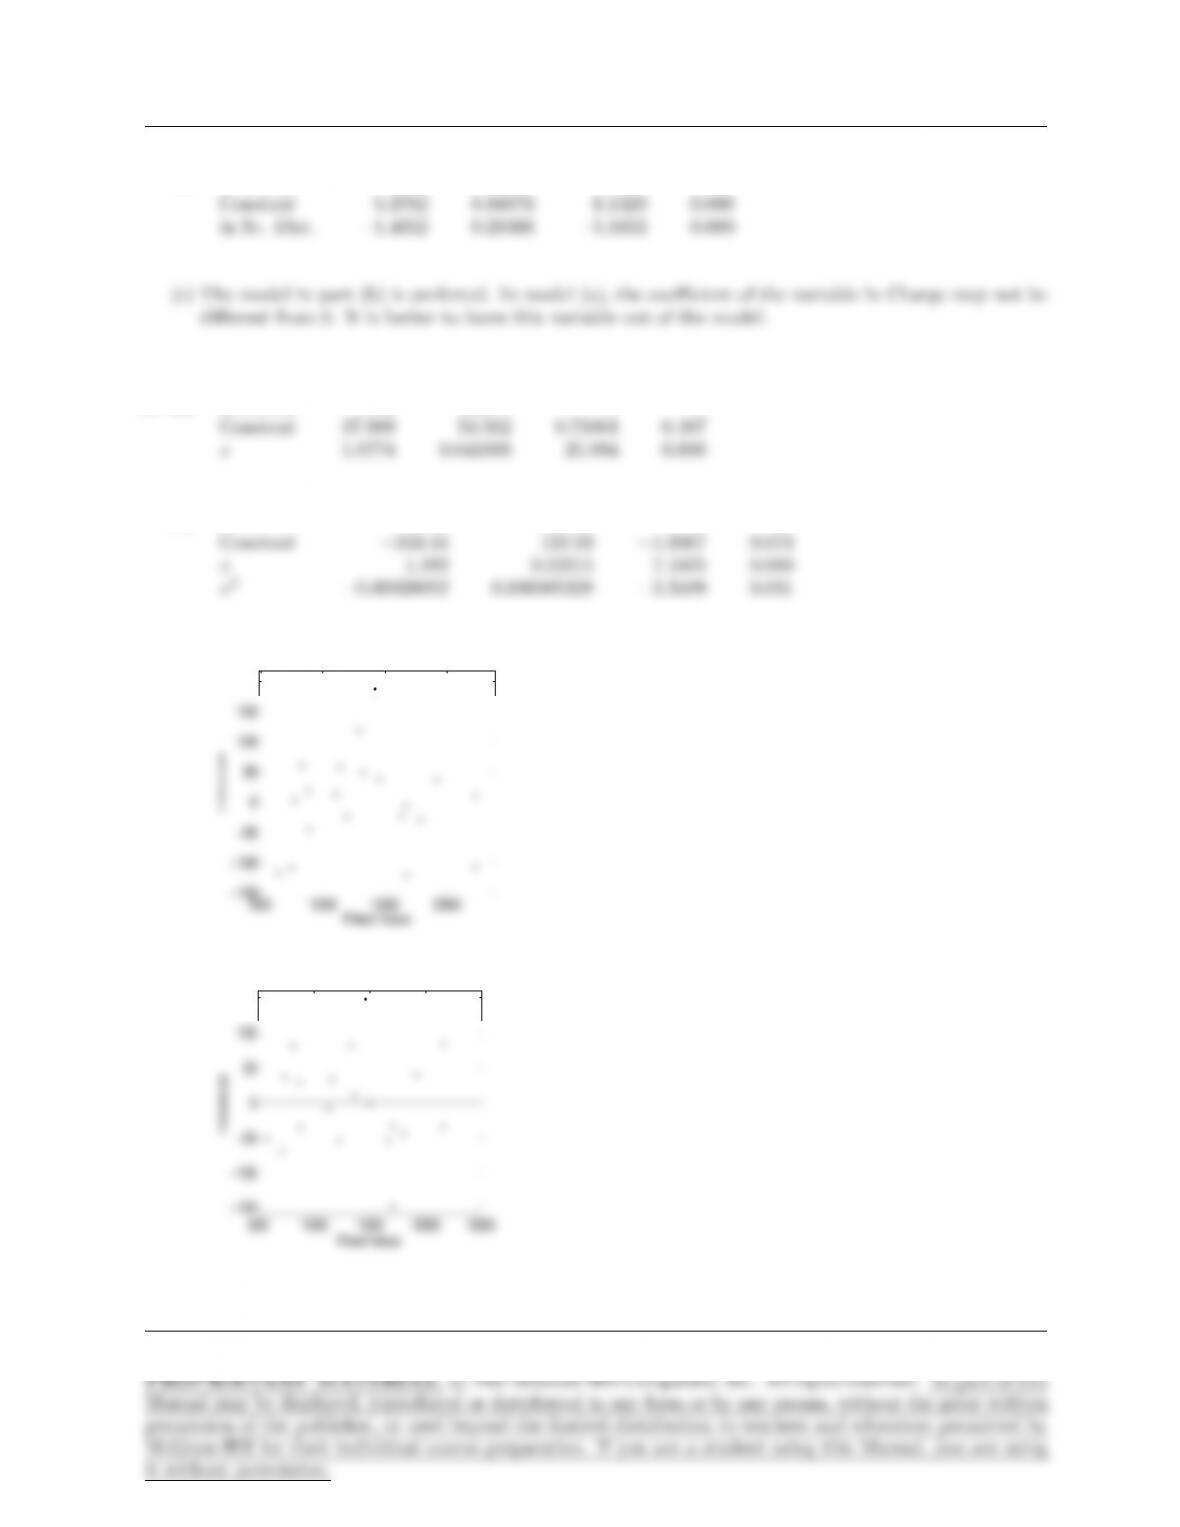
(b) Predictor Coef StDev T P
13. (a) Predictor Coef StDev T P
(b) Predictor Coef StDev T P
(c)
500 1000 1500 2000
−150
−100
−50
0
50
100
150
200
Fitted Value
Residual
Linear Model
(d)
500 1000 1500 2000 2500
−150
−100
−50
0
50
100
150
Fitted Value
Residual
Quadratic Model
Page 406
SECTION 8.3 407
(e) The quadratic model seems more appropriate. The P-value for the quadratic term is fairly small
(0.031), and the residual plot for the quadratic model exhibits less pattern. (There are a couple of
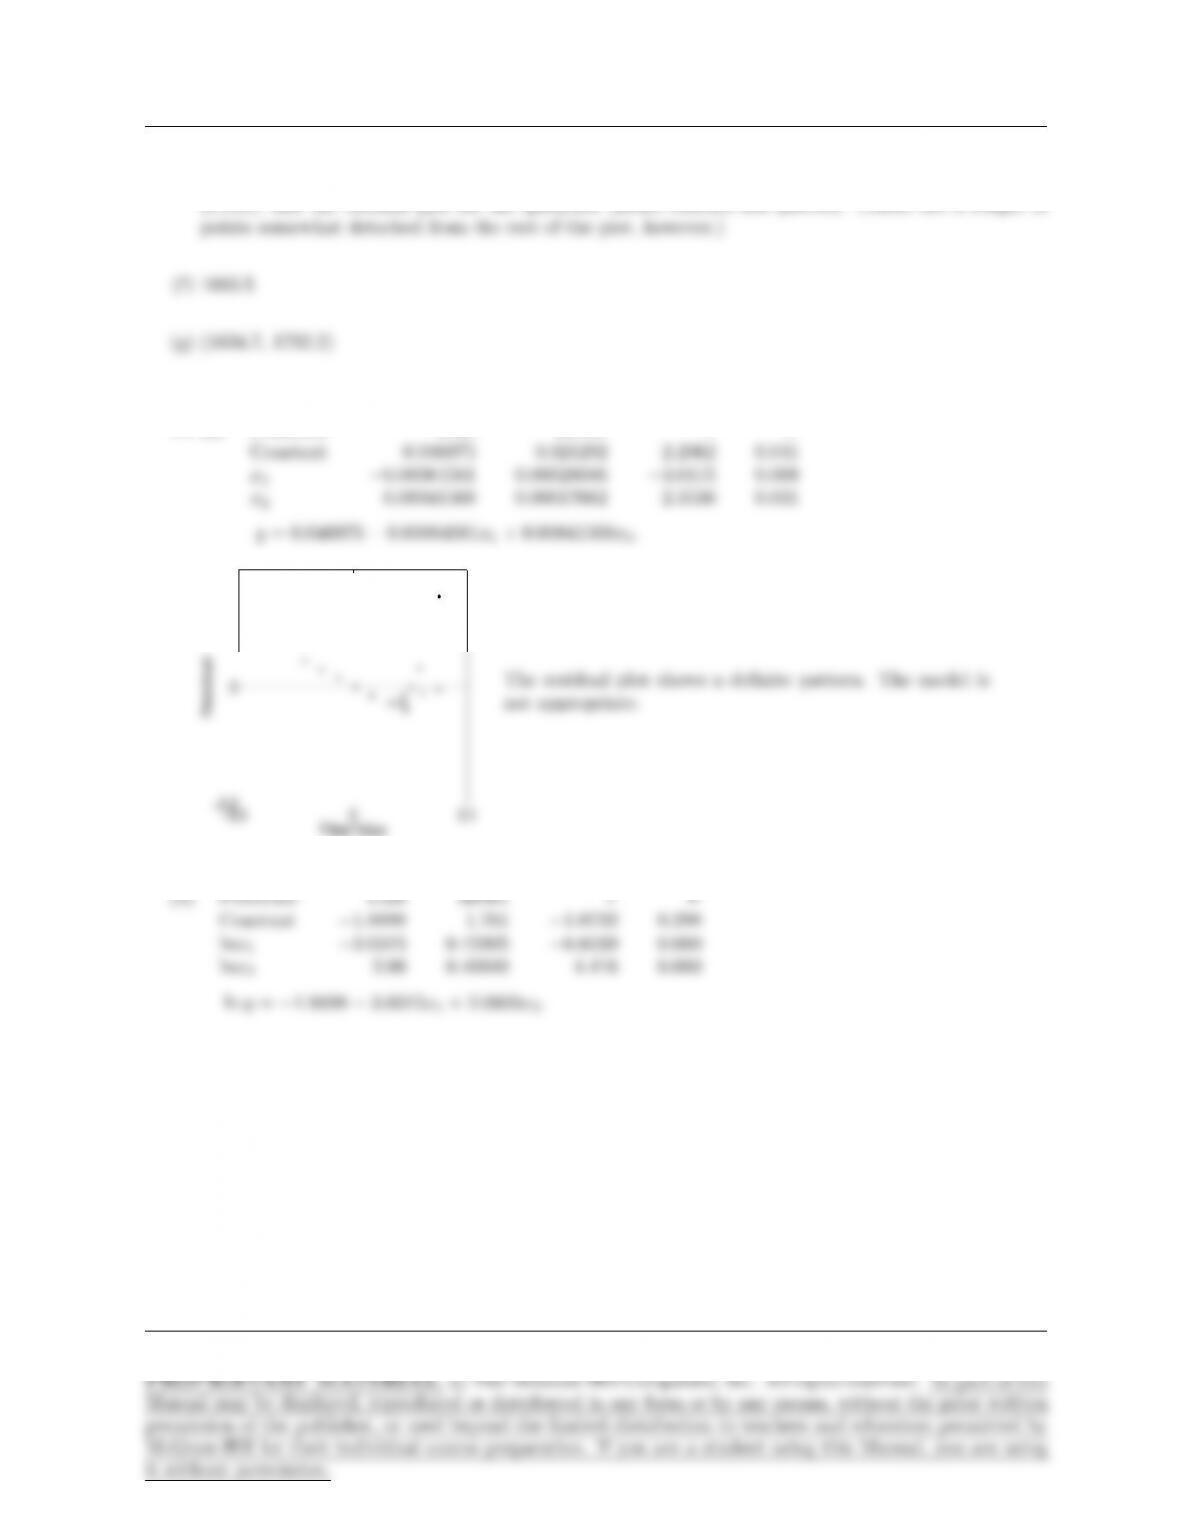
14. (a) Predictor Coef StDev T P
408 CHAPTER 8
−10 −8 −6 −4 −2
−2
−1
0
1
2
Fitted Value
Residual
The residual plot shows no definite pattern. The model
appears to be appropriate.
(c) ln by=−1.8898 −3.0315 ln 50 + 2.0600 ln 100 = −4.2624, so by=e−4.2624 = 0.01409.
(d) Predictor Coef StDev T P
15. (a) Predictor Coef StDev T P
(b) Predictor Coef StDev T P
(c) Predictor Coef StDev T P
Page 408
SUPPLEMENTARY EXERCISES FOR CHAPTER 8 409
16. Answers will vary. One good model is y= 73.228 + 0.17511x2.
17. The model y=β0+β1x2+εis a good one. One way to see this is to compare the fit of this model
to the full quadratic model. The ANOVA table for the full model is
The ANOVA table for the model y=β0+β1x2+εis
From these two tables, the Fstatistic for testing the plausibility of the reduced model is
The null distribution is F4,9, so P > 0.10 (a computer package gives P= 0.573). The large P-value
indicates that the reduced model is plausible.
18. (a) False
Supplementary Exercises for Chapter 8
1. (a) by= 46.802 −130.11(0.15) −807.10(0.01) + 3580.5(0.15)(0.01) = 24.6%.
Page 409

410 CHAPTER 8
2. (a) b
β1=−130.11, sb
(b) b
β2=−807.10, sb
β2= 158.03.
(c) b
β3= 3580.5, sb
β3= 958.05.
(d) b
β1=−130.11, sb
β1= 20.467.
(e) b
β2=−807.10, sb
β2= 158.03.
3. (a) b
β0satisfies the equation 0.59 = b
β0/0.3501, so b
β0= 0.207.
SUPPLEMENTARY EXERCISES FOR CHAPTER 8 411
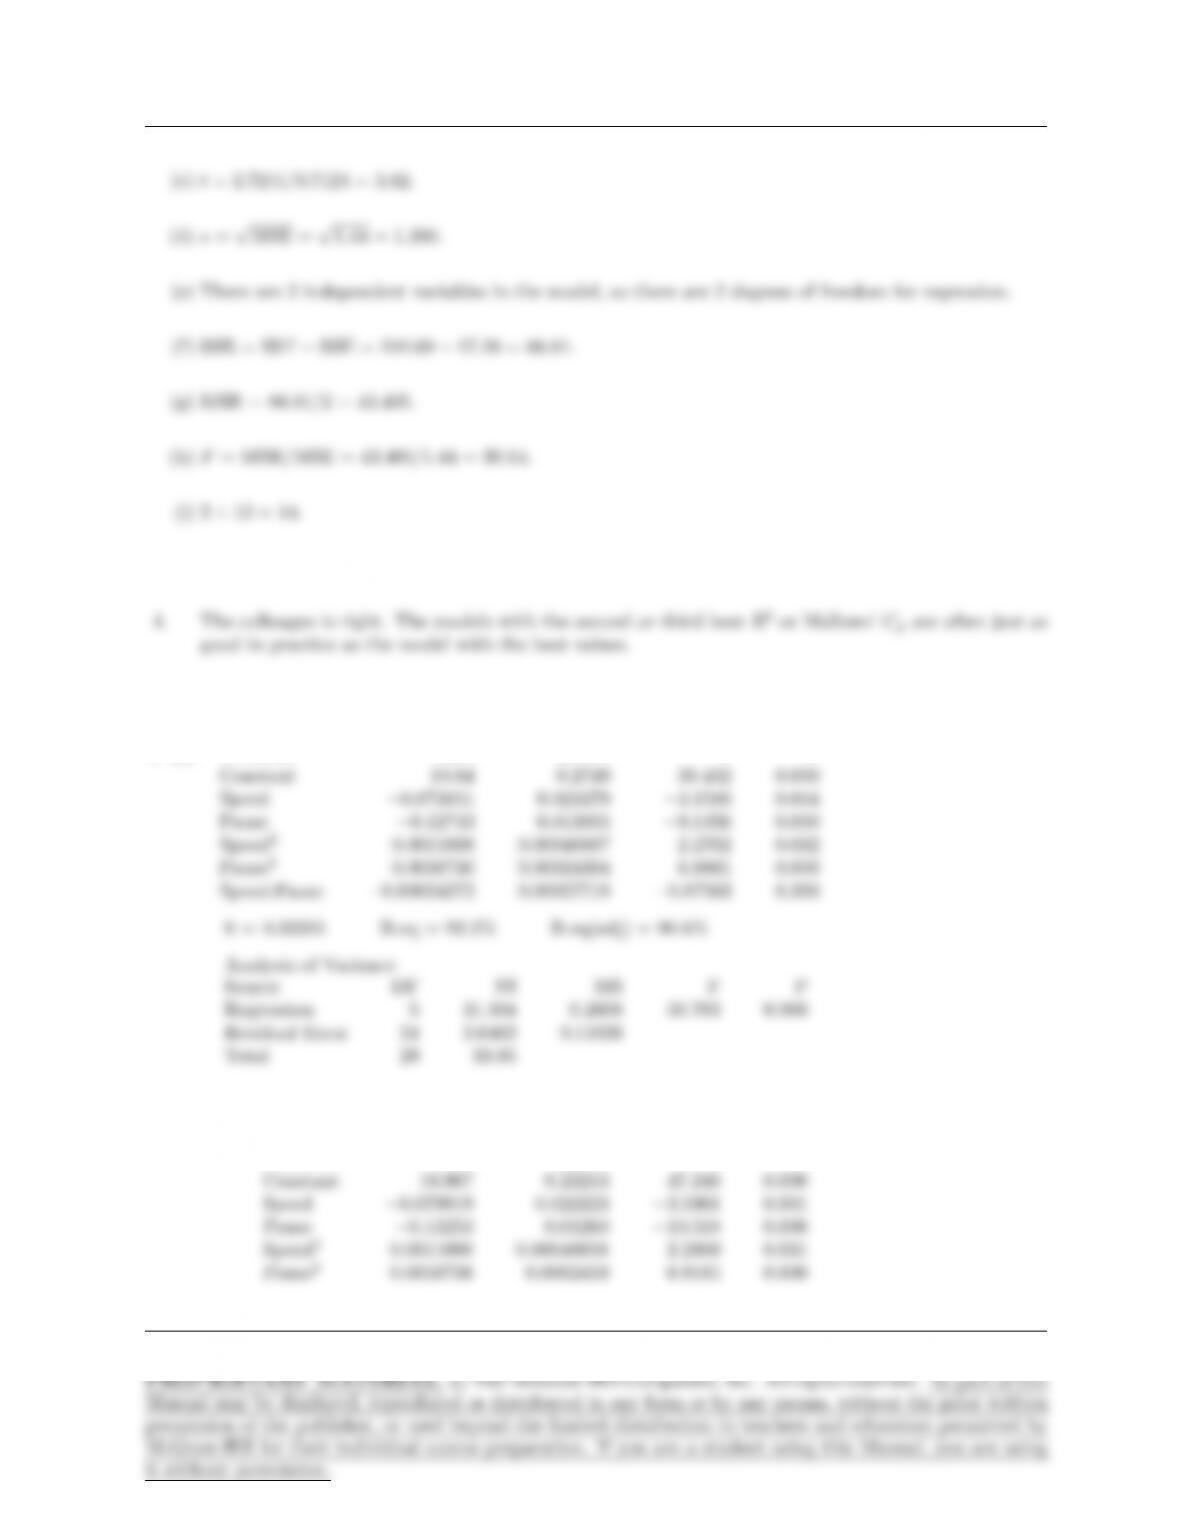
5. (a) Predictor Coef StDev T P
(b) We drop the interaction term Speed·Pause.
Predictor Coef StDev T P
Page 411


