368 CHAPTER 7
11. The width of a confidence interval is proportional to sby=ss1
n+(x−x)2
Pn
i=1(xi−x)2.
12. The mean temperature is (x) = 65.0. Since 60◦C is closest to (x), its confidence interval would be the
shortest. Since 45◦C is furthest from (x), its confidence interval would be the longest.
15. (a) t= 1.71348/6.69327 = 0.256.
16. (a) b
β0satisfies the equation 0.688 = b
β0/0.43309, so b
β0= 0.29797.
Page 368
SECTION 7.4 369
(c) t= 0.18917/0.065729 = 2.878.
17. (a) by= 106.11 + 0.1119(4000) = 553.71.
(d) There is a greater amount of vertical spread on the right side of the plot than on the left.
Section 7.4
1. (a) ln y=−0.4442 + 0.79833 ln x
Page 369
2. (a)
6 7 8 9
−2
−1
0
1
2
Fitted Value
Residual
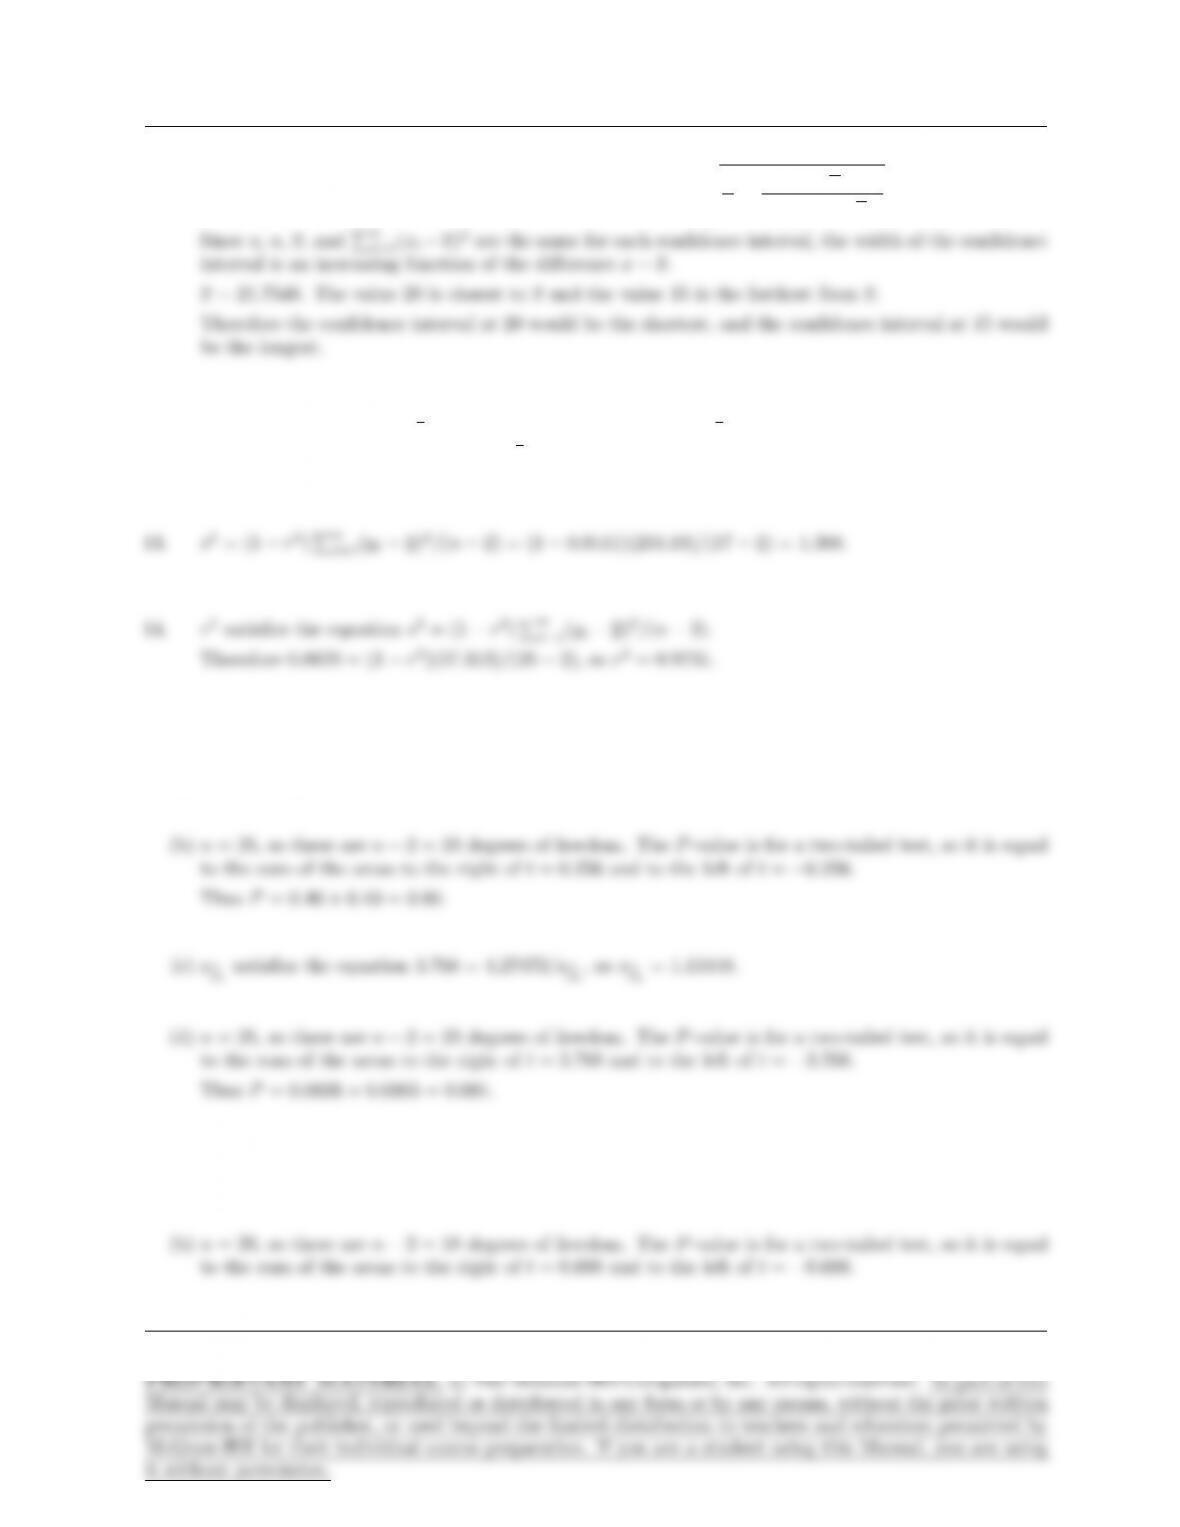
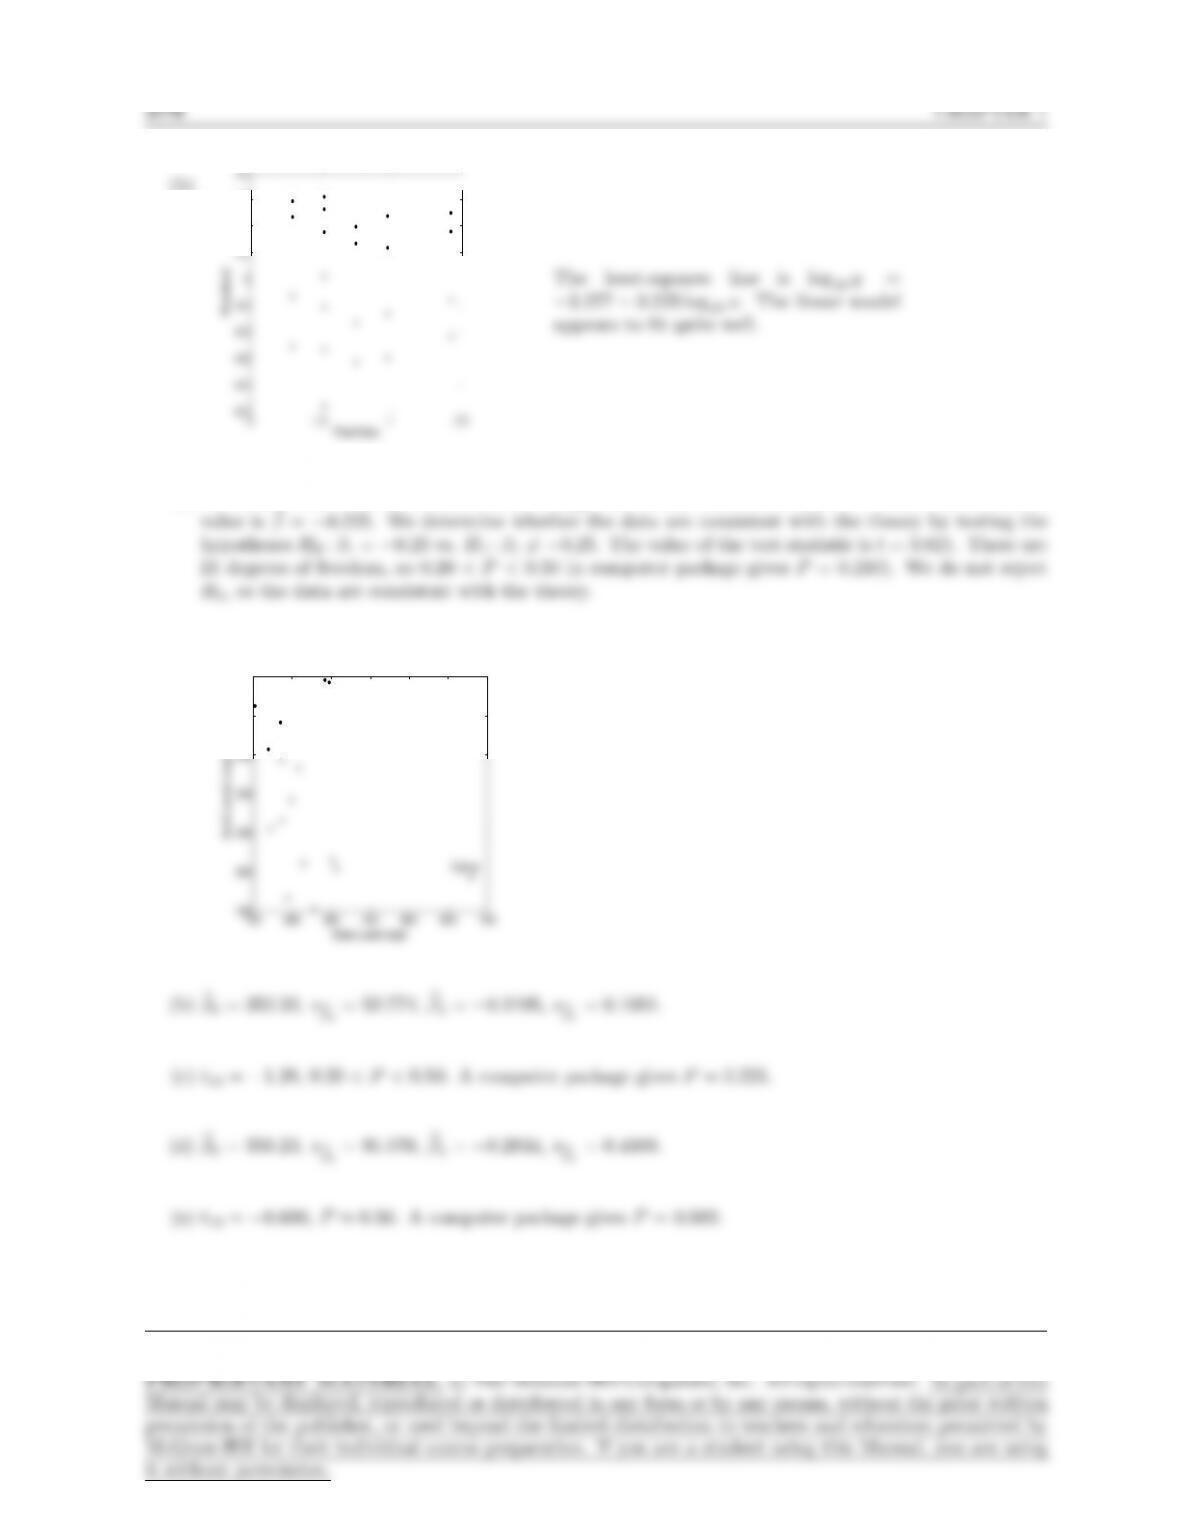
The least-squares line is y= 5.576 + 0.0142x. The linear
model is not appropriate. The point (276.02, 9.36) is highly
influential.
(b)
345678910
−0.4
−0.2
0
0.2
0.4
Fitted Value
Residual
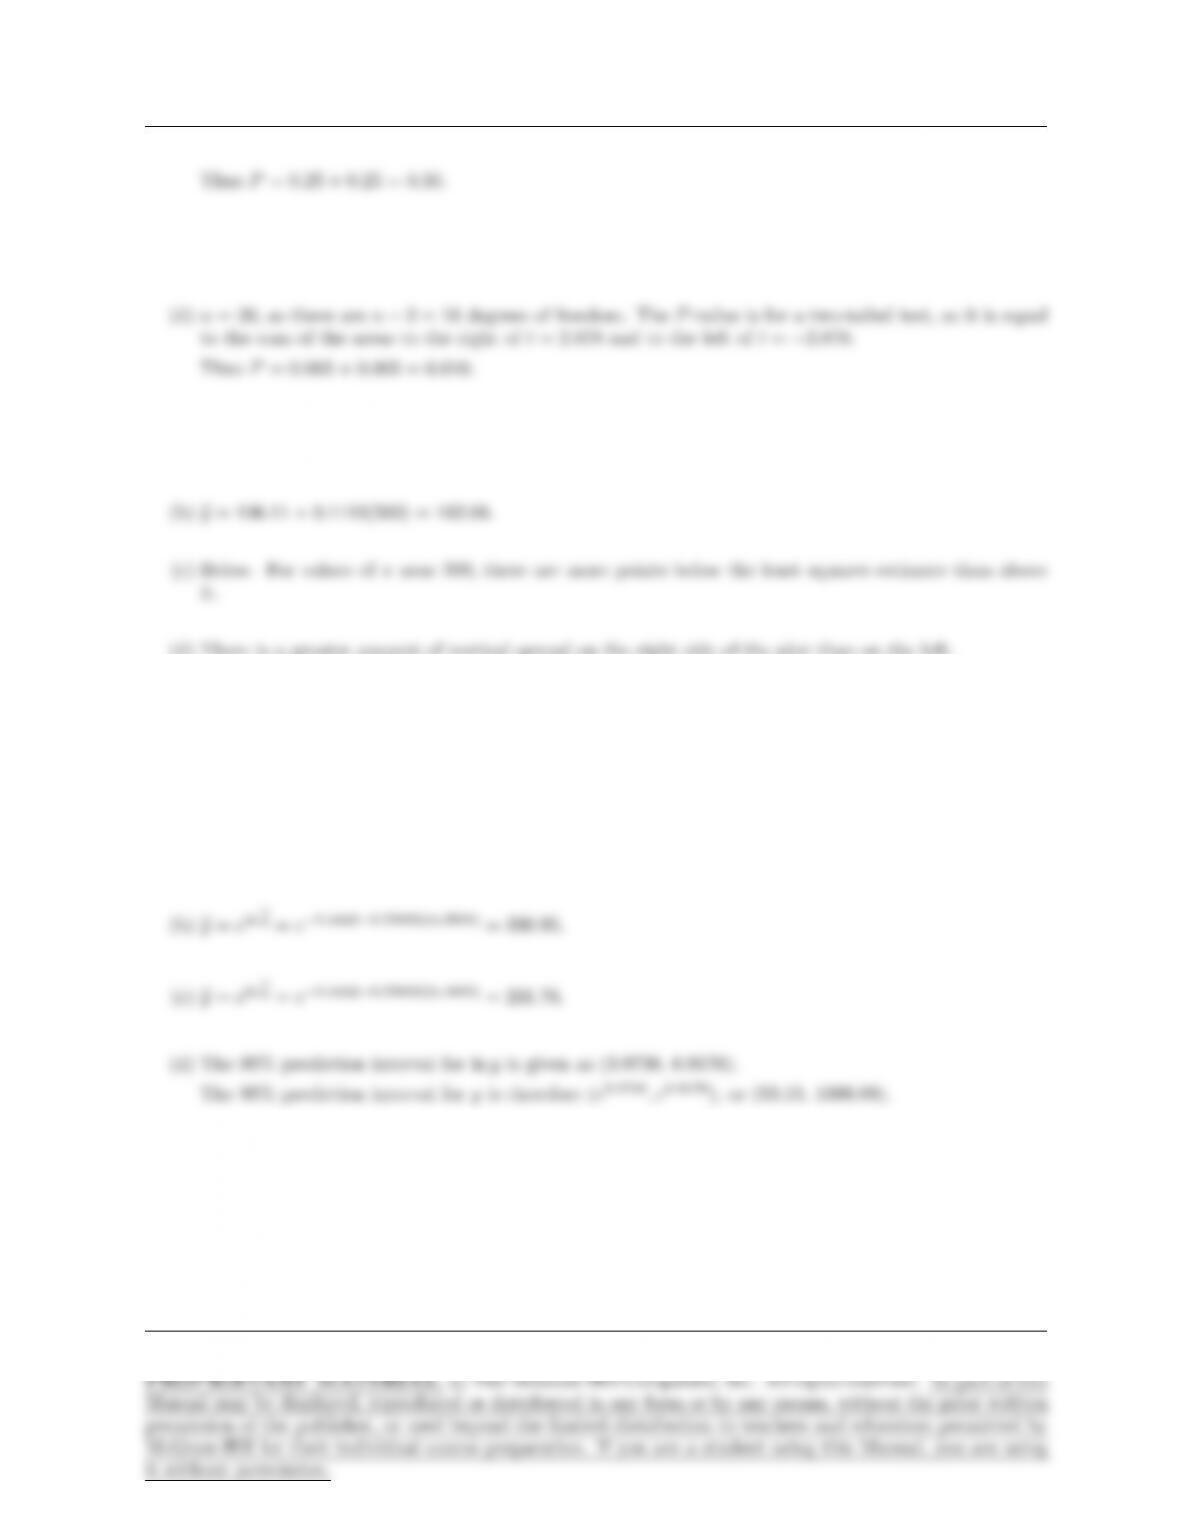
The least-squares line is y= 6.148 + 0.629 ln x. The linear
model appears to be appropriate.
(c)
5 6 7 8 9 10
−2
−1.5
−1
−0.5
0
0.5
1
1.5
2
Fitted Value
Residual
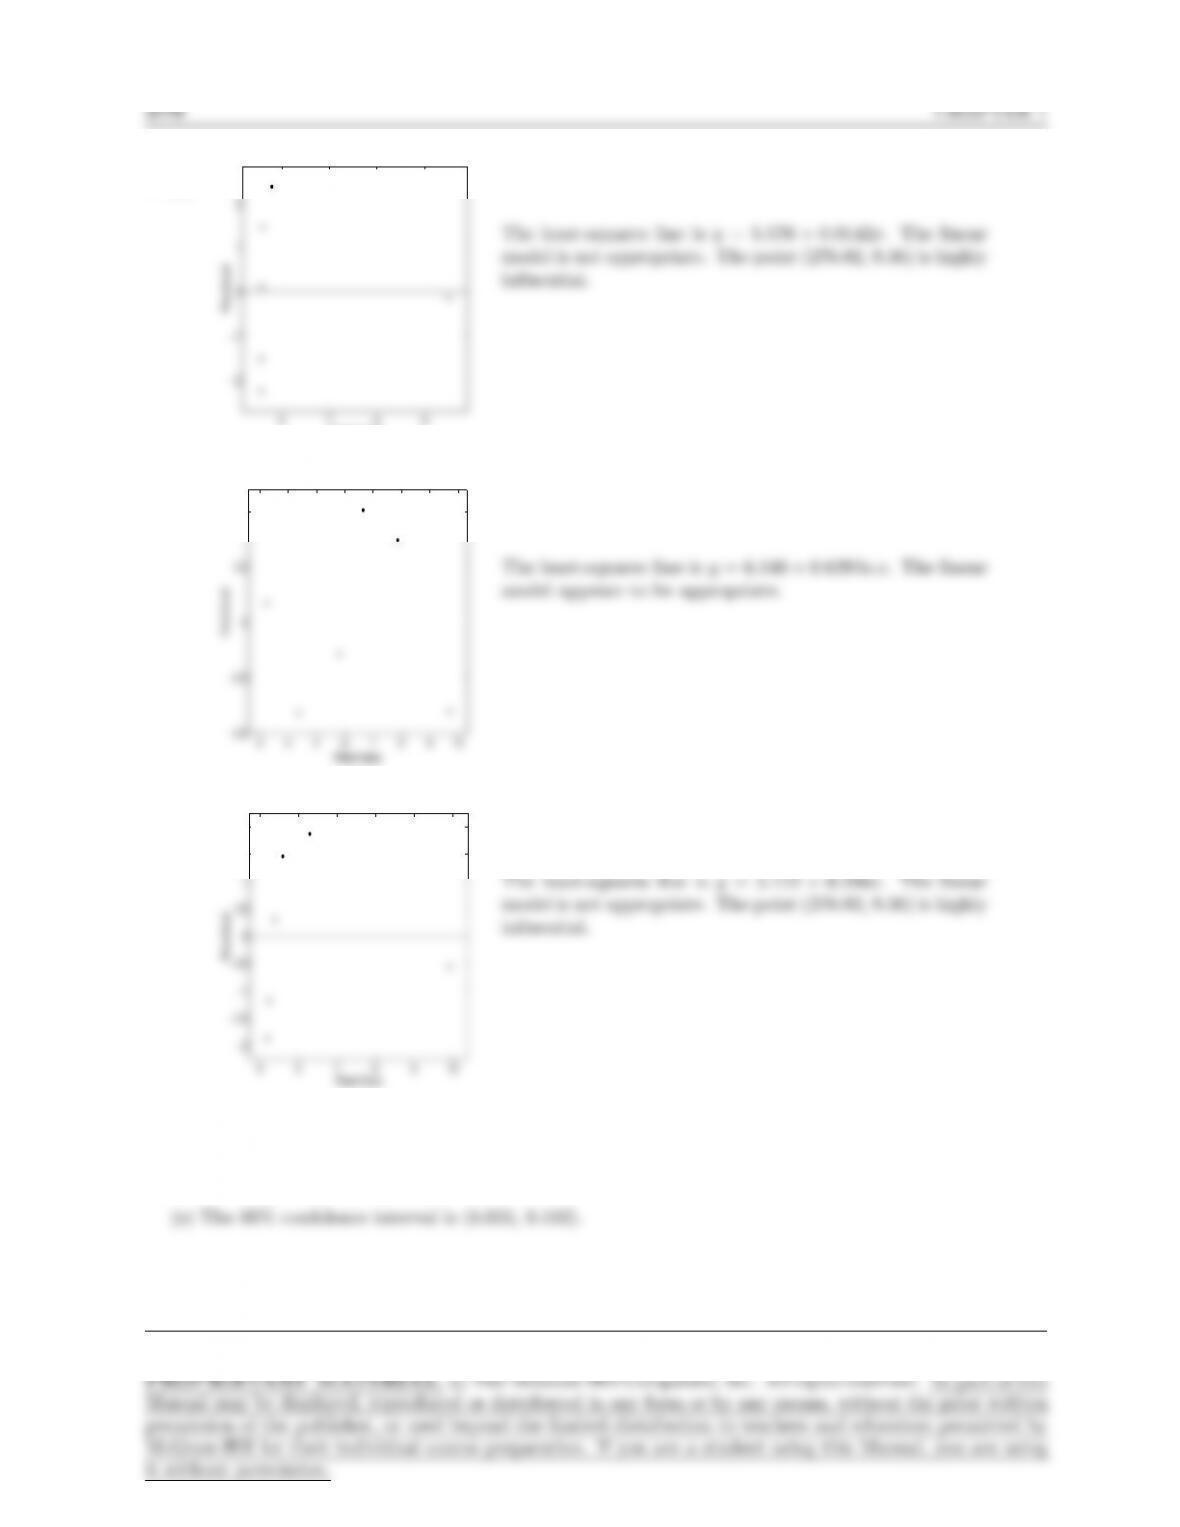
The least-squares line is y= 5.172 + 0.286x. The linear
model is not appropriate. The point (276.02, 9.36) is highly
influential.
(d) The most appropriate model is y= 6.148+0.629 ln x. The prediction is by= 6.148+0.629 ln 50 = 8.609.
Page 370
SECTION 7.4 371
3. (a) y= 20.162 + 1.269x
(b)
50 55 60 65 70 75
−10
−5
0
5
10
15
Fitted Value
Residual
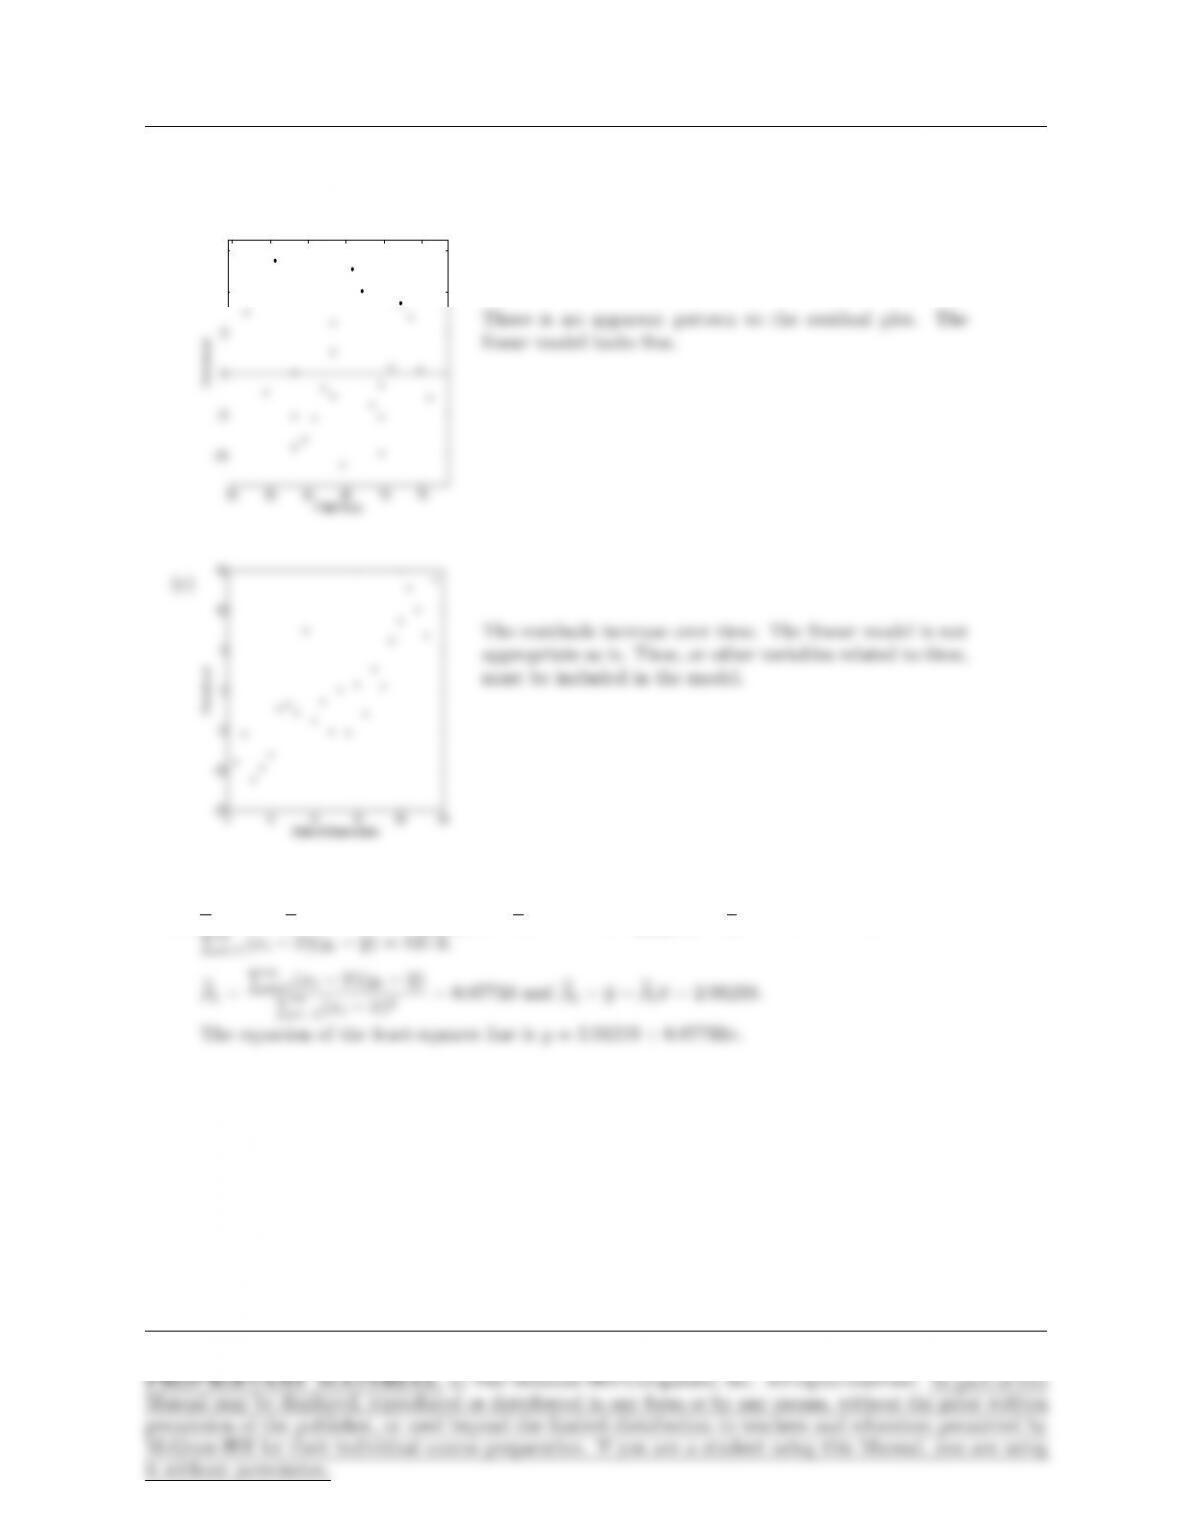
There is no apparent pattern to the residual plot. The
linear model looks fine.
(c)
0 5 10 15 20 25
−15
−10
−5
0
5
10
15
Order of Observations
Residual
The residuals increase over time. The linear model is not
appropriate as is. Time, or other variables related to time,
must be included in the model.
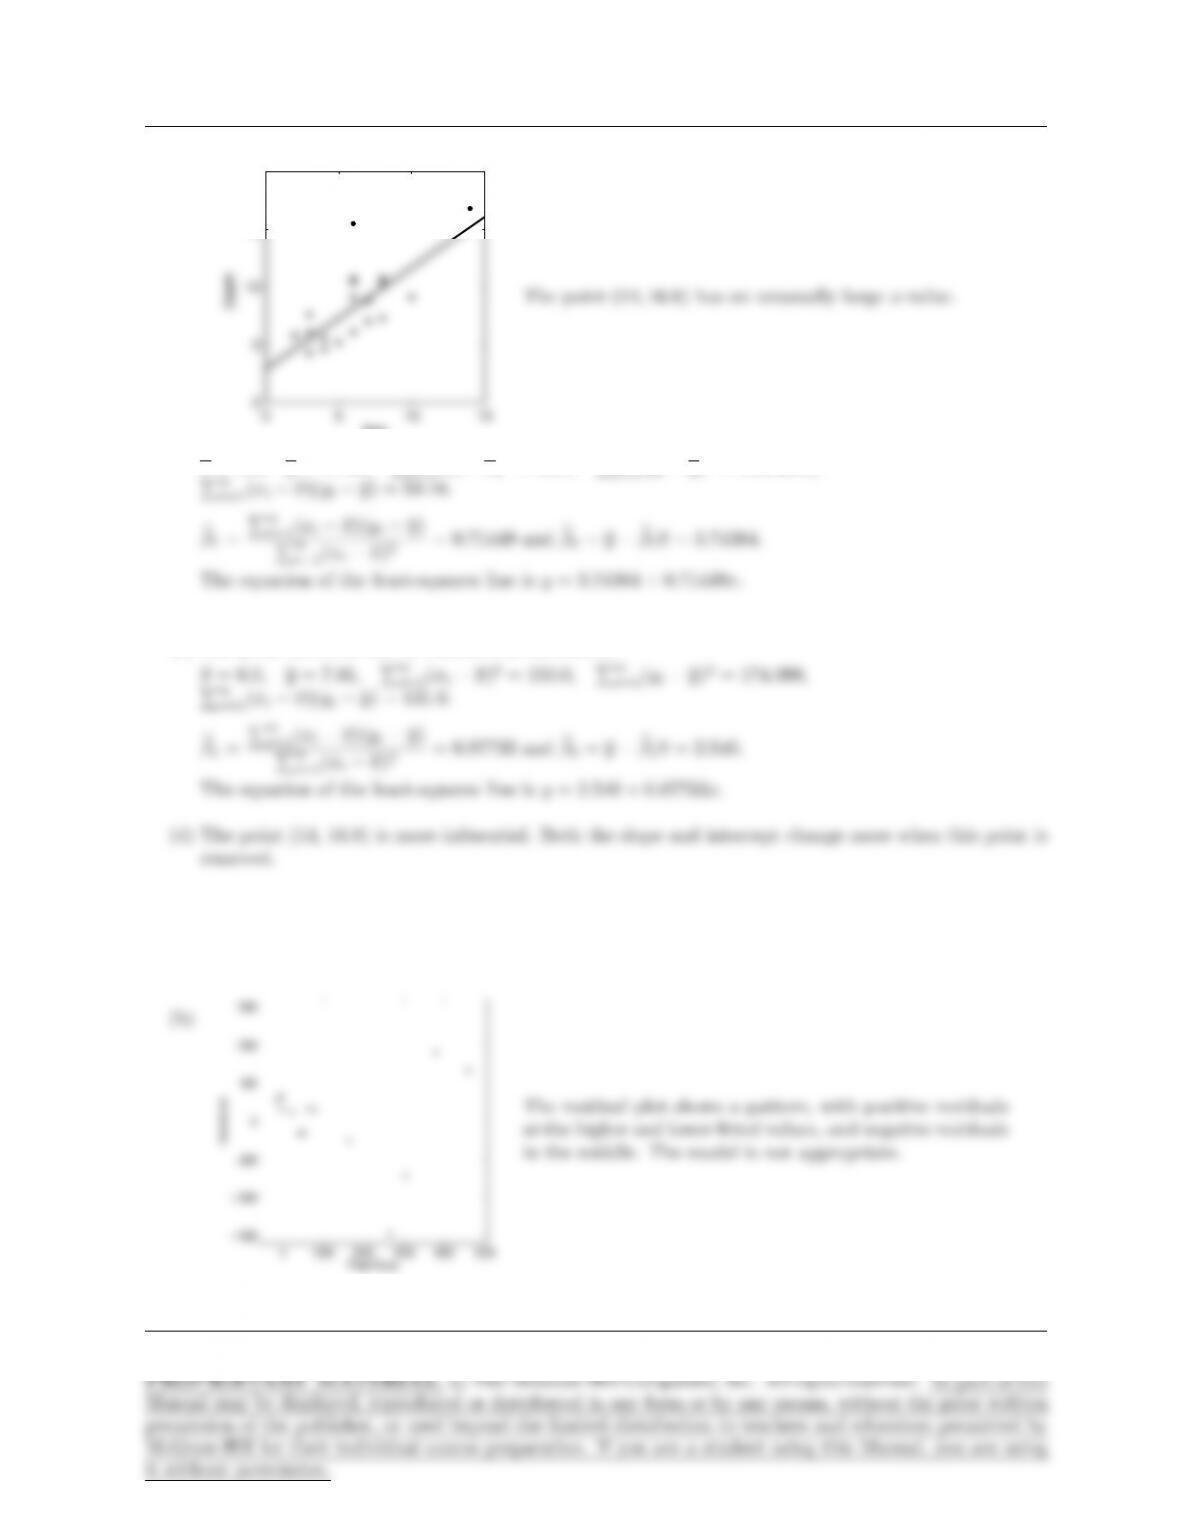
4. (a) x= 6.0, y= 8.176190, Pn
i=1(xi−x)2= 150.0, Pn
i=1(yi−y)2= 230.418095,
Pn
Page 371
372 CHAPTER 7
(b)
0 5 10 15
0
5
10
15
20
Age
Depth
The point (14,16.8) has an unusually large x-value.
x= 5.6, y= 7.745, Pn
(c) The point (6,15.5) can be classified as an outlier.
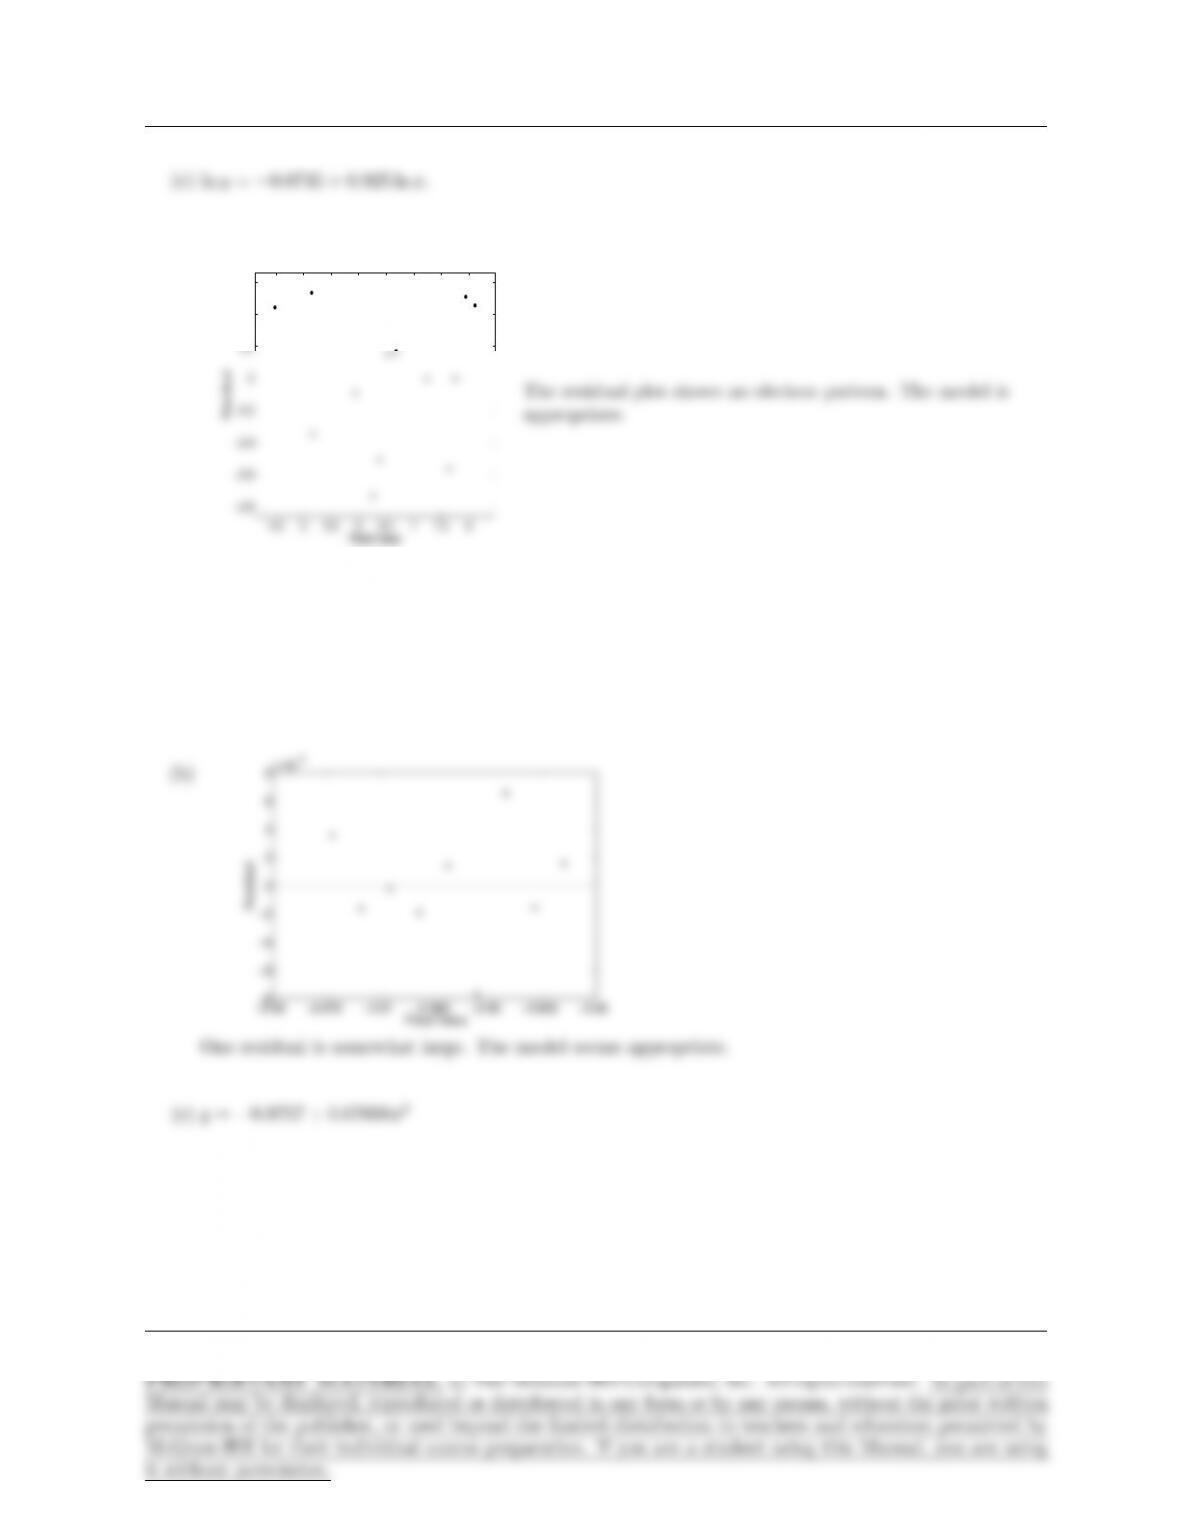
5. (a) y=−235.32 + 0.695x.
0 1000 2000 3000 4000 5000
−1500
−1000
−500
1500
Fitted Value
Page 372
SECTION 7.4 373
(d)
4.5 5 5.5 6 6.5 7 7.5 8
−0.8
−0.6
−0.4
−0.2
0
0.2
0.4
0.6
Fitted Value
Residual
The residual plot shows no obvious pattern. The model is
appropriate.
(e) The log model is more appropriate. The 95% prediction interval is (197.26,1559.76).
6. (a) y=−0.9853 + 0.5483x
Page 373
374 CHAPTER 7
(d)
−0.975 −0.97 −0.965 −0.96 −0.955 −0.95
−8
−6
−4
−2
0
2
4
6
8x 10⁻³
Fitted Value
Residual
One residual is somewhat large. The model seems appropriate.
(e) For the model y=−0.9853 + 0.05483x, the 95% confidence interval is (−0.9716,−0.9639). For the
model y=−0.9757 + 0.07038x2, the 95% confidence interval is (−0.9724,−0.9647). The confidence
intervals are quite similar.
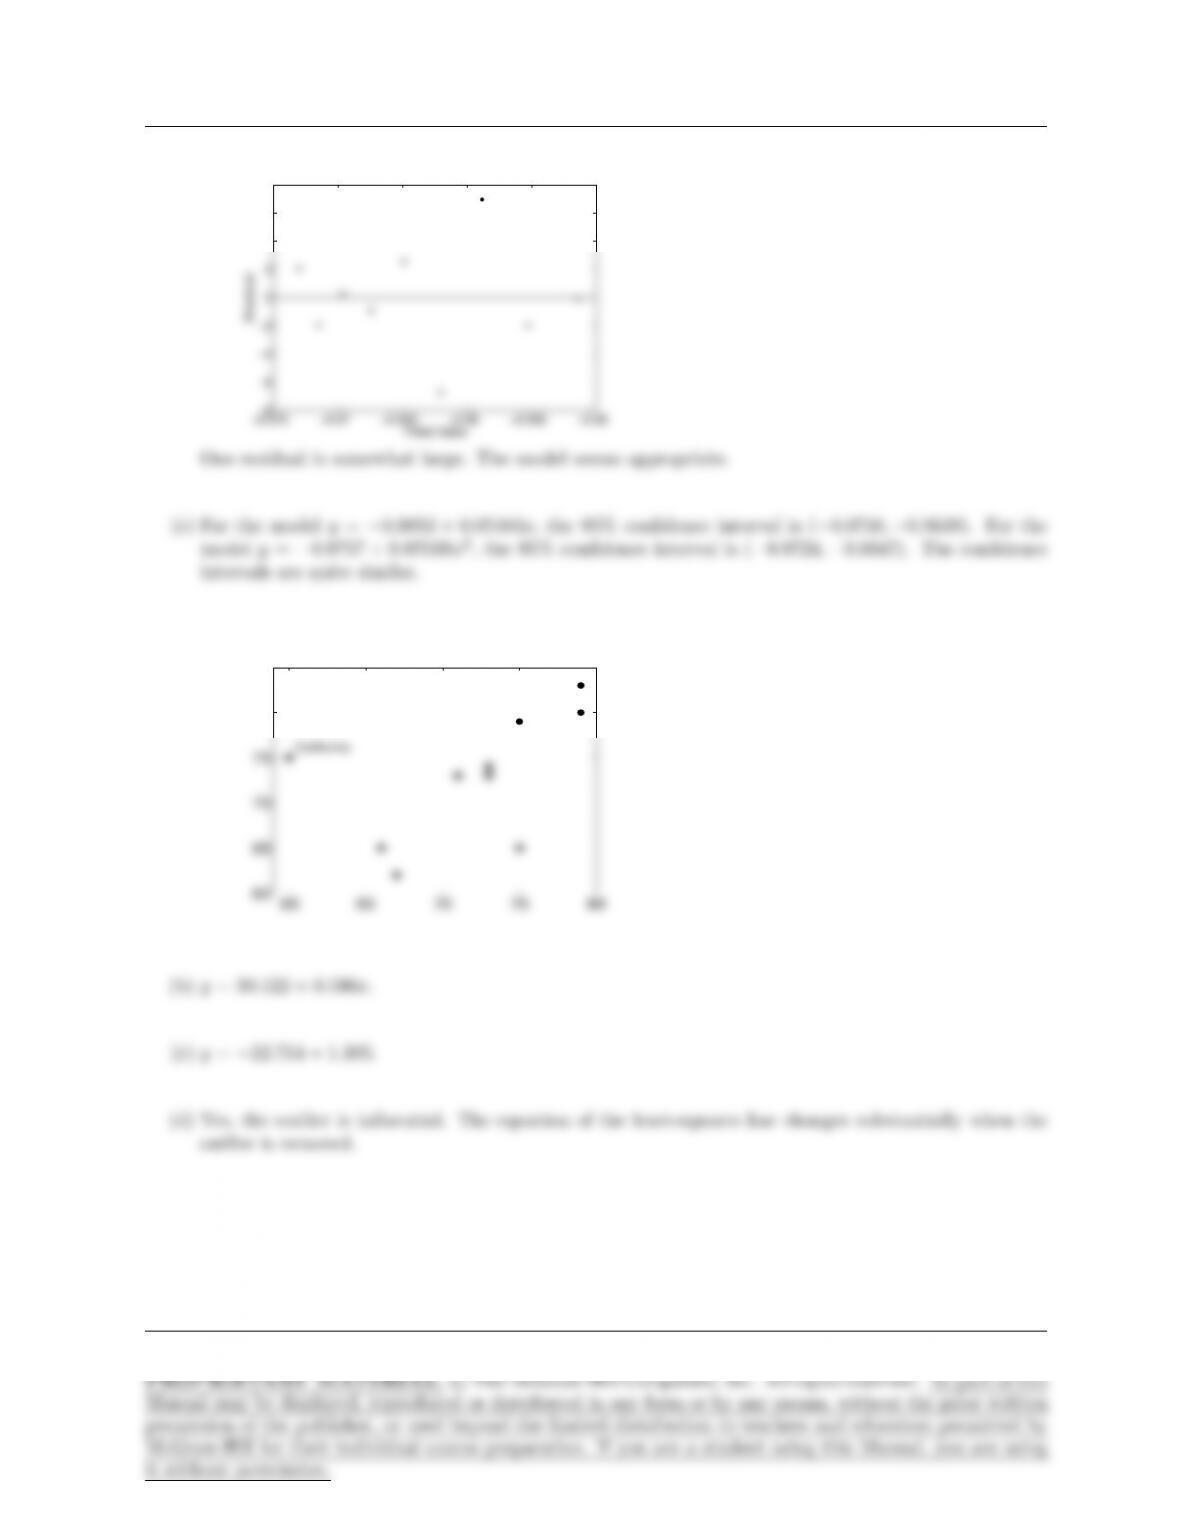
7. (a)
60 65 70 75 80
60
65
70
75
80
85
California
(b) y= 30.122 + 0.596x.
(c) y=−22.714 + 1.305.
(d) Yes, the outlier is influential. The equation of the least-squares line changes substantially when the
outlier is removed.
8. (a) R2= 0.464 + 0.571R1
Page 374
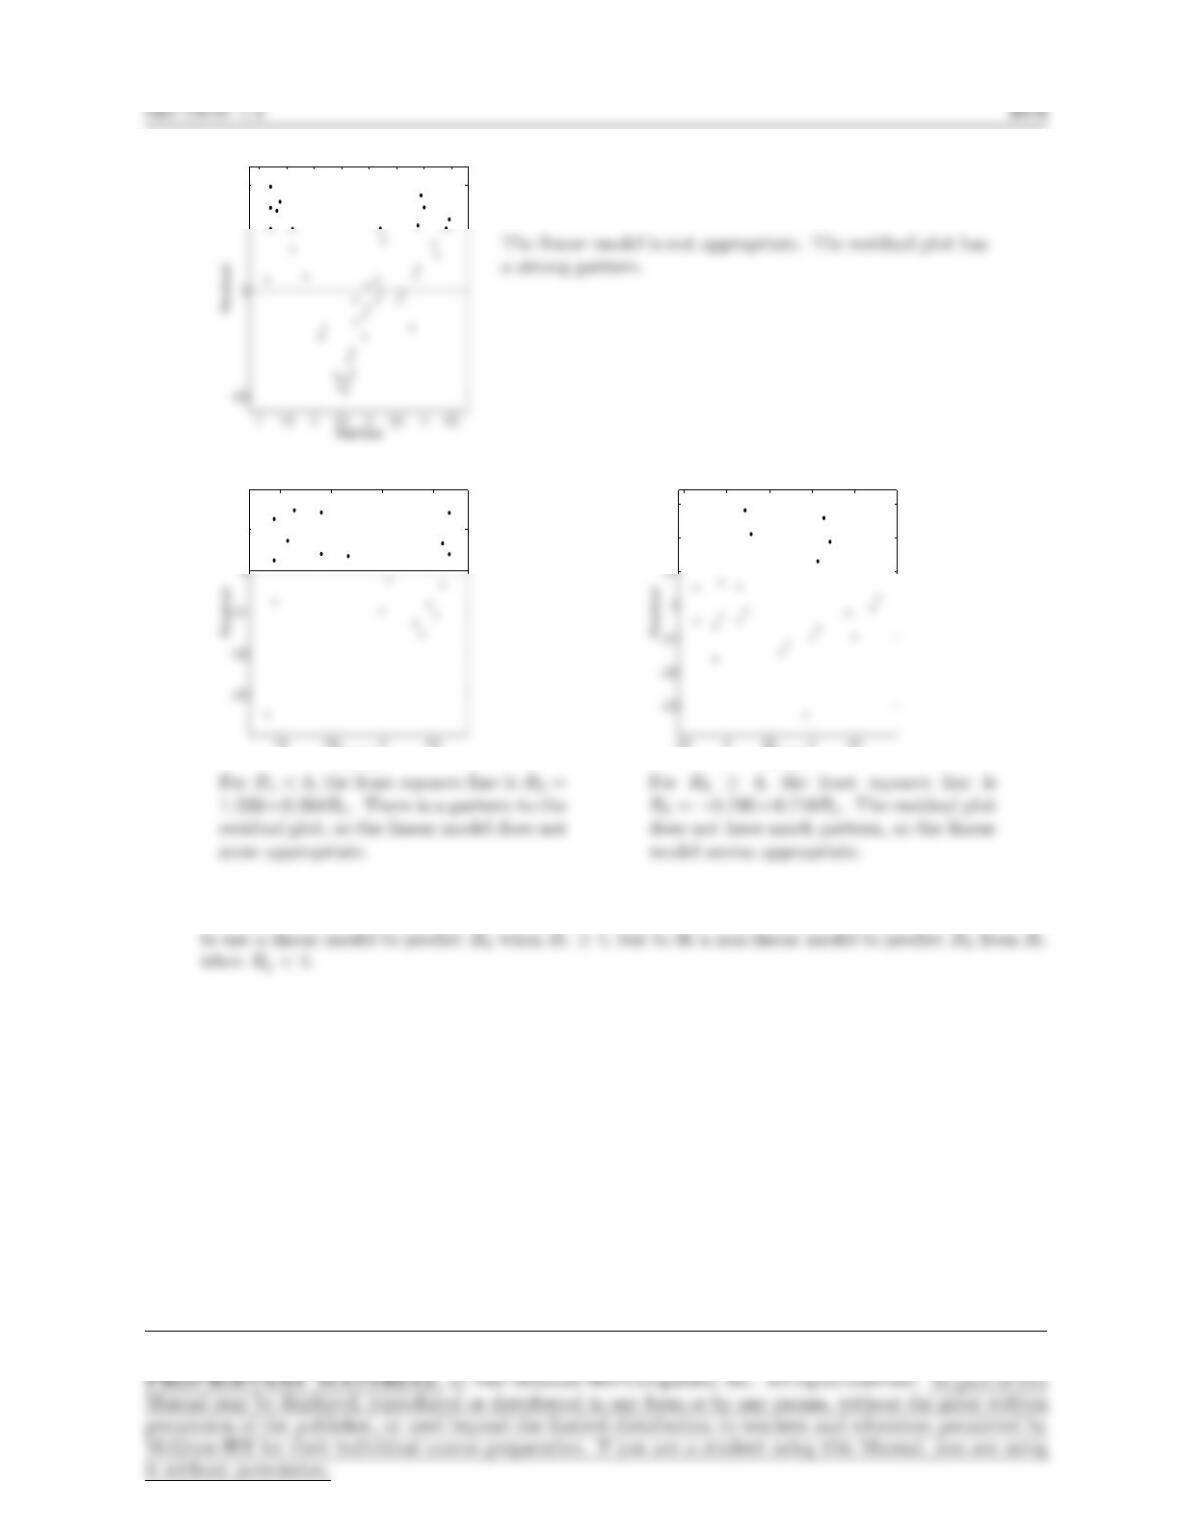
(b)
1 1.5 2 2.5 3 3.5 4 4.5
−0.5
0
0.5
Fitted Value
Residual
The linear model is not appropriate. The residual plot has
a strong pattern.
(c)
1.6 1.8 2 2.2
−0.3
−0.2
−0.1
0
0.1
Fitted Value
Residual
For R1<4, the least squares line is R2=
1.233+0.264R1. There is a pattern to the
residual plot, so the linear model does not
seem appropriate.
2.5 3 3.5 4 4.5
−0.3
−0.2
−0.1
0
0.1
0.2
0.3
Fitted Value
Residual
For R1≥4, the least squares line is
R2=−0.190+0.710R1. The residual plot
does not have much pattern, so the linear
model seems appropriate.
(d) The linear model seems to work well when R1≥4, but less well when R1<4. It might make sense
9. (a) The model is log10 y=β0+β1log10 x+ε. Note that the natural log (ln) could be used in place of
log10, but common logs are more convenient since partial pressures are expressed as powers of 10.
Page 375
(b)
−2 −1.5 −1 −0.5
−0.5
−0.4
−0.3
−0.2
−0.1
0
0.1
0.2
0.3
0.4
Fitted Value
Residual
The least-squares line is log10 y=
−3.277 −0.225 log10 x. The linear model
appears to fit quite well.
(c) The theory says that the coefficient β1of log10 xin the linear model is equal to −0.25. The estimated
10. (a)
100 200 300 400 500 600 700
150
200
250
300
350
400
450
Ester Level (mg/l)
Acid Level (mg/l)
Outlier
(b) b
β0= 352.32, sb
β0= 52.774, b
β1=−0.2495, sb
β1= 0.1951.
(c) t14 =−1.28, 0.20 < P < 0.50. A computer package gives P= 0.221.
(d) b
β0= 359.23, sb
β0= 91.076, b
β1=−0.2834, sb
β1= 0.4108.
(e) t13 =−0.690, P≈0.50. A computer package gives P= 0.502.
Page 376
SECTION 7.4 377
11. (a) y= 2049.87 −4.270x
(b) (12, 2046) and (13, 1954) are outliers. The least-squares line with (12, 2046) deleted is y= 2021.85 −
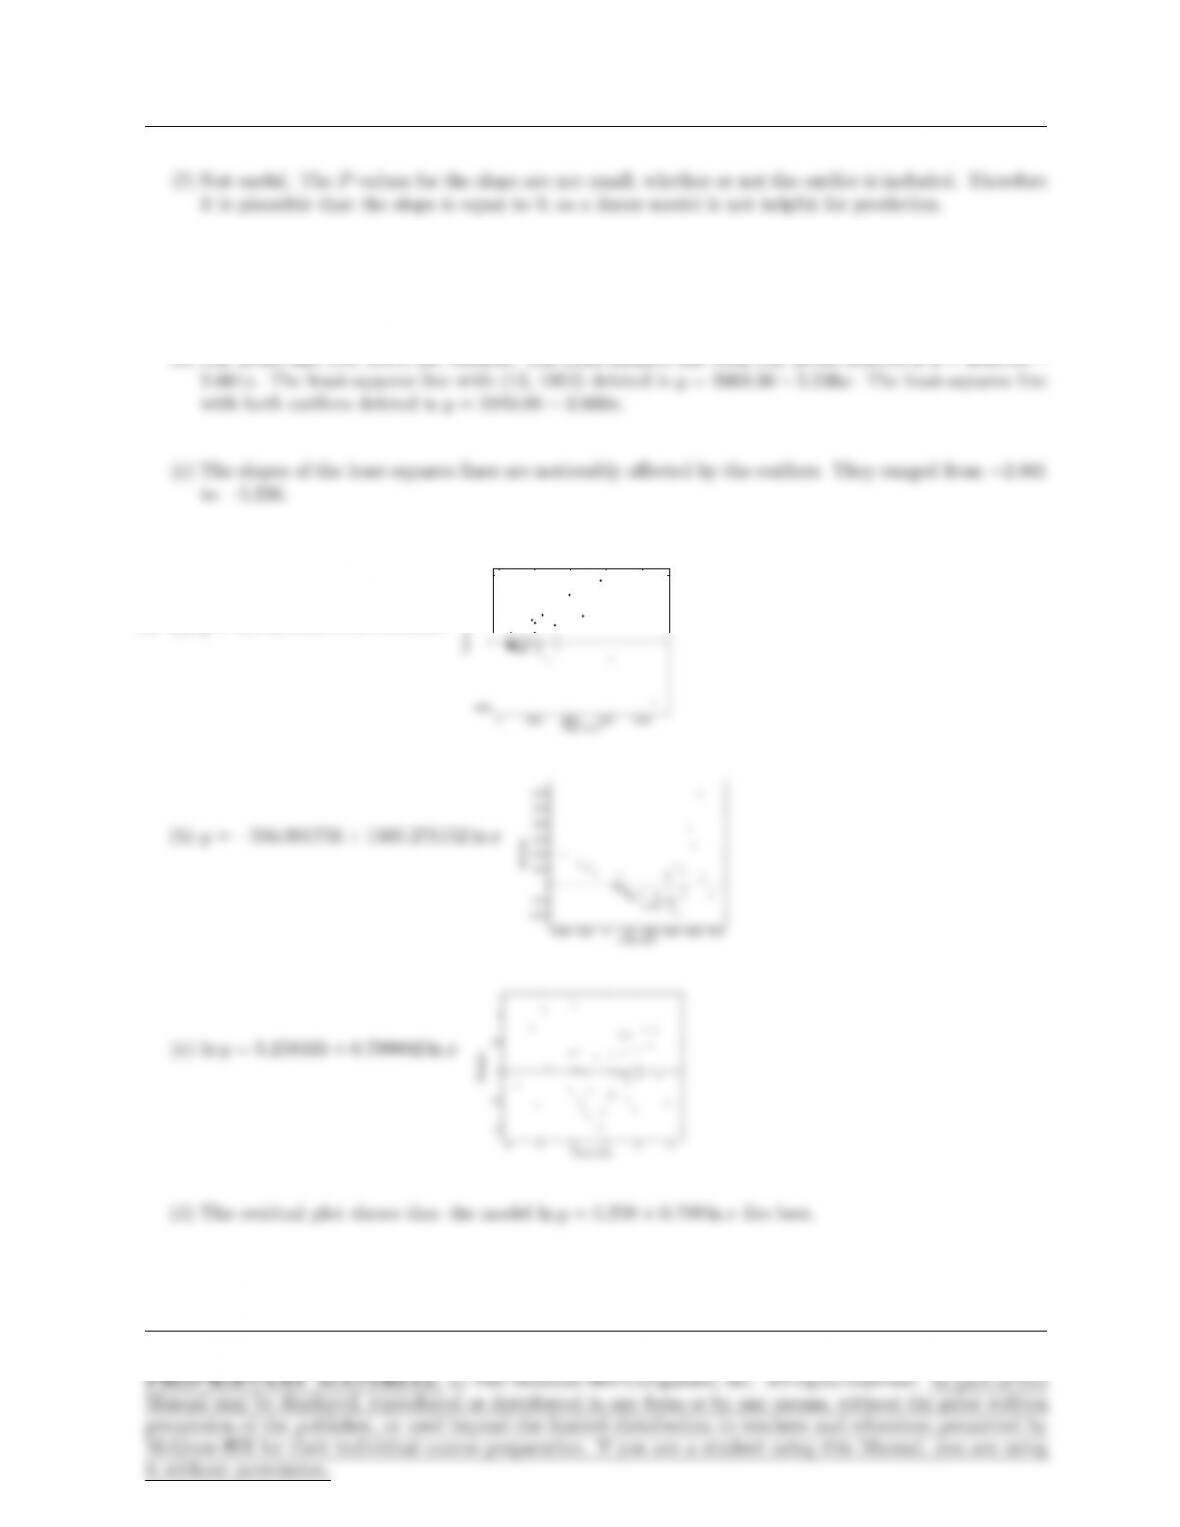
12. (a) y= 457.270059 + 87.555863x
0 2000 4000 6000 8000
−5000
0
5000
Fitted Value
Residual
(b) y=−504.001756 + 1165.271152 ln x
−2000 −1000 0 1000 2000 3000 4000 5000
−2000
−1000
0
1000
2000
3000
4000
5000
6000
Fitted Value
Residual
(c) ln y= 5.258333 + 0.799002 ln x
4 5 6 7 8 9
−1
−0.5
0
0.5
1
Fitted Value
Residual
(d) The residual plot shows that the model ln y= 5.258 + 0.799 ln xfits best.
Page 377
378 CHAPTER 7
(e) Let bybe the predicted flow when the discharge is 50 km3/yr. Then ln by= 5.258333 + 0.799002 ln 50 =
8.38405.
13. The equation becomes linear upon taking the log of both sides:
15. (a) A physical law.
Supplementary Exercises for Chapter 7
1. (a) x= 1.48, y= 1.466, Pn
Page 378
SUPPLEMENTARY EXERCISES FOR CHAPTER 7 379
(d) r2=[Pn
i=1(xi−x)(yi−y)]2
Pn
i=1(xi−x)2Pn
i=1(yi−y)2= 0.989726, s=r(1 −r2)Pn
i=1(yi−y)2
n−2= 0.0474028,
2. (a) y= 4.9x2, so the relationship between xand yis not linear. The correlation coefficient is not
appropriate.
3. (a)
40 50 60 70 80 90 100
40
50
60
70
80
90
100
Page 379
380 CHAPTER 7
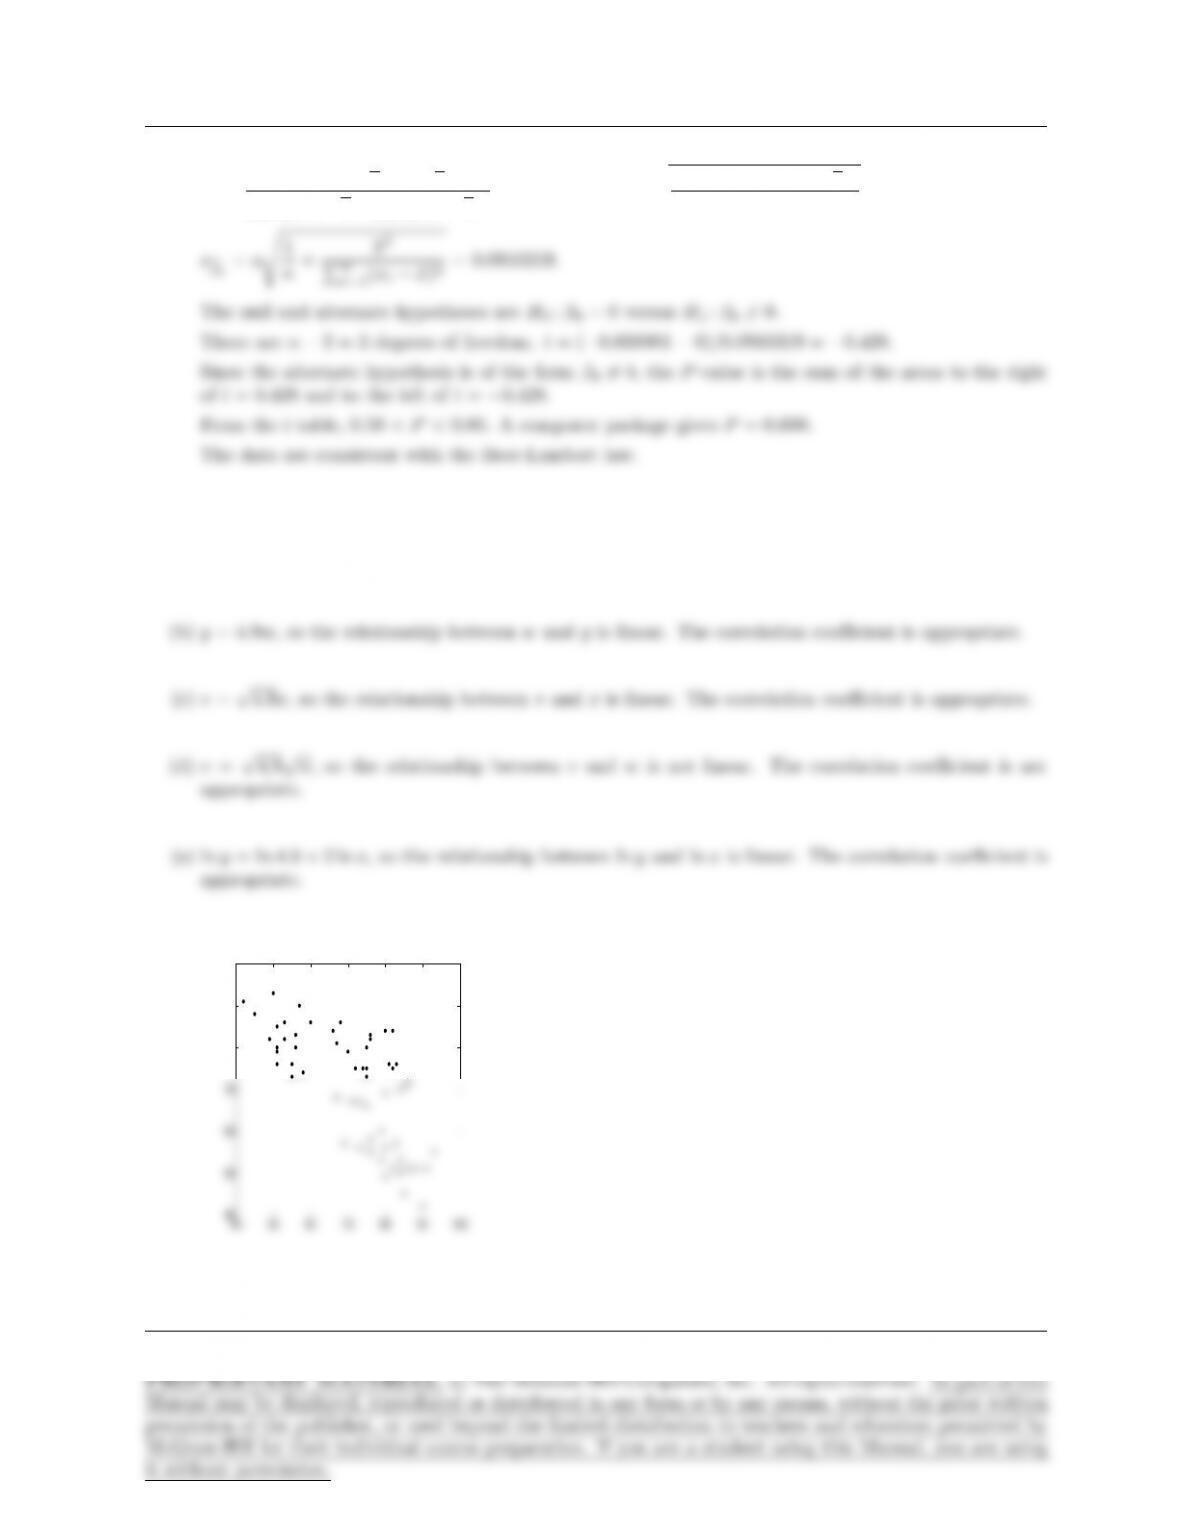
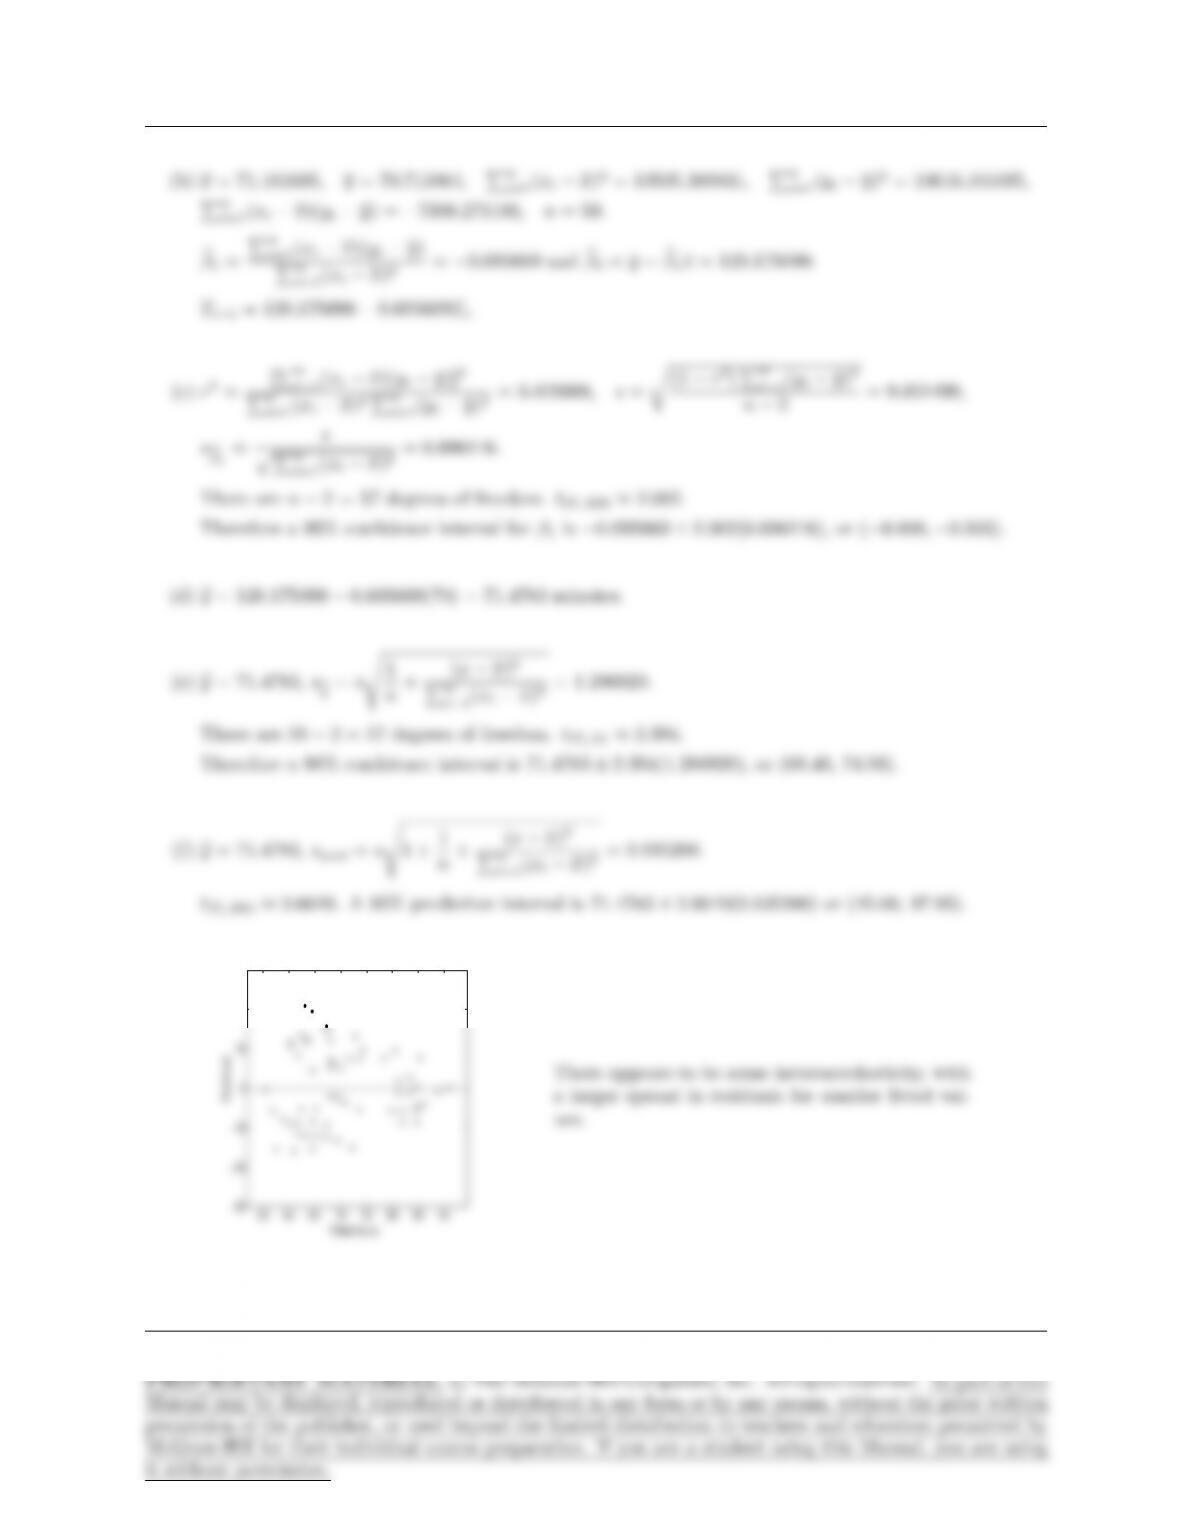
4. (a)
55 60 65 70 75 80 85 90
−30
−20
−10
0
10
20
30
Fitted Value
Residual
There appears to be some heteroscedasticity, with
a larger spread in residuals for smaller fitted val-
ues.
Page 380