
SECTION 6.14 331
10. (a) One-tailed. The alternate hypothesis is of the form µ > µ0.
11. (a) Two-tailed. The alternate hypothesis is of the form µ1−µ26= ∆.
Section 6.14
1. Several tests have been performed, so we cannot interpret the P-values in the way that we do when
only one test is performed.
Page 331

2. The Bonferroni-adjusted P-value is 5(0.03) = 0.15, which is not small enough to reject H0.
3. (a) There are six tests, so the Bonferroni-adjusted P-values are found by multiplying the original P-values
4. (iii). The Bonferroni-adjusted P-value is 5(0.03) = 0.15, which is not small enough to conclude that
5. The original P-value must be 0.05/20 = 0.0025.
6. (a) For additive A: X= 12.938, s= 1.1168, n= 10. t= (12.938 −12)/(1.1168/√10) = 2.655.
Page 332

SECTION 6.15 333
From the ttable, P≈0.10. A computer package gives P= 0.100.
(b) (i) At least one of the new additives results in an improvement. The Bonferroni-adjusted P-value
7. (a) No. Let Xrepresent the number of times in 200 days that H0is rejected. If the mean burn-out amper-
(b) Yes. Let Xrepresent the number of times in 200 days that H0is rejected. If the mean burn-out amper-
Page 333
334 CHAPTER 6
Section 6.15
1. (a) Using Method 1, the limits of the 95% confidence interval are the 2.5 and 97.5 percentiles of the
(b) Using Method 1, the limits of the 90% confidence interval are the 5th and 95th percentiles of the
2. (a) Answers may vary.
(b) Answers may vary.
3. No, the value 103 is an outlier.
4. (a) There are 16 outcomes in both groups together. Under H0, any group of eight is equally likely
to comprise the values for regular gasoline. Therefore the total number of possible outcomes is
16
Page 334
SECTION 6.15 335
8+3.01562
82
5. (a) s2
A= 200.28, s2
B= 39.833, s2
A/s2
B= 5.02.
7. (a) The test statistic is t=X−7
8. (a) The power of the two-sample test is approximately 0.46, and the power of the paired test is approxi-
9. (a) X= 22.10, σX= 0.34, Y= 14.30, σY= 0.32, V=√X2+Y2= 26.323.
Page 335
336 CHAPTER 6
(b) V= 26.323, σV= 0.3342. The null and alternate hypotheses are H0:µV≤25 versus H1:µV>25.
10. (a) bp1= 0.42, σbp1= 0.049, bp2= 0.23, σbp2= 0.043, bp=bp1bp2= 0.0966.
(b) bp= 0.0966, σbp= 0.0213. The null and alternate hypotheses are H0:p≥25 versus H1:p < 25.
Supplementary Exercises for Chapter 6
1. This requires a test for the difference between two means. The data are unpaired. Let µ1represent
2. The data are paired, so this requires a paired test for the mean difference. Let µ1represent the
Page 336
SUPPLEMENTARY EXERCISES FOR CHAPTER 6 337
3. This requires a test for a population proportion. Let prepresent the population proportion of defective
4. This requires an Ftest. Let σ2
1represent the population variance for the crushing strength of the old
5. (a) H0:µ≥16 versus H1:µ < 16
6. (a) H0:p= 0.20 versus H1:p6= 0.20.
7. (a) H0:µ1−µ2= 0 versus H1:µ1−µ26= 0
Page 337

338 CHAPTER 6
(b) D= 1608.143, sD= 2008.147, n= 7. There are 7 −1 = 6 degrees of freedom. The null and alternate
8. s1= 3.06, s2= 1.41. The sample sizes are n1= 21 and n2= 21.
9. X= 5.6, s= 1.2, n= 85. The null and alternate hypotheses are H0:µ≤5 versus H1:µ > 5.
10. D= 0.17, sD= 1.0122, n= 10. There are 10 −1 = 9 degrees of freedom.
11. (a) The null distribution of Xis normal with mean µ= 100 and standard deviation σX= 0.1/√100 = 0.01.
Page 338
SUPPLEMENTARY EXERCISES FOR CHAPTER 6 339
(b) The null distribution of Xis normal with mean µ= 100 and standard deviation σX= 0.1/√100 = 0.01.
(e) Since this is a two-tailed test, there are two critical points, equidistant from the null mean of 100.
12. (a) First find the rejection region.
The null distribution of Xis normal with mean µ= 100 and standard deviation σX= 5/√100 = 0.5.
(b) Let nbe the required sample size.
Page 339
340 CHAPTER 6
The null distribution is normal with µ= 100 and σX= 5/√n. The alternate distribution is normal
(c) Let x0be the boundary of the rejection region.
(d) The power is P(X≥100.5), computed under the alternate hypothesis.
13. (a) The null hypothesis specifies a single value for the mean: µ= 3. The level, which is 5%, is therefore
(b) First find the rejection region.
Page 340
SUPPLEMENTARY EXERCISES FOR CHAPTER 6 341
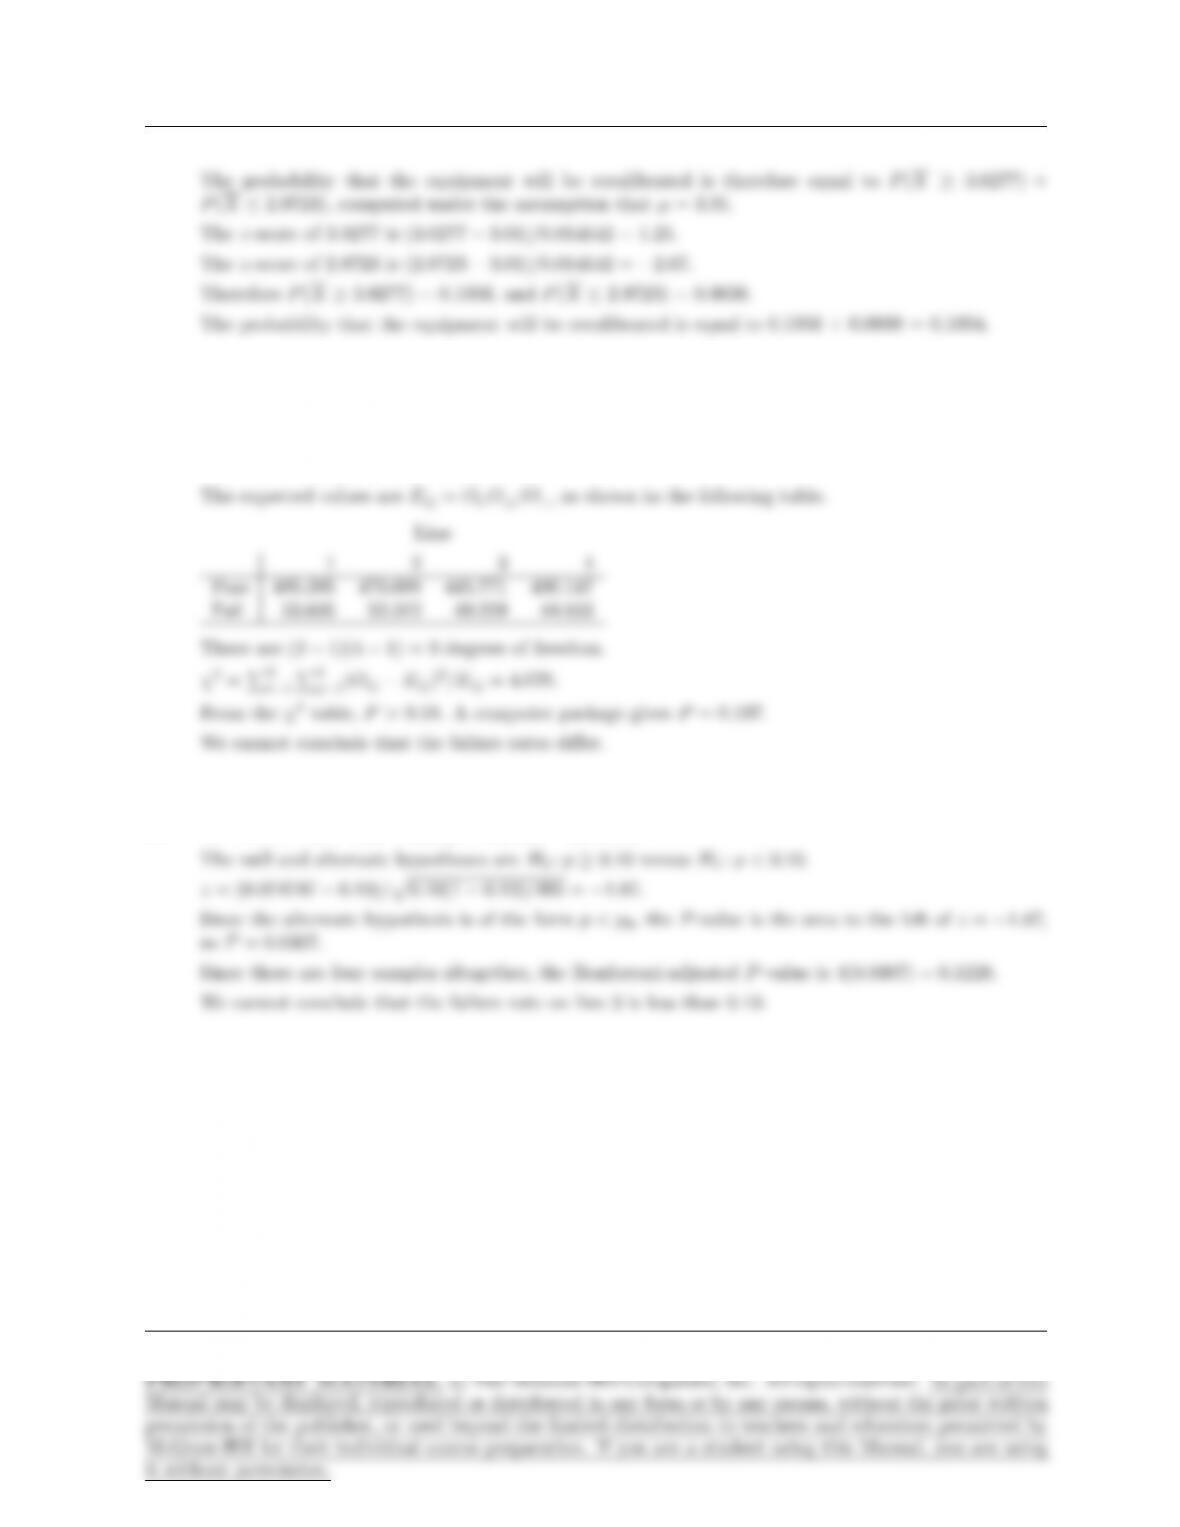
14. The row totals are O1.= 1811 and O2.= 200. The column totals are O.1= 539, O.2= 526, O.3= 495,
O.4= 451. The grand total is O.. = 2011.
15. X= 37, n= 37 + 458 = 495, bp= 37/495 = 0.074747.
16. (a) Both samples have a mean of 131 and a variance of 107,210.
Page 341
342 CHAPTER 6
(b) The ranks of the combined samples are Value Rank Sample
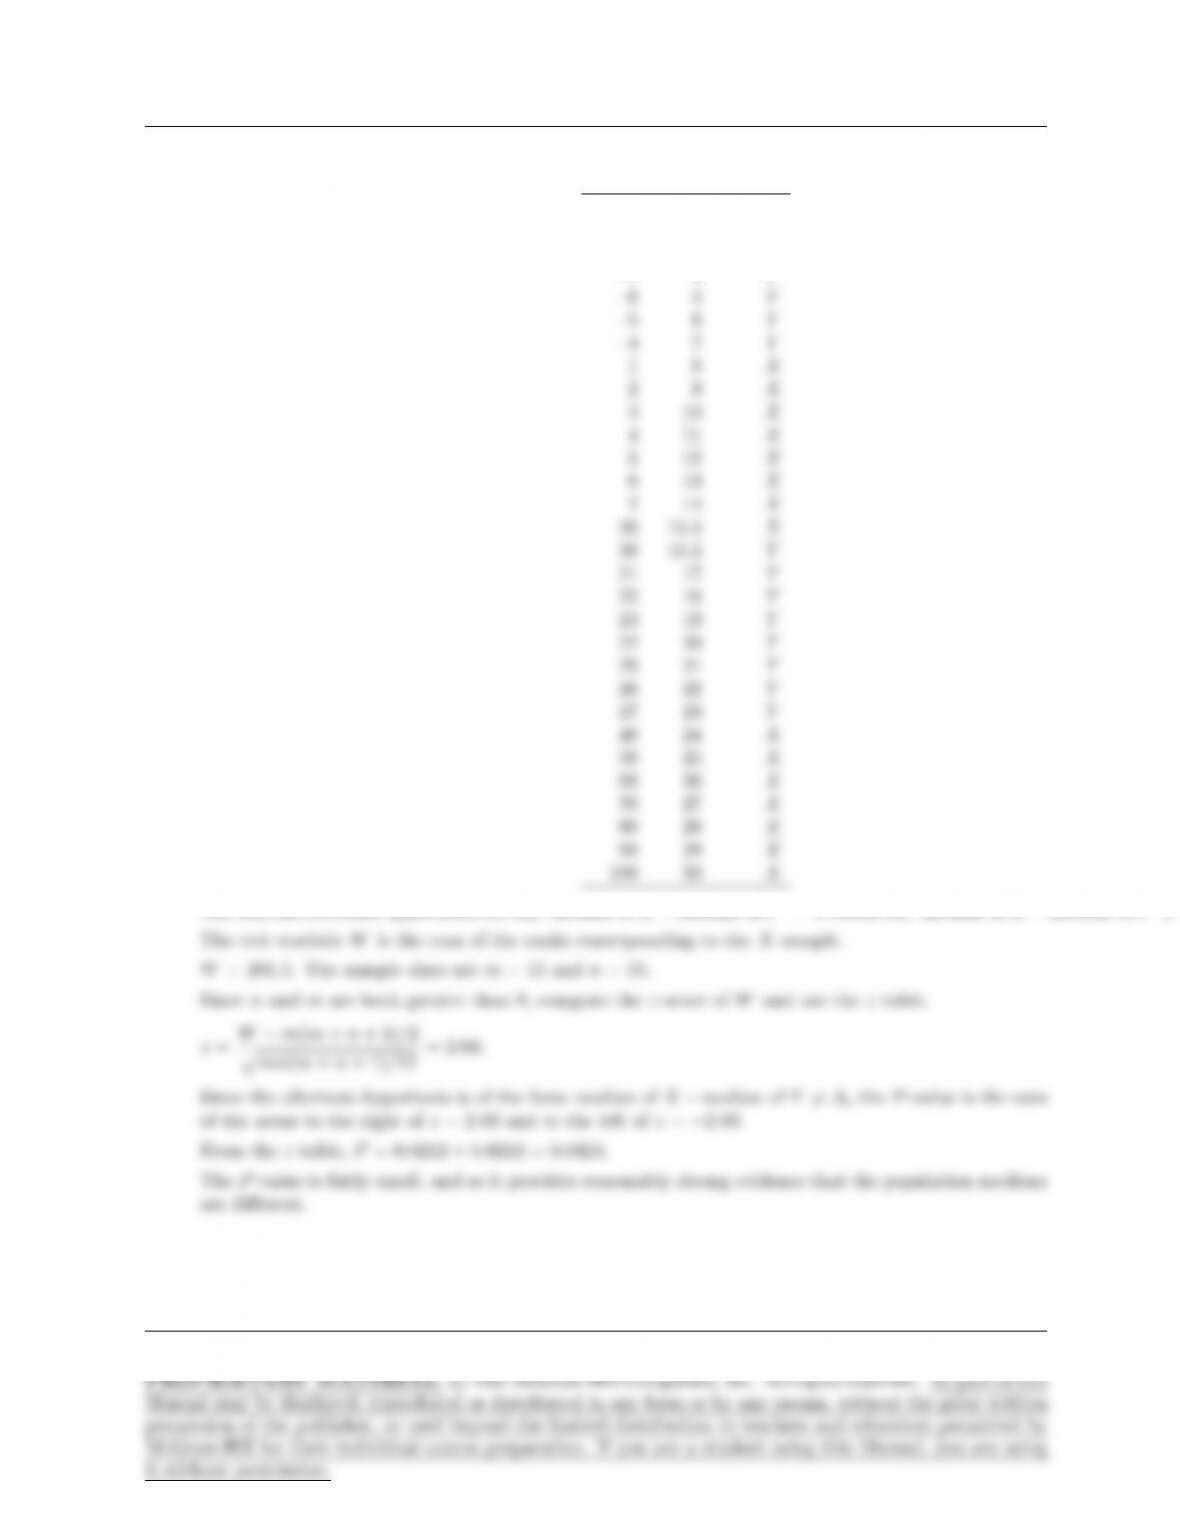
17. (a) Both samples have a median of 20.
Page 342
SUPPLEMENTARY EXERCISES FOR CHAPTER 6 343
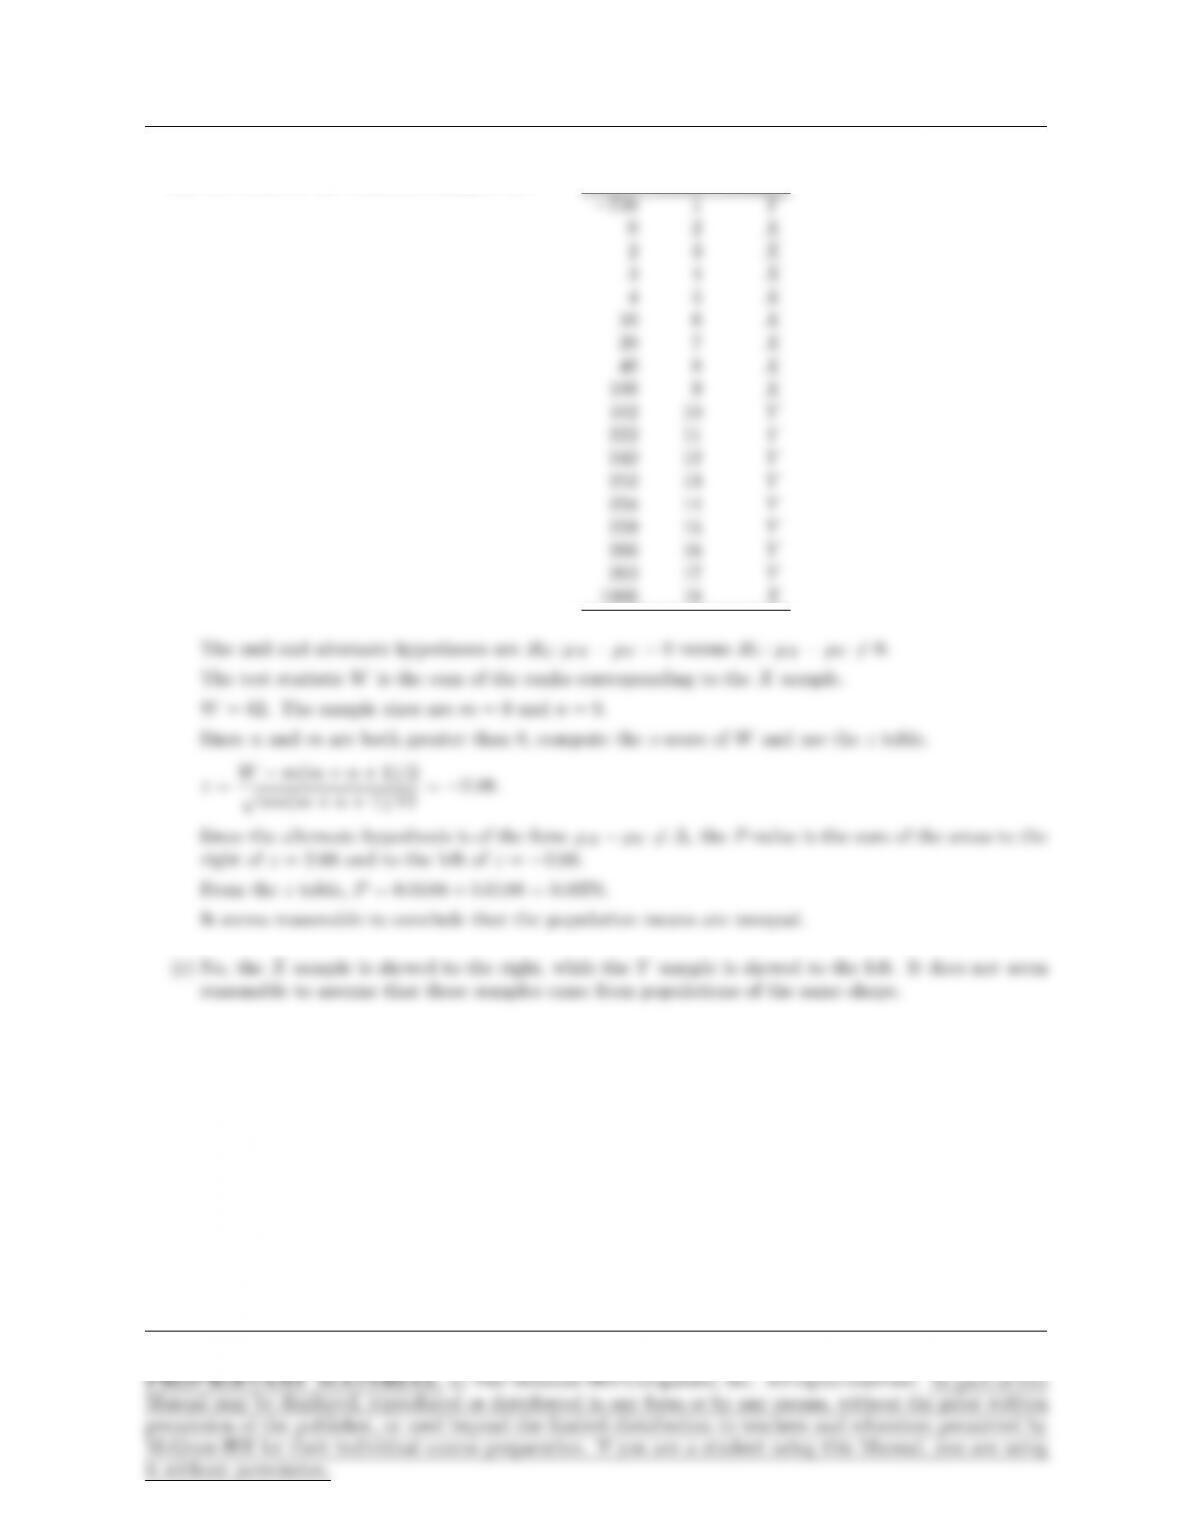
(b) The ranks of the combined samples are Value Rank Sample
−10 1 Y
−9 2 Y
−8 3 Y
−7 4 Y
The null and alternate hypotheses are H0: median of X−median of Y= 0 versus H1: median of X−median of Y6=
(c) No, the Xsample is heavily skewed to the right, while the Ysample is strongly bimodal. It does not
Page 343
344 CHAPTER 6
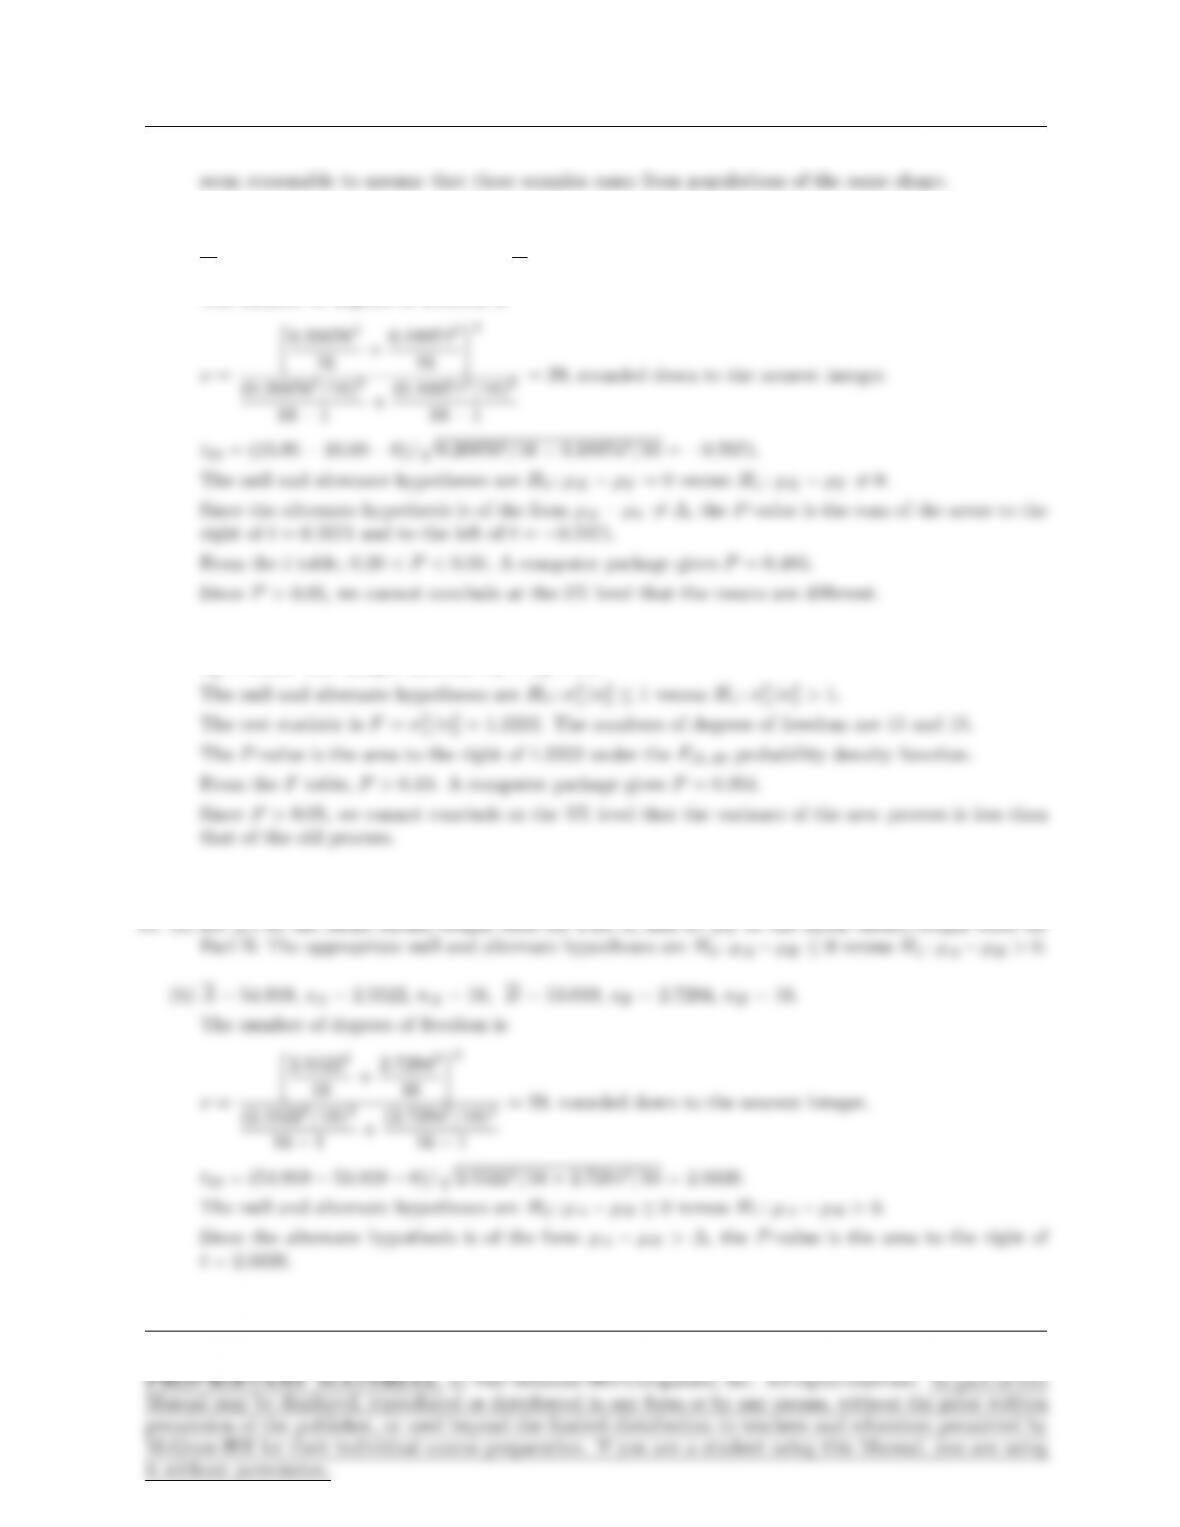
18. (a) X= 15.95, sX= 0.20976, nX= 16, Y= 16.00, sY= 0.18974, nY= 16.
The number of degrees of freedom is
16 +0.189742
16 2
(b) The sample variance for the old process is σ2
1= 0.044. The sample variance for the new process is
σ2
2= 0.036. The sample sizes are n1=n2= 16.
Page 344
SUPPLEMENTARY EXERCISES FOR CHAPTER 6 345
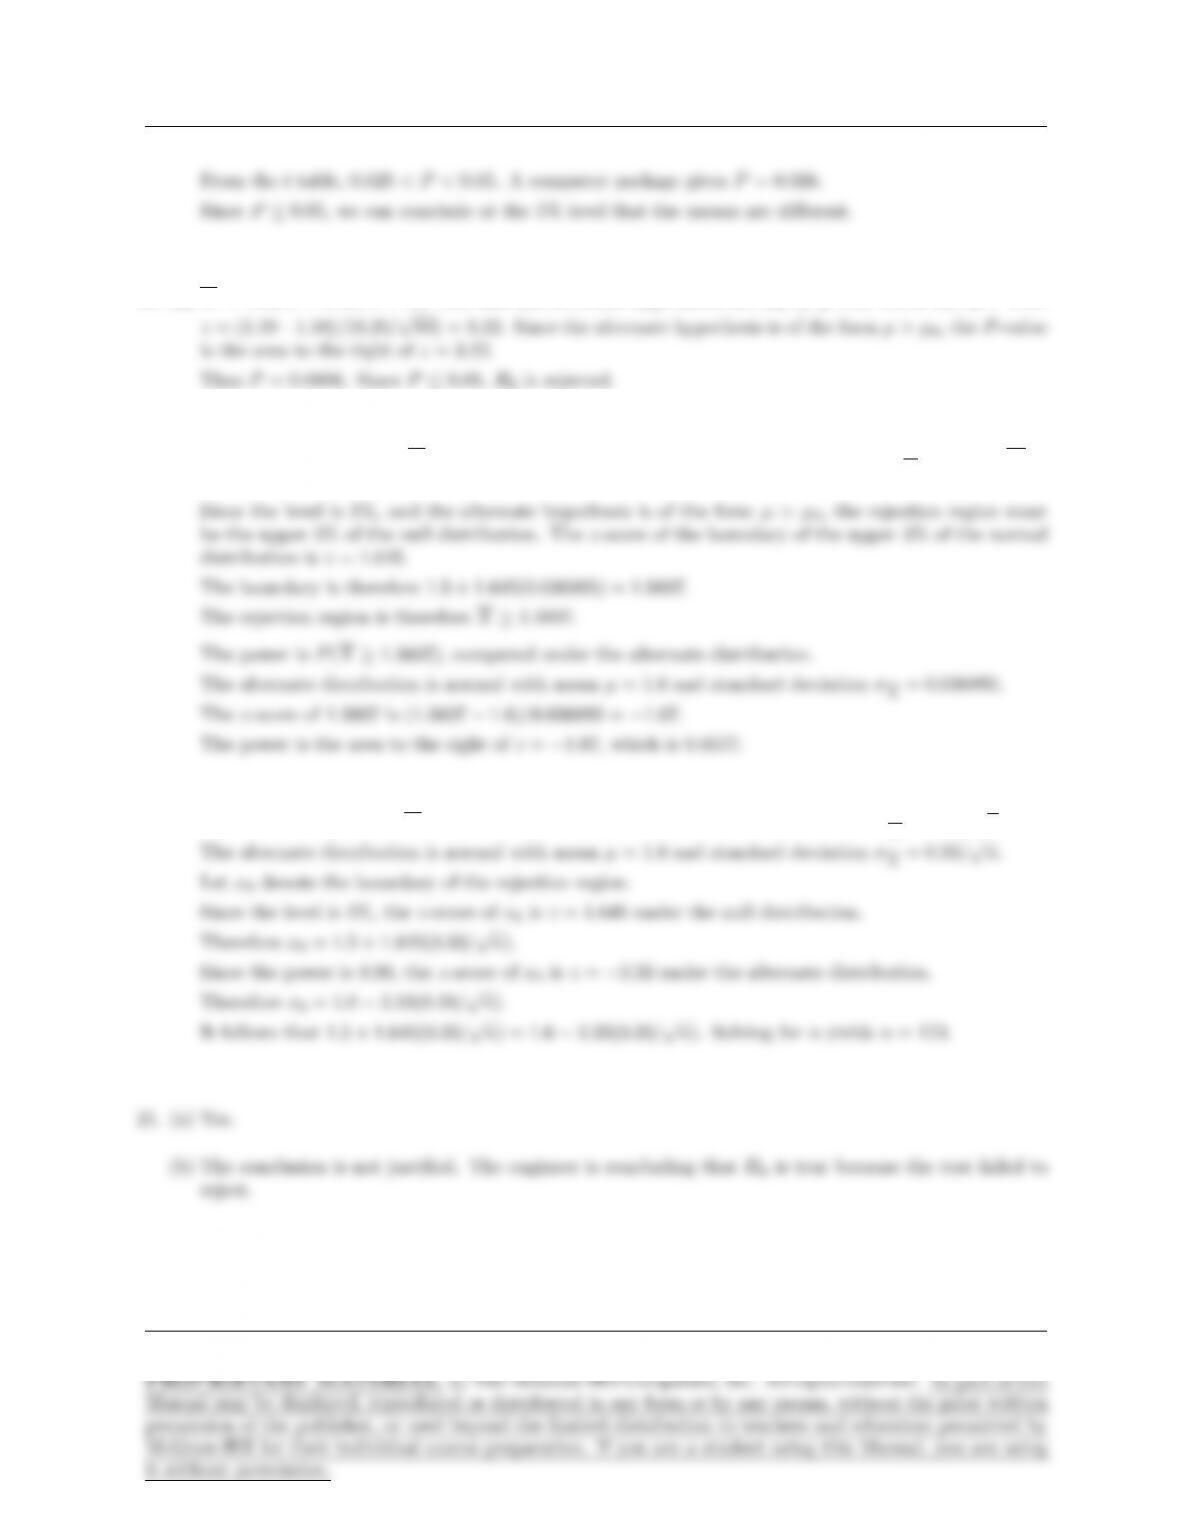
20. (a) X= 1.59, s= 0.25, n= 80. The null and alternate hypotheses are H0:µ≤1.50 versus H1:µ > 1.50.
(b) First find the rejection region.
The null distribution of Xis normal with mean µ= 1.5 and standard deviation σX= 0.33/√80 =
0.036895.
(c) Let nbe the required sample size.
The null distribution of Xis normal with mean µ= 1.5 and standard deviation σX= 0.33/√n.
Page 345
22. X= 347, n= 510, bp= 347/510 = 0.68039.
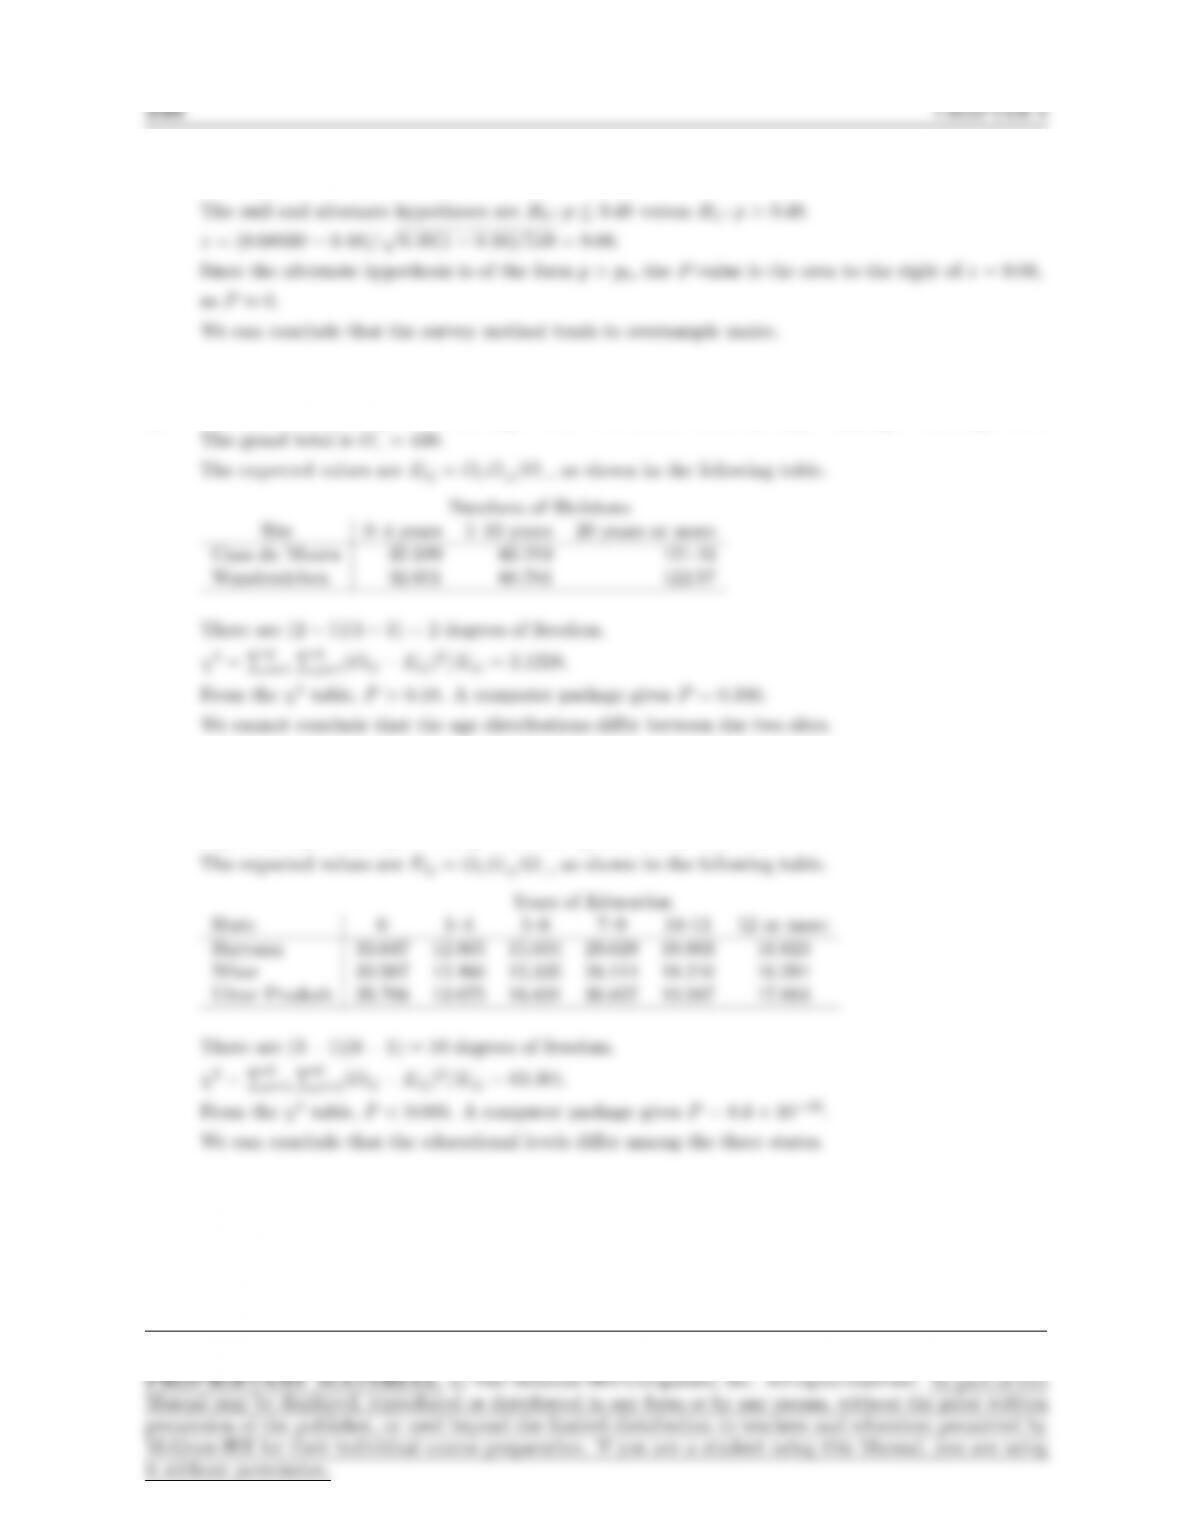
23. The row totals are O1.= 214 and O2.= 216. The column totals are O.1= 65, O.2= 121, O.3= 244.
24. The row totals are O1.= 127, O2.= 123, O3.= 135. The column totals are O.1= 102, O.2= 39,
O.3= 48, O.4= 88, O.5= 57, O.6= 51. The grand total is O.. = 385.
Page 346
SECTION 7.1 347
Chapter 7
Section 7.1
1. x=y= 4, Pn
i=1(xi−x)2= 28, Pn
i=1(yi−y)2= 28, Pn
i=1(xi−x)(yi−y) = 23.
i=1(xi−x)(yi−y)
2. (a) yhas been replaced with y+ 3, xis unchanged. This involves only adding a constant, which does not
3. (a) The correlation coefficient is appropriate. The points are approximately clustered around a line.
4. (a) True. This is a result of the plot being clustered around a line with positive slope.
Page 347