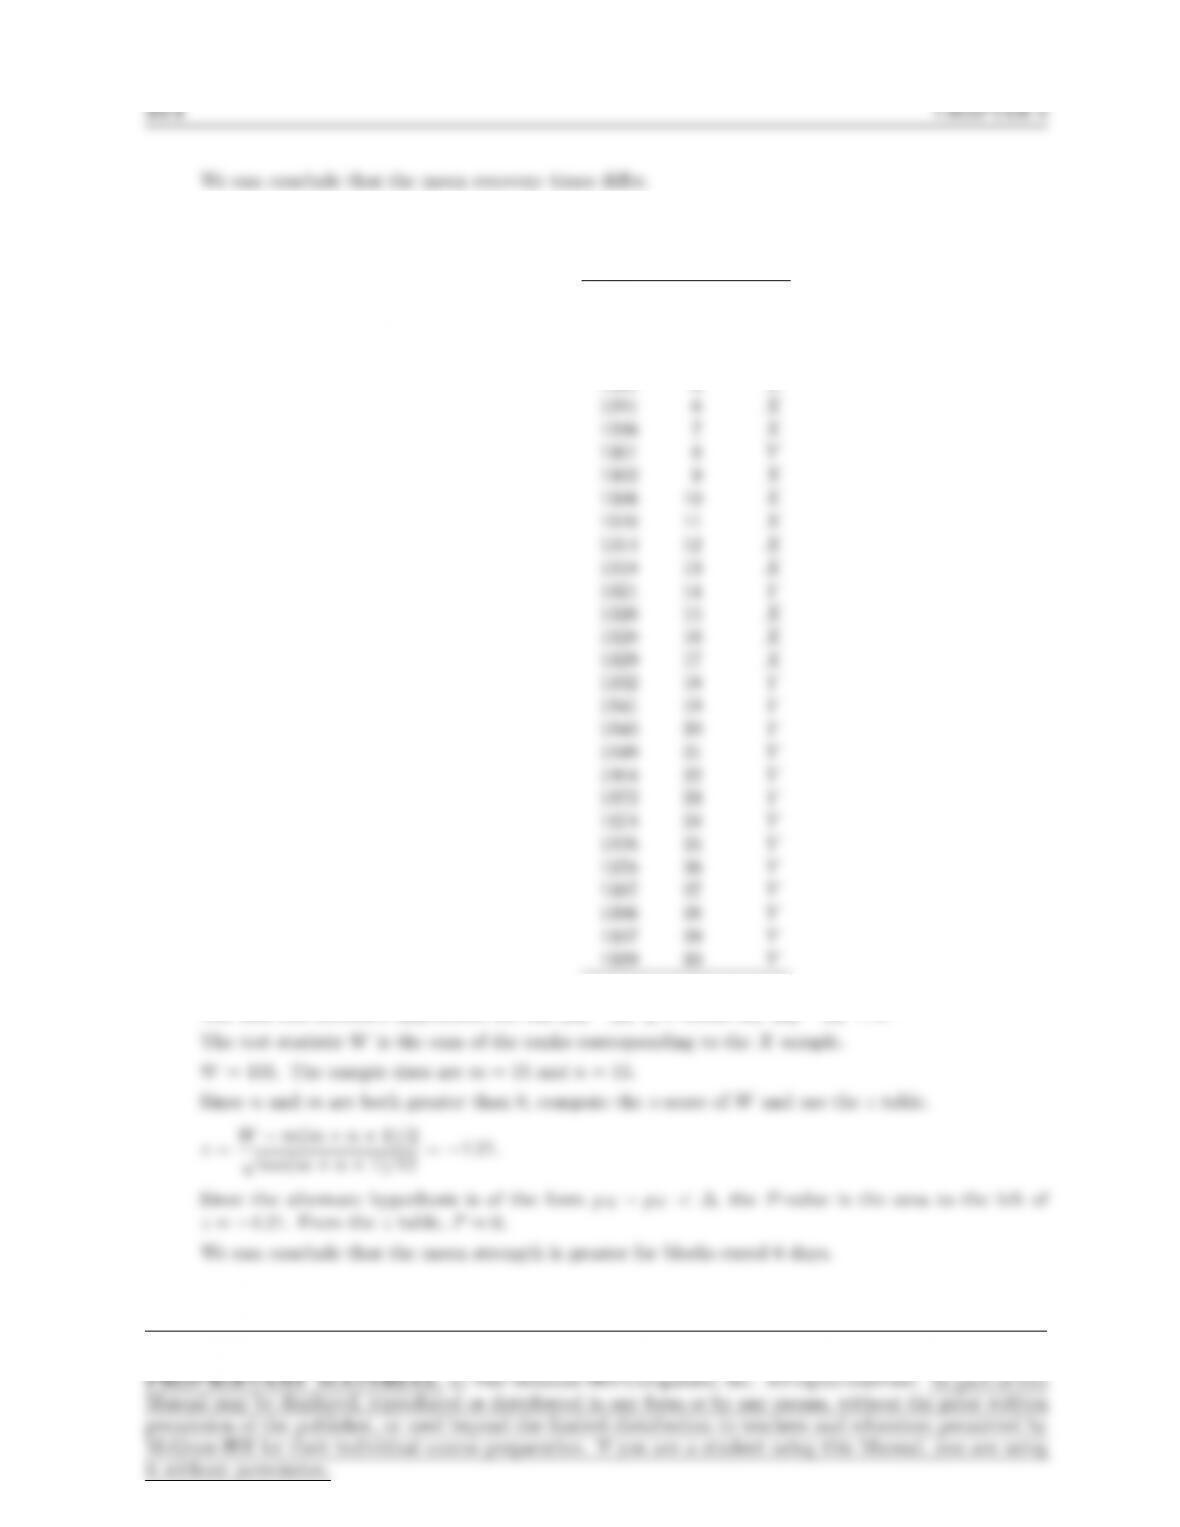
8. The ranks of the combined samples are Value Rank Sample
1255 1.5X
1255 1.5X
1270 3 X
1280 4 X
1287 5 X
The null and alternate hypotheses are H0:µX−µY≥0 versus H1:µX−µY<0.
Page 314

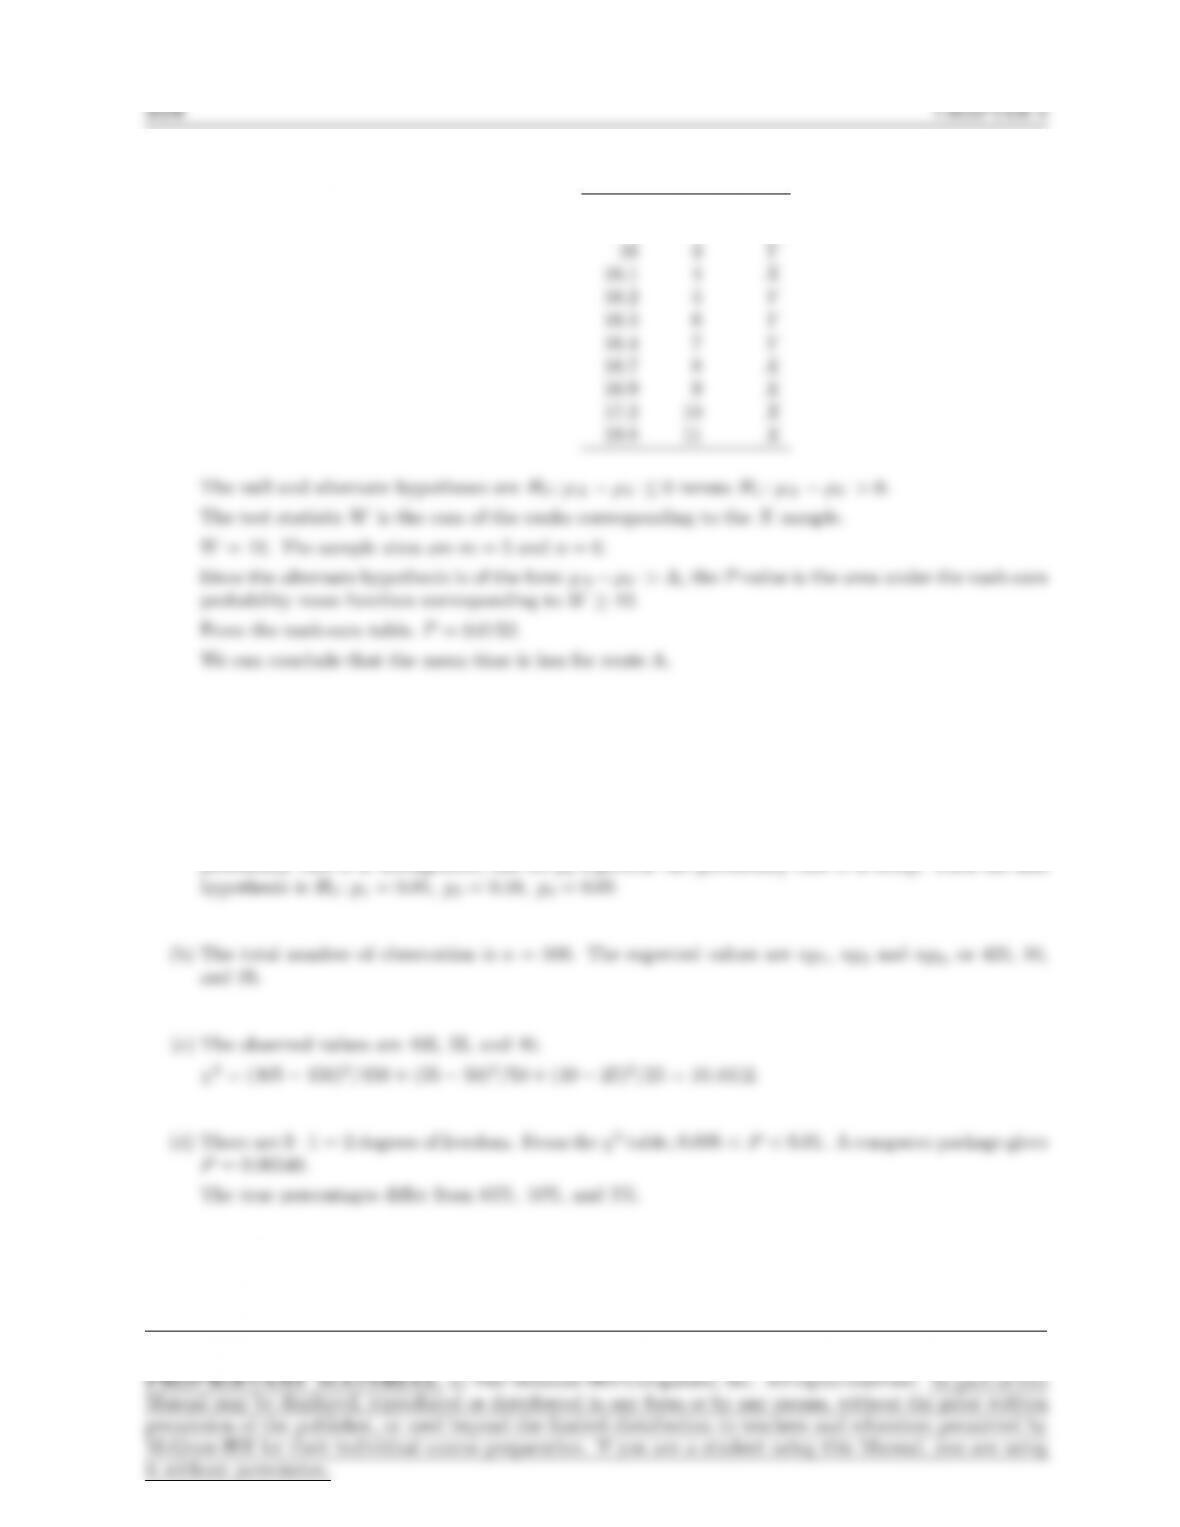
9. The ranks of the combined samples are Value Rank Sample
51 1 Y
59 2 Y
64 4 X
64 4 Y
Page 315
10. The ranks of the combined samples are Value Rank Sample
15.7 1 Y
15.9 2 Y
Section 6.10
1. (a) Let p1represent the probability that a randomly chosen fastener is conforming, let p2represent the
probability that it is downgraded, and let p3represent the probability that it is scrap. Then the null
Page 316
2. (a) Let pij denote the probability that an observation is in column j, given that it is in row i. Then the
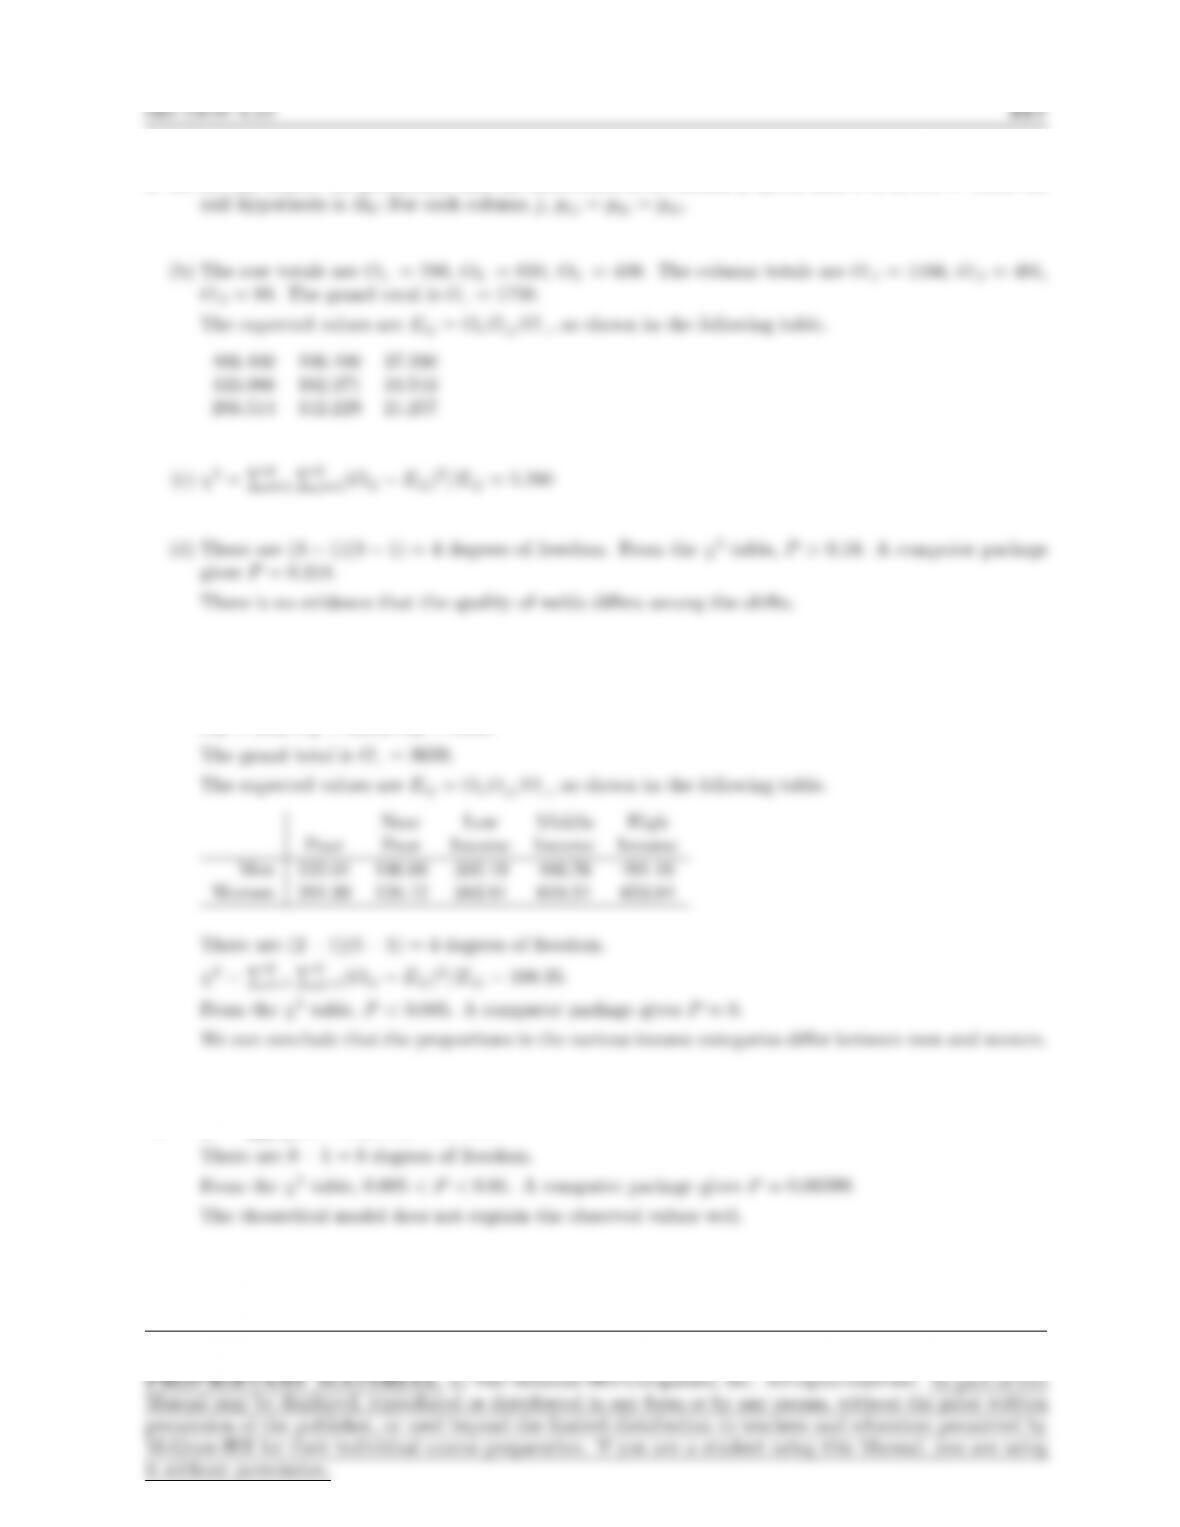
3. The row totals are O.1= 1603 and O.2= 2036. The column totals are O1.= 504, O2.= 229,
O3.= 686, O4.= 1105, O5.= 1115.
4. χ2=P9
i=1(Oi−Ei)2/Ei= 21.475.
Page 317
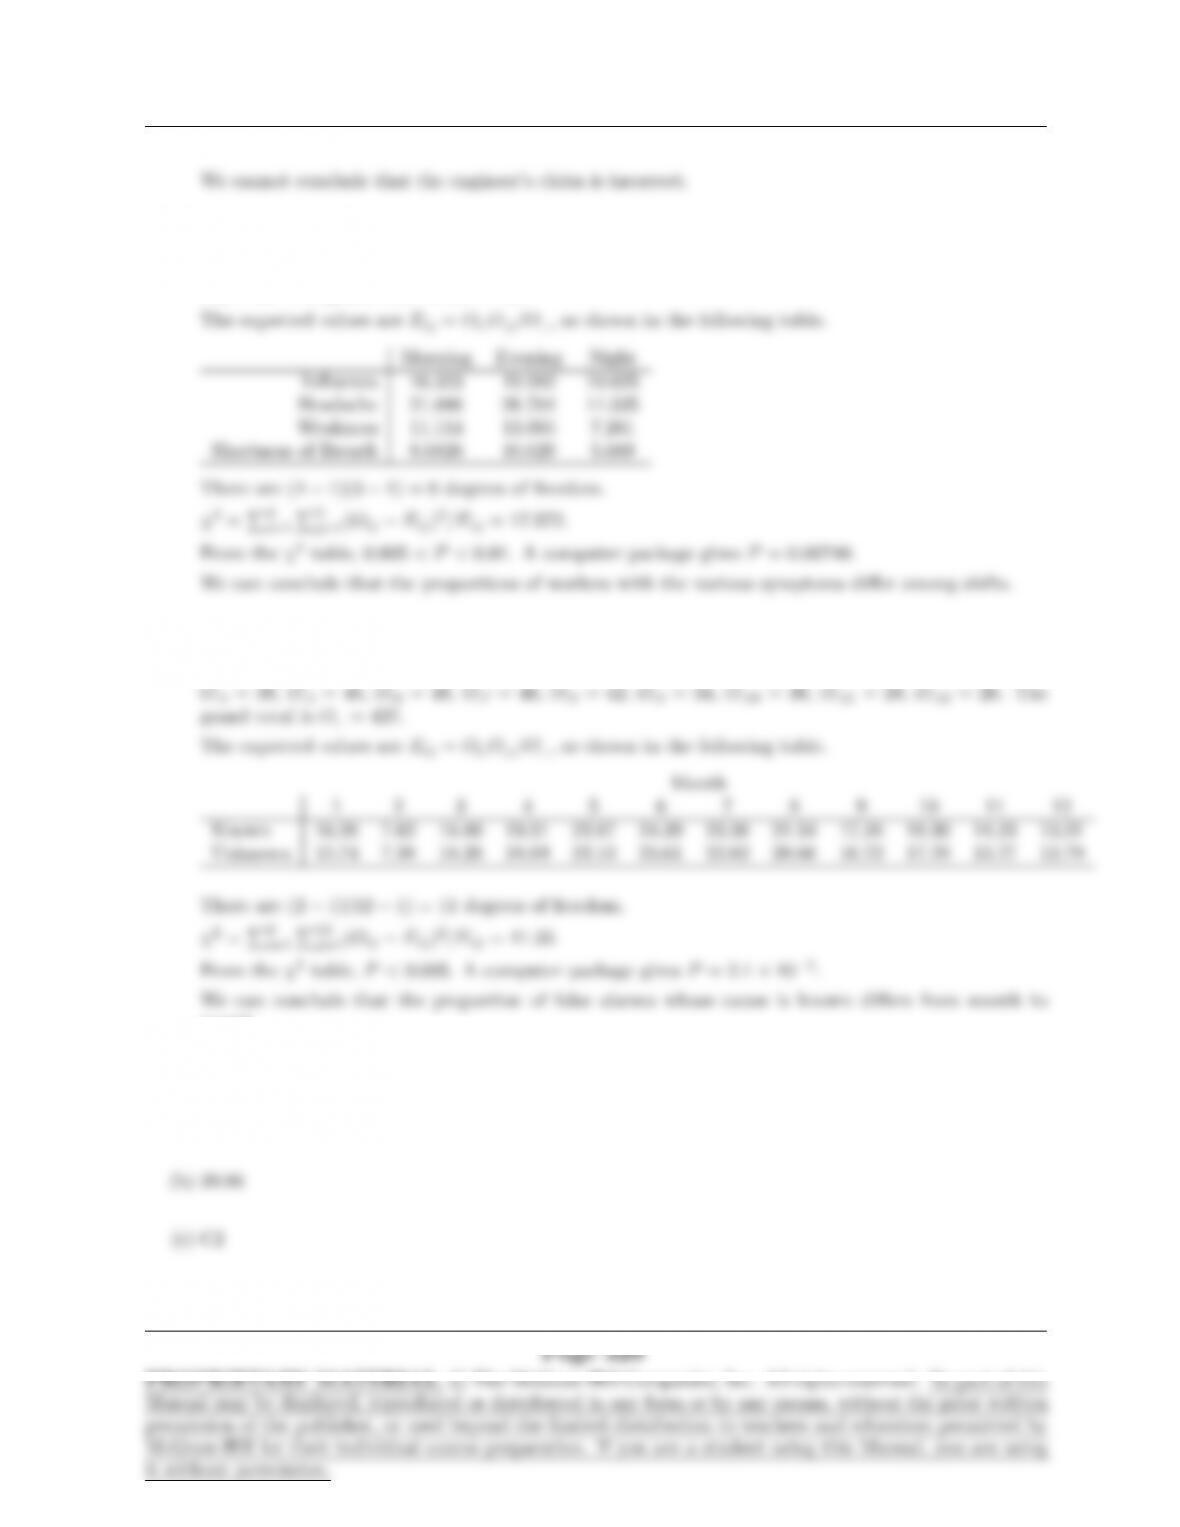
5. The row totals are O1.= 41, O2.= 39, and O3.= 412. The column totals are O.1= 89, O.2= 163,
6. The row totals are O1.= 3557, O2.= 306, O3.= 887. The column totals are O.1= 1454, O.2= 1670,
7. (a) The row totals are O1.= 37, O2.= 25, and O3.= 35. The column totals are O.1= 27, O.2= 35,
(b) The χ2test is appropriate here, since all the expected values are greater than 5.
Page 318
SECTION 6.10 319
8. (a) The row totals are O1.= 40, O2.= 10, O3.= 50. The column totals are O.1= 70, O.2= 10, O.3= 20.
10. It is possible to compute the expected values.
11. Let p1represent the probability that a randomly chosen plate is classifed as premium, let p2represent
320 CHAPTER 6
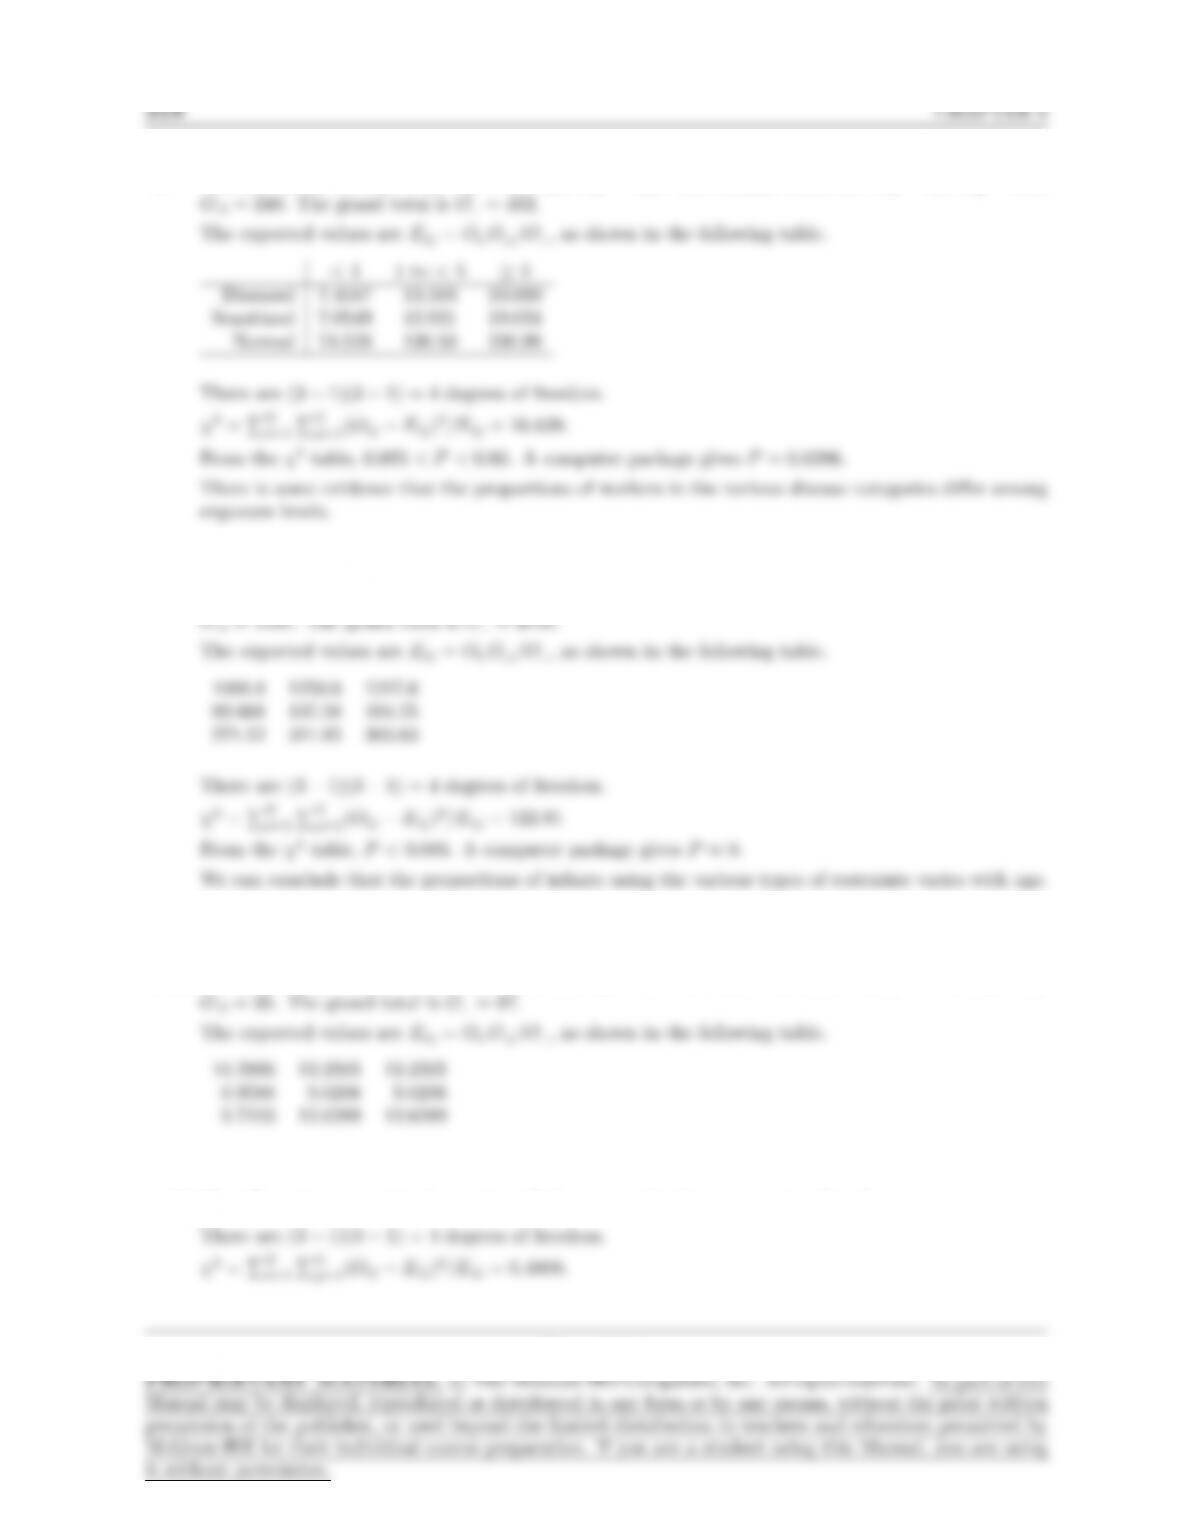
12. The row totals are O1.= 47, O2.= 63, O3.= 32, O4.= 25. The column totals are O.1= 58, O.2= 71,
O.3= 38. The grand total is O.. = 167.
13. The row totals are O1.= 217 and O2.= 210. The column totals are O.1= 32, O.2= 15, O.3= 37,
month.
14. (a) 22
SECTION 6.10 321
Section 6.11
1. s2= 96, n= 11. The null and alternate hypotheses are H0:σ2≤50, H1:σ2>50.
2. s2= 24, n= 29. The null and alternate hypotheses are H0:σ2≥30, H1:σ2<30.
3. s2= 64, n= 25. The null and alternate hypotheses are H0:σ2= 225, H1:σ26= 225.
There is suffcient evidence to contradict the claim.
4. s2= 0.03628, n= 10. The null and alternate hypotheses are H0:σ2= 0.01, H1:σ26= 0.01.
5. s2= 18.49, n= 25. The null and alternate hypotheses are H0:σ2≥25, H1:σ2<25.
Page 321
322 CHAPTER 6
6. s2= 3.61, n= 40. The null and alternate hypotheses are H0:σ2≥7.0756, H1:σ2<7.0756.
7. s2= 7569, n= 20. The null and alternate hypotheses are H0:σ2= 10,000, H1:σ26= 10,000.
8. s2= 2.25, n= 25. The null and alternate hypotheses are H0:σ2≤2.0449, H1:σ2>2.0449.
9. ν1= 7, ν2= 20. From the Ftable, the upper 5% point is 2.51.
Page 322
SECTION 6.12 323
The null and alternate hypotheses are H0:σ2
2/σ2
1≤1 versus H1:σ2
2/σ2
1>1.
(b) The null and alternate hypotheses are H0:σ2
3/σ2
2≤1 versus H1:σ2
3/σ2
2>1.
13. The sample variance of the sodium contents for the brand A is s2
1= 6.4764. The sample size is n1= 9.
The sample variance of the sodium contents for brand B is s2
2= 10.3572. The sample size is n2= 13.
14. The sample variance of the times for the first month is s2
1= 200.7562. The sample size is n1= 7.
month.
Section 6.12
1. (a) True. H0is rejected at any level greater than or equal to 0.03.
Page 323
324 CHAPTER 6
2. (a) Let Xbe the sample mean of the 80 specimens.
Under H0, the population mean is µ= 2, and the population standard deviation is σ= 0.6.
(b) Since the alternate hypothesis is of the form µ < µ0, the rejection region for a 10% level test consists
of the lower 10% of the null distribution.
(c) Since the alternate hypothesis is of the form µ < µ0, the rejection region for a 1% level test consists
of the lower 1% of the null distribution.
3. (a) H0:µ≥90 versus H1:µ < 90
SECTION 6.12 325
(c) This is not an appropriate rejection region. The rejection region should consist of values for Xthat
(d) This is an appropriate rejection region.
(e) This is not an appropriate rejection region. The rejection region should consist of values for Xthat
4. (a) Type I error. H0is true and was rejected.
5. (a) H0says that the claim is true. Therefore H0is true, so rejecting it is a type I error.
Page 325
326 CHAPTER 6
6. The maximum probability of rejecting H0when true is the level α= 0.10.
Section 6.13
1. (a) True. This is the definition of power.
2. (a) True. This is the definition of power.
Page 326
5. (a) H0:µ≥50,000 versus H1:µ < 50,000. H1is true, since the true value of µis 49,500.
(b) The level is the probability of rejecting H0when it is true.
(c) Since the alternate hypothesis is of the form µ < µ0, the 5% rejection region will be the region X≤x5,
(d) For the power to be 0.80, the rejection region must be X≤x0where P(X≤x0) = 0.80 when
328 CHAPTER 6
Therefore the level is 0.4364.
(e) Let nbe the required number of tires.
6. (a) The null distribution of Xis normal with mean µ= 1000 and standard deviation σX= 100/√75 =
11.5470.
(b) The alternate distribution of Xis normal with mean µ= 965 and standard deviation
σX= 100/√75 = 11.5470.
(c) To make the power 0.95, the rejection region must be X≤x0where P(X≤x0) = 0.95 under the
alternate distribution.
Page 328
SECTION 6.13 329
(d) To make the level 5%, the rejection region must be X≤x0where P(X≤x0) = 0.05 under the null
(e) The rejection region for the 5% level test is X≤981.01.
(f) Let nbe the required sample size.
The null distribution is normal with µ= 1000 and σX= 100/√n. The alternate distribution is normal
7. (ii). Since 7 is farther from the null mean of 10 than 8 is, the power against the alternative µ= 7
will be greater than the power against the alternative µ= 8.
8. (a) The null distribution of Xis Bin(250,0.10). Thus the null distribution is approximately normal with
Page 329
330 CHAPTER 6
(b) The alternate distribution of Xis Bin(250,0.06). Thus the alternate distribution is approximately
(c) No. To compute the level, use the standard deviation assumed by the null hypothesis, which is
(d) Let nbe the required sample size.
9. (a) Two-tailed. The alternate hypothesis is of the form p6=p0.
Page 330