274 CHAPTER 6
is the area to the left of z=−2.98.
6. (a) X= 15.2, s= 1.8, n= 87. The null and alternate hypotheses are H0:µ= 15 versus H1:µ6= 15.
z= (15.2−15)/(1.8/√87) = 1.04. Since the alternate hypothesis is of the form µ=µ0, the P-value
7. (a) X= 715, s= 24, n= 60. The null and alternate hypotheses are H0:µ≥740 versus H1:µ < 740.
z= (715 −740)/(24/√60) = −8.07. Since the alternate hypothesis is of the form µ < µ0, the P-value
8. (a) X= 25, s= 60, n= 100. The null and alternate hypotheses are H0:µ= 0 versus H1:µ6= 0.
z= (25 −0)/(60/√100) = 4.17. Since the alternate hypothesis is of the form µ=µ0, the P-value is
9. (a) X= 8.24, s= 16.33, n= 126. The null and alternate hypotheses are H0:µ≥10 versus H1:µ < 10.
Page 274
SECTION 6.1 275
10. (a) X= 1356, s= 70, n= 100. The null and alternate hypotheses are H0:µ≤1350 versus H1:µ > 1350.
11. (ii) 5. The null distribution specifies that the population mean, which is also the mean of X, is the
14. (a) Two-tailed. The alternate hypothesis is of the form µ6=µ0.
Page 275
276 CHAPTER 6
15. (a) SE Mean = s/√n= 2.00819/√87 = 0.2153.
Section 6.2
2. (a) True.
Page 276
3. (iv). A P-value of 0.01 means that if H0is true, then the observed value of the test statistic was in
4. (v). A P-value of 0.50 means that if H0is true, then the observed value of the test statistic was in
5. (a) True. The result is statistically significant at any level greater than or equal to 2%.
6. (a) No. If the P-value is 0.20, then the result is not statistically significant at the 5% level.
7. (iii). Since the decrease is statistically significant, it is reasonable to conclude that the homicide rate
9. (a) H0:µ≤8. If H0is rejected, we can conclude that µ > 8, and that the new battery should be used.
Page 277
278 CHAPTER 6
11. (a) (ii) The scale is out of calibration. If H0is rejected, we conclude that H0is false, so µ6= 10.
12. (a) No. P= 0.30 is not small. Both the null and alternate hypotheses are therefore plausible.
13. No, she cannot conclude that the null hypothesis is true, only that it is plausible.
SECTION 6.3 279
18. (a) No, we would need to know the 99% lower confidence bound in order to determine whether P < 0.01.
20. No, the confidence bound itself tells us only that P < 0.02. To determine the P-value more precisely,
Section 6.3
1. X= 35, n= 1000, bp= 35/1000 = 0.035.
2. X= 281, n= 444, bp= 281/444 = 0.632883.
The null and alternate hypotheses are H0:p≤0.60 versus H1:p > 0.60.
3. X= 29, n= 50, bp= 29/50 = 0.58.
280 CHAPTER 6
4. X= 49, n= 73, bp= 0.671.
so P= 0.0017. It can be concluded that more than half of the vehicles exceed the speed limit.
5. X= 274, n= 500, bp= 274/500 = 0.548.
6. X= 65, n= 113, bp= 65/113 = 0.575221.
7. X= 110, n= 150, bp= 110/150 = 0.733.
8. X= 12, n= 300, bp= 12/300 = 0.04.
Page 280
SECTION 6.3 281
9. X= 42, n= 300, bp= 42/300 = 0.14.
10. X= 28, n= 70, bp= 28/70 = 0.25.
11. X= 73, n= 100, bp= 73/100 = 0.73.
12. (a) One-tailed. The alternate hypothesis is of the form p < p0.
Page 281
282 CHAPTER 6
(e) X= 73, n= 240, bp= 73/240 = 0.304167.
The null and alternate hypotheses are H0:p≤0.25 versus H1:p > 0.25.
13. (a) Sample p = bp= 345/500 = 0.690.
Section 6.4
1. (a) X= 100.01, s= 0.0264575, n= 3. There are 3 −1 = 2 degrees of freedom.
The null and alternate hypotheses are H0:µ= 100 versus H1:µ6= 100.
2. (a) Reject the assumptions: the value 221.03 is an outlier.
SECTION 6.4 283
3. (a) H0:µ≤5 versus H1:µ > 5
4. (a) The null and alternate hypotheses are H0:µ= 23 versus H1:µ6= 23.
5. (a) X= 6.7, s= 3.9, n= 20. There are 20 −1 = 19 degrees of freedom.
The null and alternate hypotheses are H0:µ≥10 versus H1:µ < 10.
t= (6.7−10)/(3.9/√20) = −3.784.
Since the alternate hypothesis is of the form µ < µ0, the P-value is the area to the left of t=−3.784.
6. X= 3.507, s= 0.8406, n= 6. There are 6 −1 = 5 degrees of freedom.
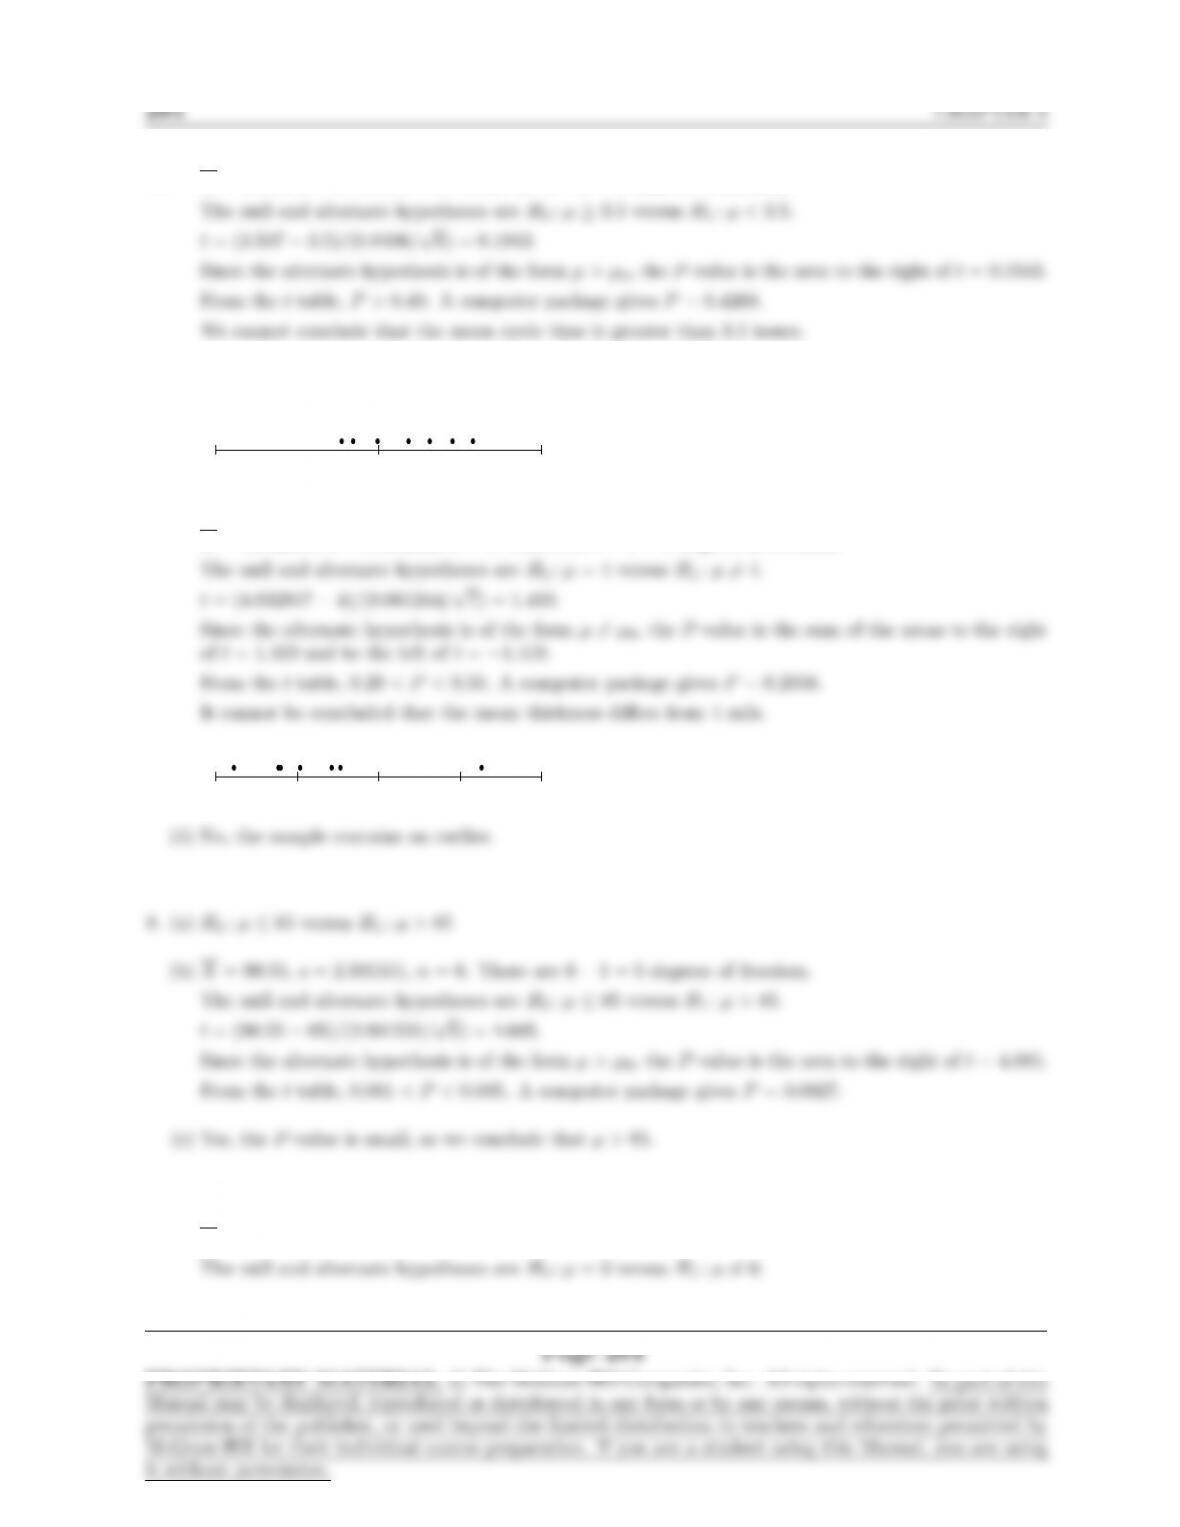
7. (a)
3.8 4 4.2
(b) Yes, the sample contains no outliers.
X= 4.032857, s= 0.061244, n= 7. There are 7 −1 = 6 degrees of freedom.
(c)
3.9 4 4.1 4.2 4.3
9. X= 457.8, s= 317.7, n= 18. There are 18 −1 = 17 degrees of freedom.
SECTION 6.4 285
10. X= 7.22, s= 2.328519, n= 5. There are 5 −1 = 4 degrees of freedom.
The null and alternate hypotheses are H0:µ≥8 versus H1:µ < 8.
11. X= 0.242, s= 0.031, n= 10. There are 10 −1 = 9 degrees of freedom.
12. (a) One-tailed. The alternate hypothesis is of the form µ > µ0.
(b) H0:µ≤5.5
Page 285
13. (a) StDev = (SE Mean)√N = 1.8389√11 = 6.0989.
Section 6.5
1. X= 8.5, sX= 1.9, nX= 58, Y= 11.9, sY= 3.6, nY= 58.
2. X= 20.95, sX= 14.5, nX= 482, Y= 22.79, sY= 15.6, nY= 614.
3. X= 5.92, sX= 0.15, nX= 42, Y= 6.05, sY= 0.16, nY= 37.
4. X= 2.49, sX= 4.87, nX= 413, Y= 1.22, sY= 3.24, nY= 382.
Page 286
SECTION 6.5 287
5. X= 40, sX= 12, nX= 75, Y= 42, sY= 15, nY= 100.
6. (a) The 60 counts may not be independent if they are taken in consecutive time periods.
7. (a) X= 7.79, sX= 1.06, nX= 80, Y= 7.64, sY= 1.31, nY= 80.
(b) The null and alternate hypotheses are H0:µX−µY= 0 versus H1:µX−µY6= 0.
Page 287
(b) X= 495.6, sX= 19.4, nX= 50, Y= 391.2, sY= 17.2, nY= 60.
The null and alternate hypotheses are H0:µX−µY≤100 versus H1:µX−µY>100.
9. (a) X= 4.7, sX= 7.2, nX= 77, Y= 2.6, sY= 5.9, nY= 79.
(b) X= 4.7, sX= 7.2, nX= 77, Y= 2.6, sY= 5.9, nY= 79.
10. (a) X= 5.2, sX= 3.1, nX= 60, Y= 6.1, sY= 2.8, nY= 72.
(b) We cannot conclude that the mean checkout time would decrease if everyone used the self-service
Page 288
11. X= 7.38, sX= 12.83, nX= 92, Y= 8.20, sY= 9.84, nY= 123.
12. (a) One-tailed. The alternate hypothesis is of the form µX−µY<∆.
13. (a) (i) StDev = (SE Mean)√N = 1.26√78 = 11.128.
Section 6.6
1. (a) H0:pX−pY≥0 versus H1:pX−pY<0
Page 289
290 CHAPTER 6
(b) X= 960, nX= 1000, bpX= 960/1000 = 0.960, Y= 582, nY= 600, bpY= 582/600 = 0.970,
2. (a) H0:pX−pY≥0 versus H1:pX−pY<0
(b) X= 150, nX= 180, bpX= 150/180 = 0.83333, Y= 233, nY= 270, bpY= 233/270 = 0.86296,
3. X= 245, nX= 307, bpX= 245/307 = 0.7980, Y= 304, nY= 347, bpY= 304/347 = 0.8761,
Page 290
SECTION 6.6 291
bp= (21 + 20)/(154 + 183) = 0.12166.
5. X= 102, nX= 230, bpX= 102/230 = 0.443478, Y= 20, nY= 72, bpY= 20/72 = 0.277778,
bp= (102 + 20)/(230 + 72) = 0.403974.
6. X= 77, nX= 365, bpX= 77/365 = 0.210959, Y= 23, nY= 179, bpY= 23/179 = 0.128492,
bp= (77 + 23)/(365 + 179) = 0.1838235.
7. X= 20, nX= 1200, bpX= 20/1200 = 0.016667, Y= 15, nY= 1500, bpY= 15/1500 = 0.01,
bp= (20 + 15)/(1200 + 1500) = 0.012963.
Page 291
292 CHAPTER 6
8. bpX= 0.070, nX= 10292, bpY= 0.098, nY= 51460.
bp= (nXbpX+nYbpY)/(nX+nY) = 0.0933333.
colorectal cancer.
9. X= 76, nX= 164, bpX= 76/164 = 0.46341, Y= 48, nY= 96, bpY= 48/96 = 0.5,
10. X= 106, nX= 355, bpX= 106/355 = 0.298592, Y= 147, nY= 467, bpY= 147/467 = 0.314775,
11. X= 195, nX= 5320, bpX= 195/5320 = 0.036654, Y= 33, nY= 1120, bpY= 33/1120 = 0.029463,
Page 292
SECTION 6.6 293
12. X= 87, nX= 546, bpX= 87/546 = 0.159341, Y= 74, nY= 508, bpY= 74/508 = 0.145669,
bp= (87 + 74)/(546 + 508) = 0.15275.
13. No, because the two samples are not independent.
14. (a) Two-tailed. The alternate hypothesis is of the form p1−p26= 0.
15. (a) 101/153 = 0.660131.
Page 293