472 CHAPTER 10
Chapter 10
Section 10.1
1. (a) Count
2. (a) True
3. (a) is in control
4. (i) It must still be monitored continually.
5. (a) False. Being in a state of statistical control means only that no special causes are operating. It is still
SECTION 10.2 473
Section 10.2
1. (a) The sample size is n= 4. The upper and lower limits for the R-chart are D3Rand D4R, respectively.
From the control chart table, D3= 0 and D4= 2.282.
2. The process is never out of control.
474 CHAPTER 10
3. (a) The sample size is n= 5. The upper and lower limits for the R-chart are D3Rand D4R, respectively.
(b) The upper and lower limits for the X-chart are X−A2Rand X+A2R, respectively.
(c) The 1σlimits are X−A2R/3 = 2.478 and X+A2R/3 = 2.5318, respectively.
4. (a) The sample size is n= 5. The upper and lower limits for the S-chart are B3sand B4s, respectively.
(b) The upper and lower limits for the X-chart are X−A3sand X+A3s, respectively.
(c) The 1σlimits are X−A3s/3 = 2.4779 and X+A3s/3 = 2.5321, respectively.
5. (a) Xhas a normal distribution with µ= 14 and σX= 3/√5 = 1.341641.
Page 474
SECTION 10.2 475
(c) We will find the required value for σX.
(d) Let nbe the required sample size. Then σX= 3/√n.
6. (a) Xhas a normal distribution with µ= 9 and σX= 2/√4 = 1.
Page 475
476 CHAPTER 10
(b) Let mbe the required value. Since the shift is upward, m > 8.
The probability that a point plots outside the 3σlimits is p=P(X < 5) + P(X > 11).
(c) We will find the required value for σX.
(d) Let nbe the required sample size. Then σX= 2/√n.
7. The probability of a false alarm on any given sample is 0.0027, and the probability that there will not
Page 476
SECTION 10.2 477
8. (a) The sample size is n= 8. The upper and lower limits for the R-chart are D3Rand D4R, respectively.
From the control chart table, D3= 0.136 and D4= 1.864.
9. (a) The sample size is n= 8. The upper and lower limits for the S-chart are B3sand B4s, respectively.
10. (a) The sample size is n= 5. The upper and lower limits for the R-chart are D3Rand D4R, respectively.
Page 477
478 CHAPTER 10
(c) The 1σlimits are X−A2R/3 = 9.591 and X+A2R/3 = 10.029, respectively.
11. (a) The sample size is n= 5. The upper and lower limits for the S-chart are B3sand B4s, respectively.
From the control chart table, B3= 0 and B4= 2.089.
12. (a) The sample size is n= 4. The upper and lower limits for the R-chart are D3Rand D4R, respectively.
From the control chart table, D3= 0 and D4= 2.282.
13. (a) The sample size is n= 4. The upper and lower limits for the S-chart are B3sand B4s, respectively.
SECTION 10.3 479
Section 10.3
1. The sample size is n= 200. p= 1.64/30 = 0.054667.
2. (a) The sample size is n= 300.
3. Yes, the only information needed to compute the control limits is pand the sample size n. In this
Page 479
480 CHAPTER 10
4. Yes the process is out of control on the sample with 24 defectives, since the sample proportion of 0.24
6. c= 876/70 = 12.51.
8. (a) The average number of defectives per sample is c= 45.3.
Section 10.4
1. (a) No samples need be deleted.
SECTION 10.4 481
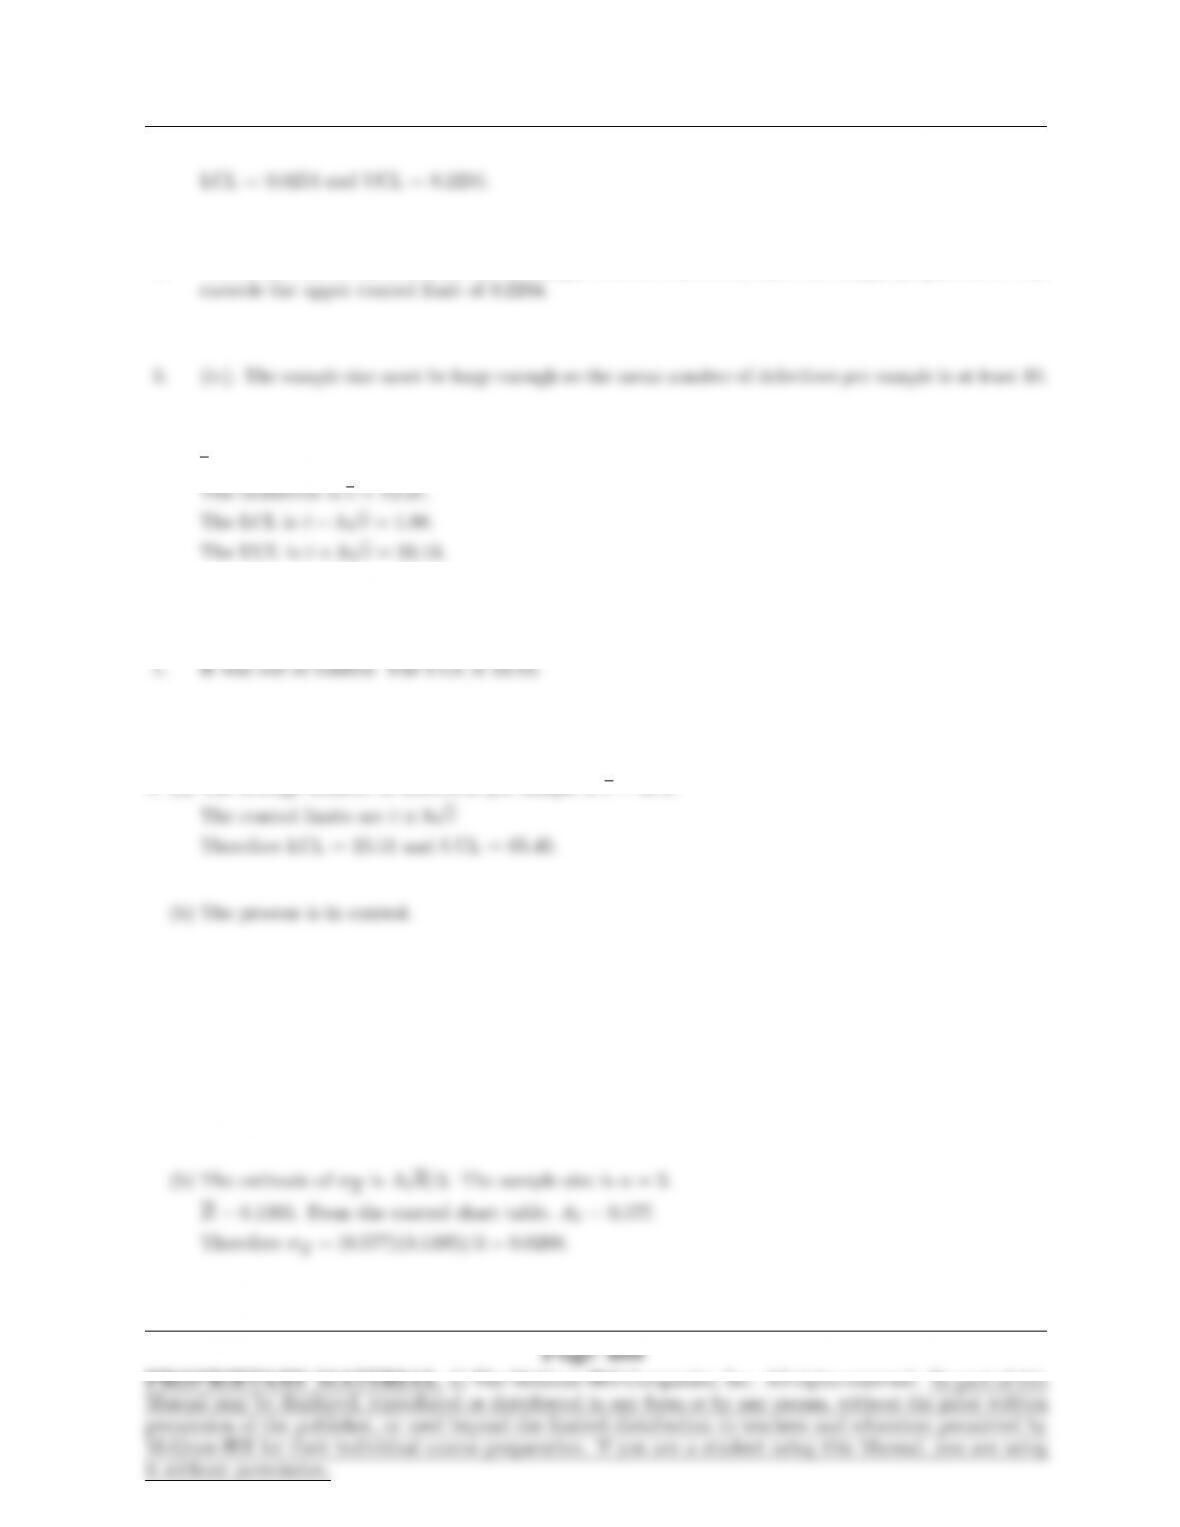
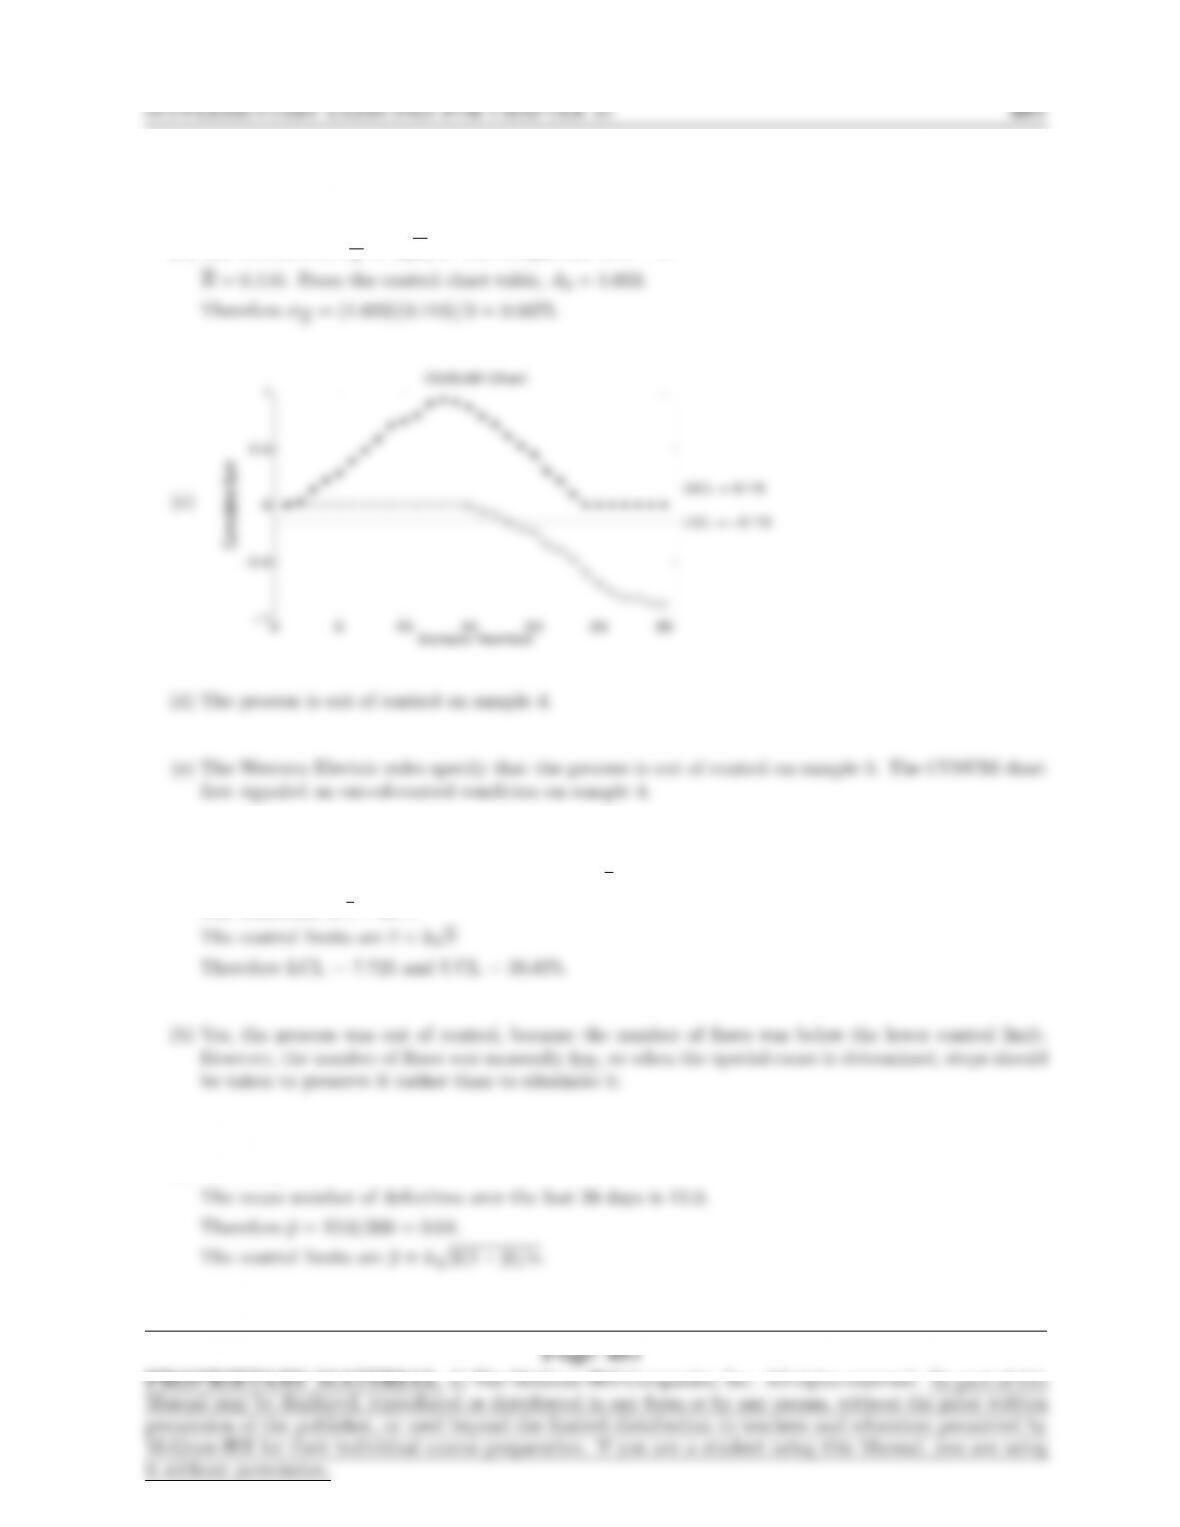
(c)
0 5 10 15 20
−0.3
−0.2
−0.1
0
0.1
0.2
0.3
0.4
Sample Number
Cumulative Sum
CUSUM Chart
UCL = 0.107
LCL = −0.107
(d) The process is out of control on sample 8.
(e) The Western Electric rules specify that the process is out of control on sample 7.
2. (a) No samples need be deleted.
Sample Number
CUSUM Chart
3. (a) No samples need be deleted.
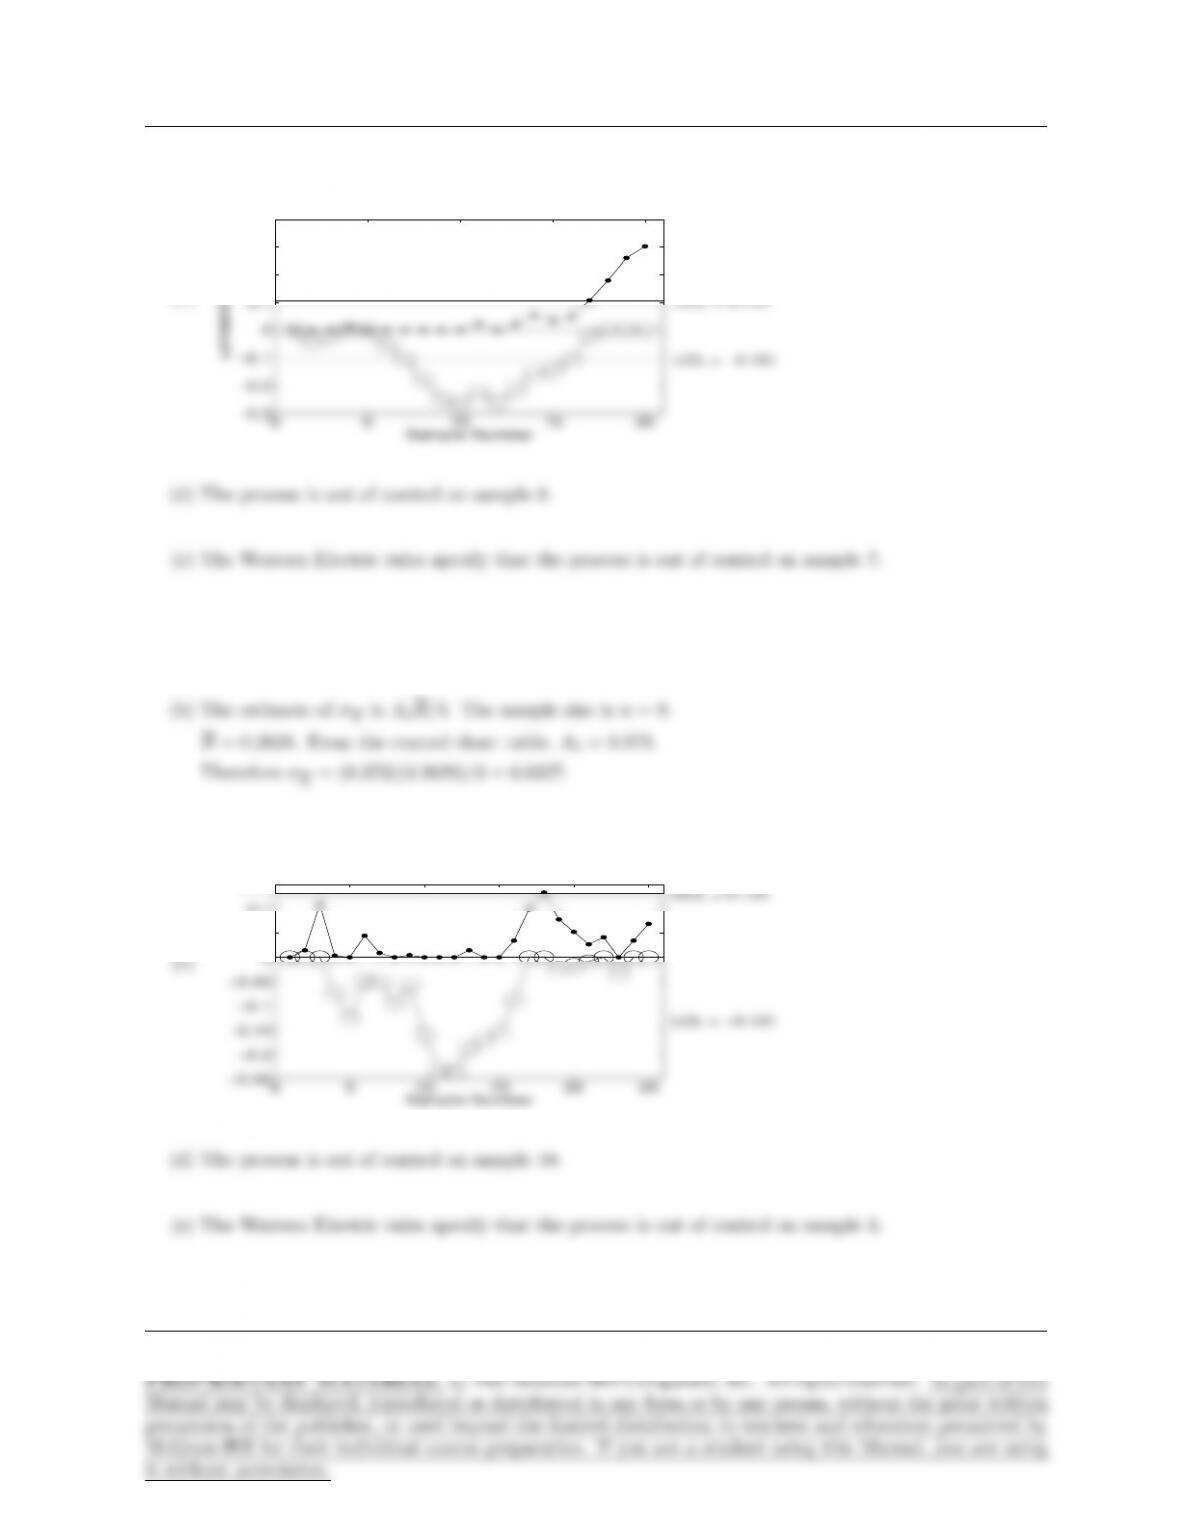
(b) The estimate of σXis A2R/3. The sample size is n= 5.
SECTION 10.4 483
2
4
6
8
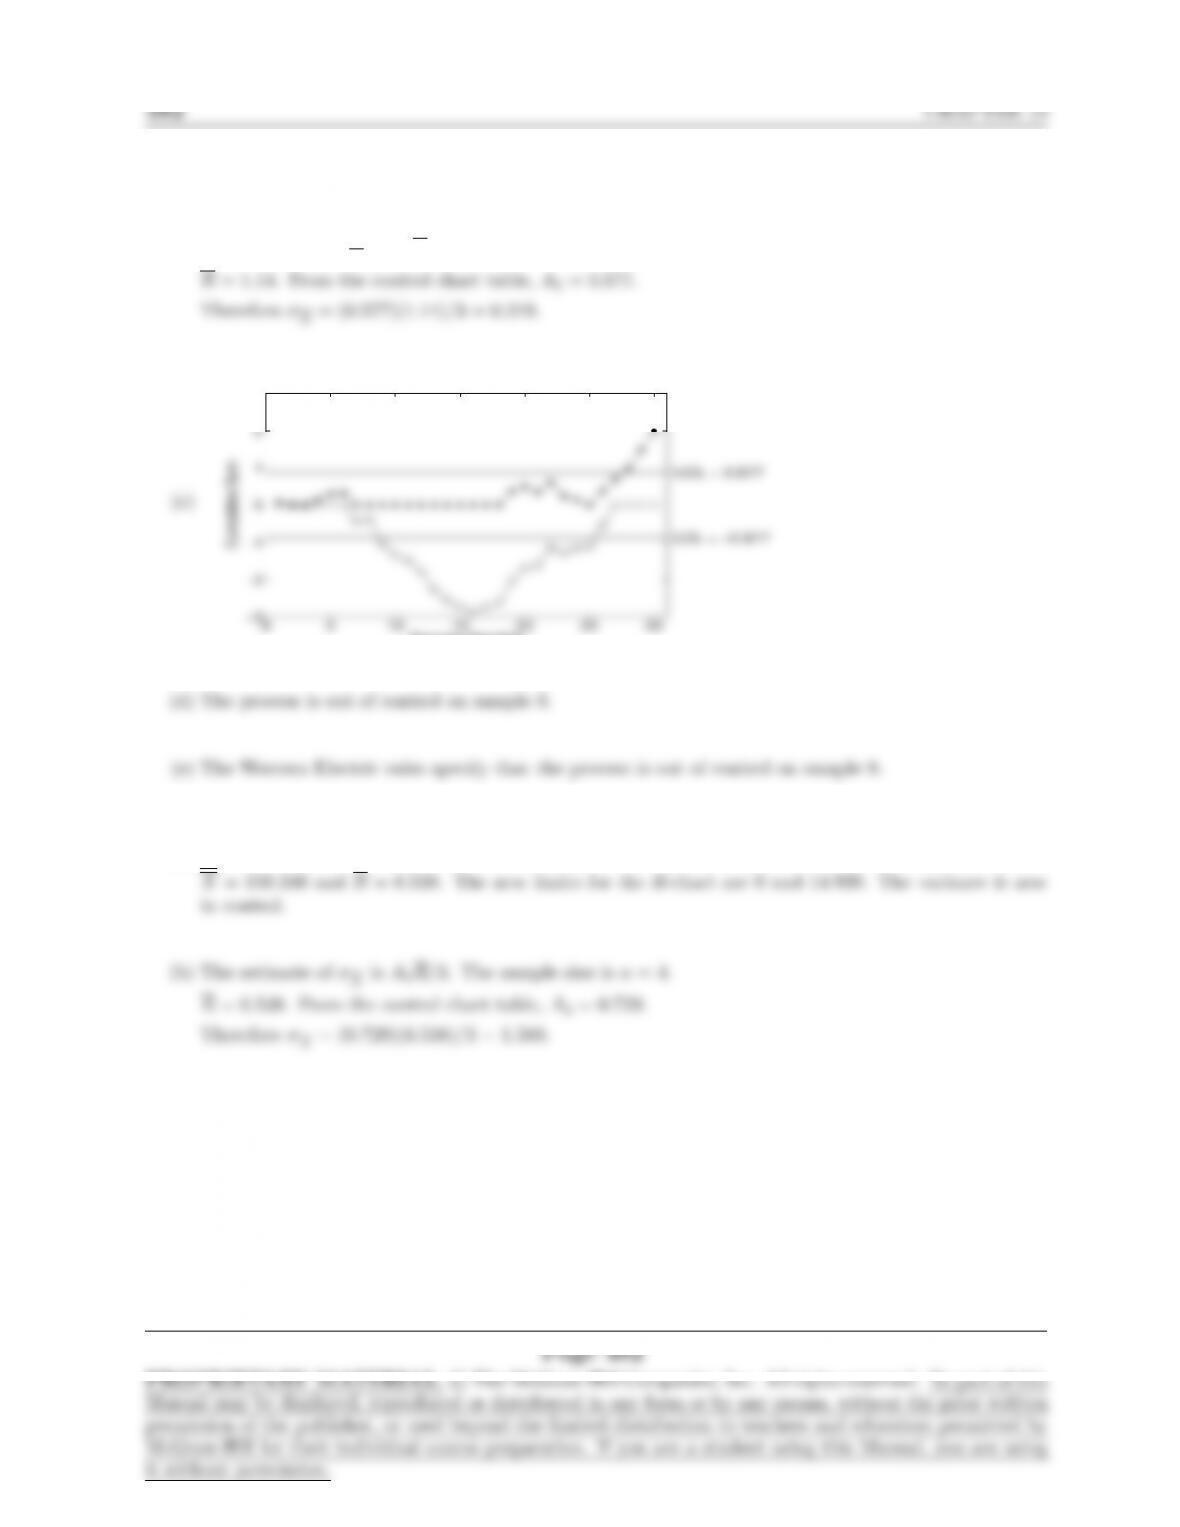
CUSUM Chart
UCL = 6.355
484 CHAPTER 10
Section 10.5
1. (a) bµ=X= 0.248, s= 0.002, LSL = 0.246, USL = 0.254. The sample size is n= 6.
2. (a) bµ=X= 15.52, R= 0.05, LSL = 15.40, USL = 15.60. The sample size is n= 8.
3. (a) The capability is maximized when the process mean is equidistant from the specification limits.
Therefore the process mean should be set to 15.50.
4. (a) The capability is maximized when the process mean is equidistant from the specification limits.
Therefore the process mean should be set to 0.250.
Page 484
5. (a) Let µbe the optimal setting for the process mean.
Supplementary Exercises for Chapter 10
1. The sample size is n= 300. p= 5.83/100 = 0.0583.
(b) If µ=σX, then the z-scores for the upper and lower control limits are (2.0σX−σX)/σX= 1.00 and
(−2.0σX−σX)/σX=−3.00 respectively.
Page 485
486 CHAPTER 10
Since this is an upward shift, P(X > 2.0σX)> P (X < −2.0σX).
3. (a) The sample size is n= 3. The upper and lower limits for the R-chart are D3Rand D4R, respectively.
From the control chart table, D3= 0 and D4= 2.575.
4. (a) The sample size is n= 3. The upper and lower limits for the S-chart are B3sand B4s, respectively.
From the control chart table, B3= 0 and B4= 2.568.
Page 486
5. (a) No samples need be deleted.
(b) The estimate of σXis A2R/3. The sample size is n= 3.
6. (a) The average number of defectives per sample is c= 1085/50 = 21.7.
The centerline is c= 21.7.
7. (a) The sample size is n= 300.
488 CHAPTER 10
Page 488
APPENDIX B 489
Appendix B
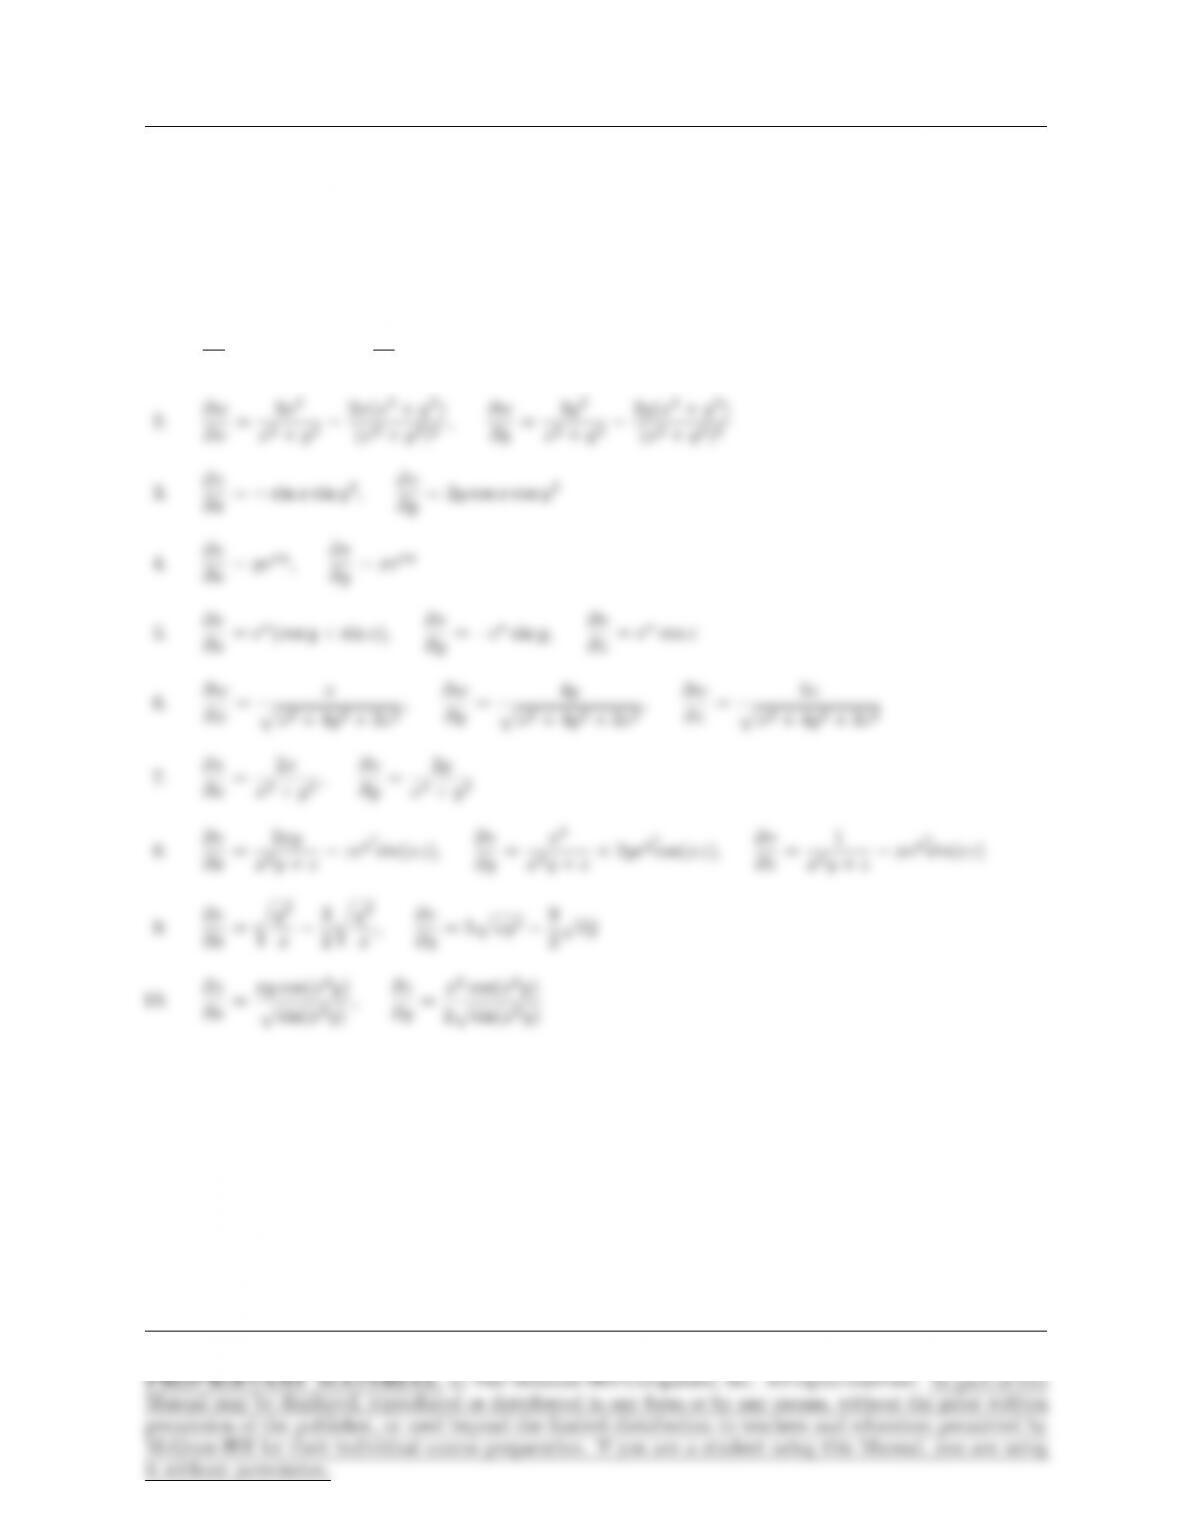
1. ∂v
∂x = 3 + 2y4,∂v
∂y = 8xy3
Page 489