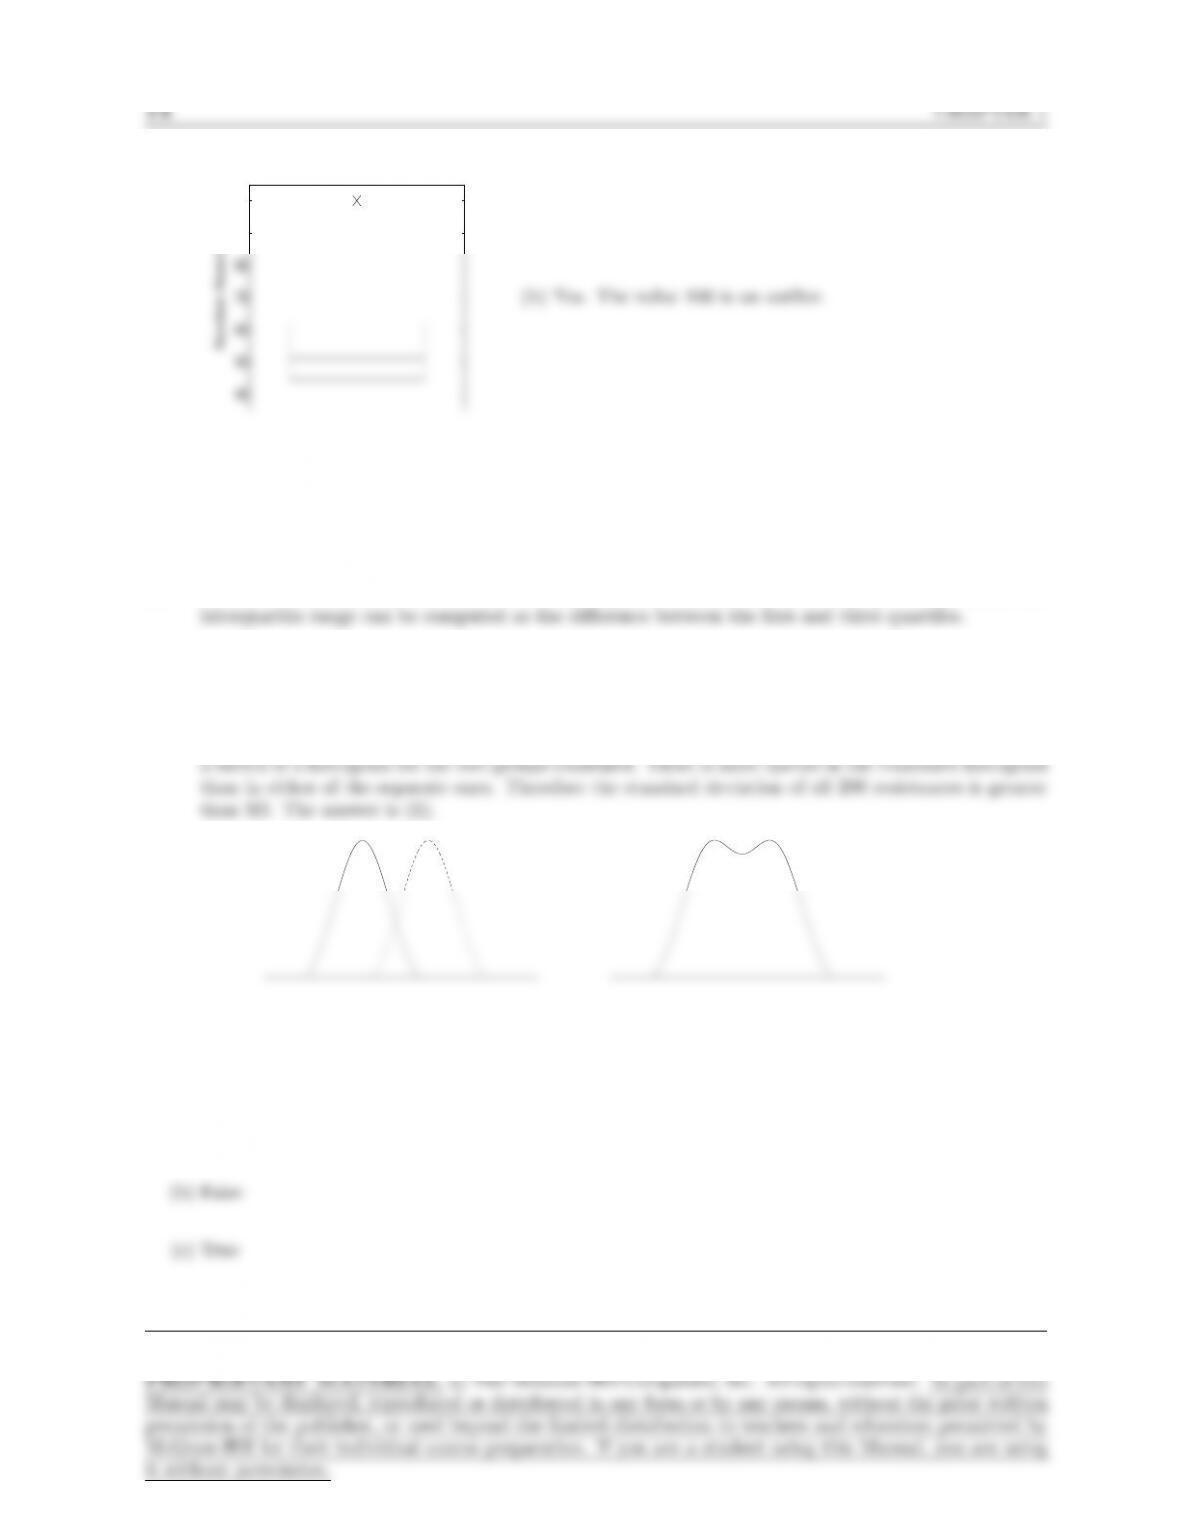
11. (a)
40
50
60
70
80
90
100
Number Absent
(b) Yes. The value 100 is an outlier.
12. The mean. The median, and the first and third quartiles are indicated directly on a boxplot, and the
13. The figure on the left is a sketch of separate histograms for each group. The histogram on the right is
14. (a) True
Page 14
SECTION 1.3 15
(d) False
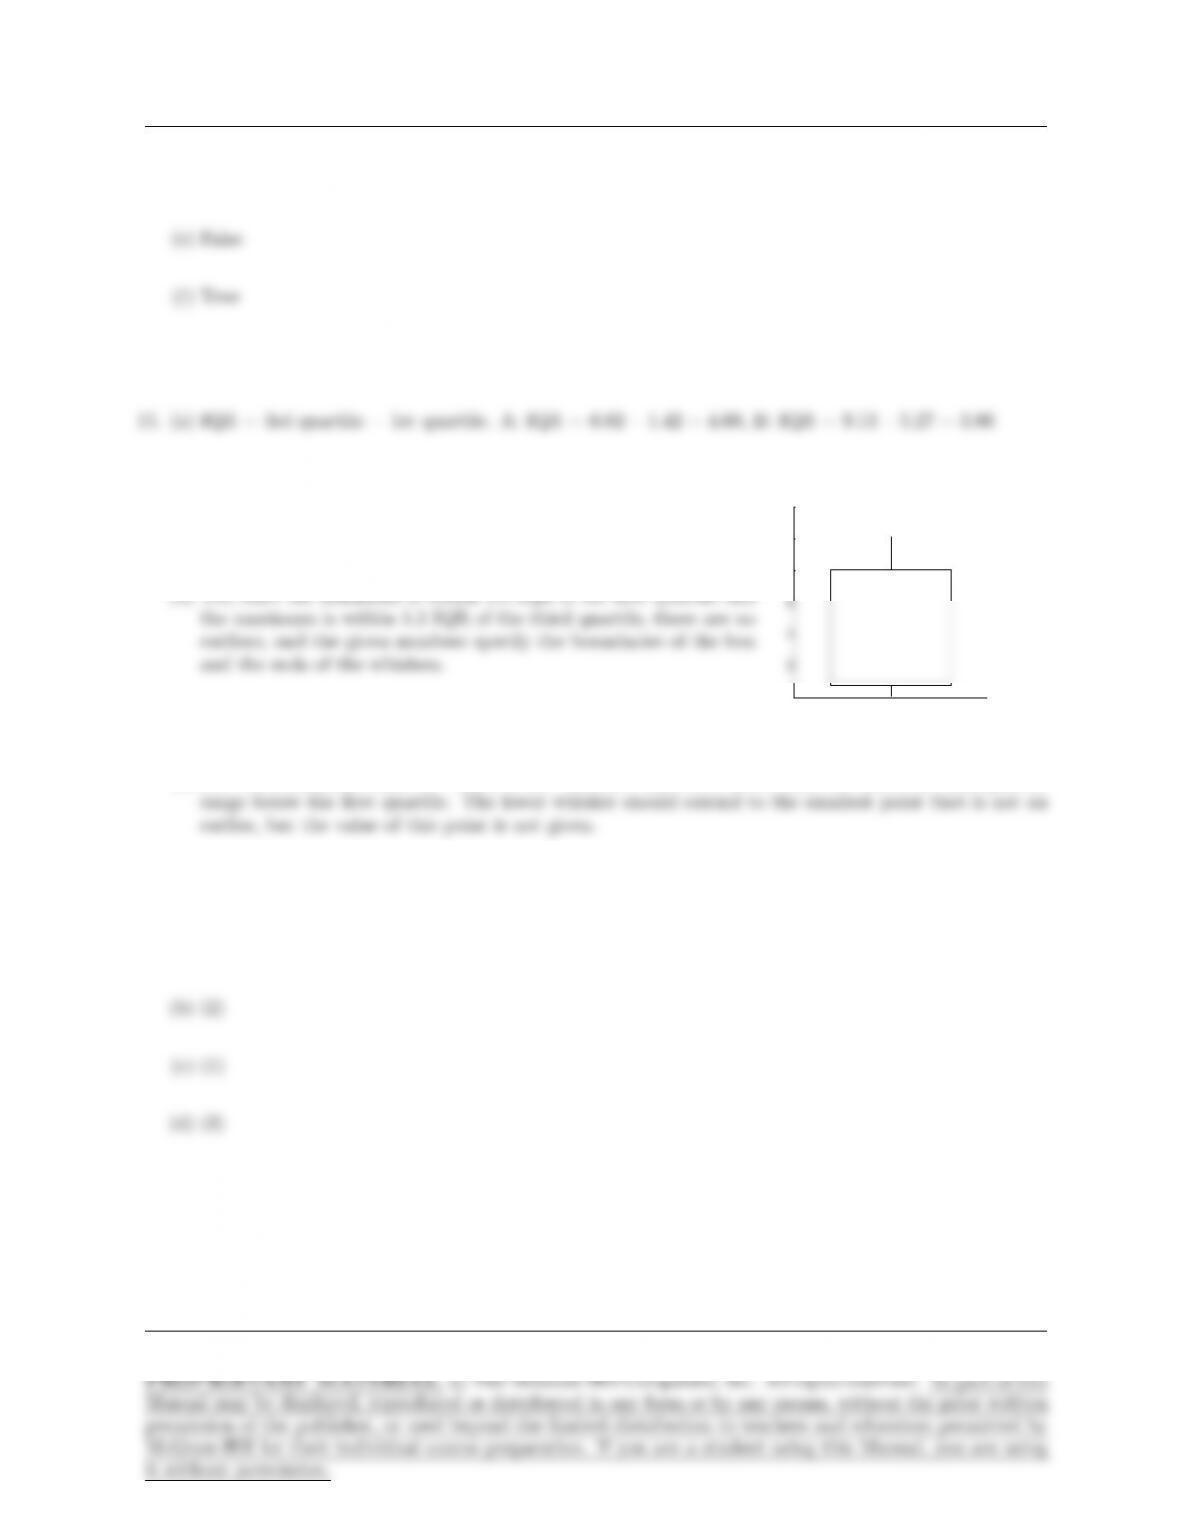
(b) Yes, since the minimum is within 1.5 IQR of the first quartile and
0
6
8
10
12
(c) No. The minimum value of −2.235 is an “outlier,” since it is more than 1.5 times the interquartile
16. (a) (4)
Page 15
16 CHAPTER 1
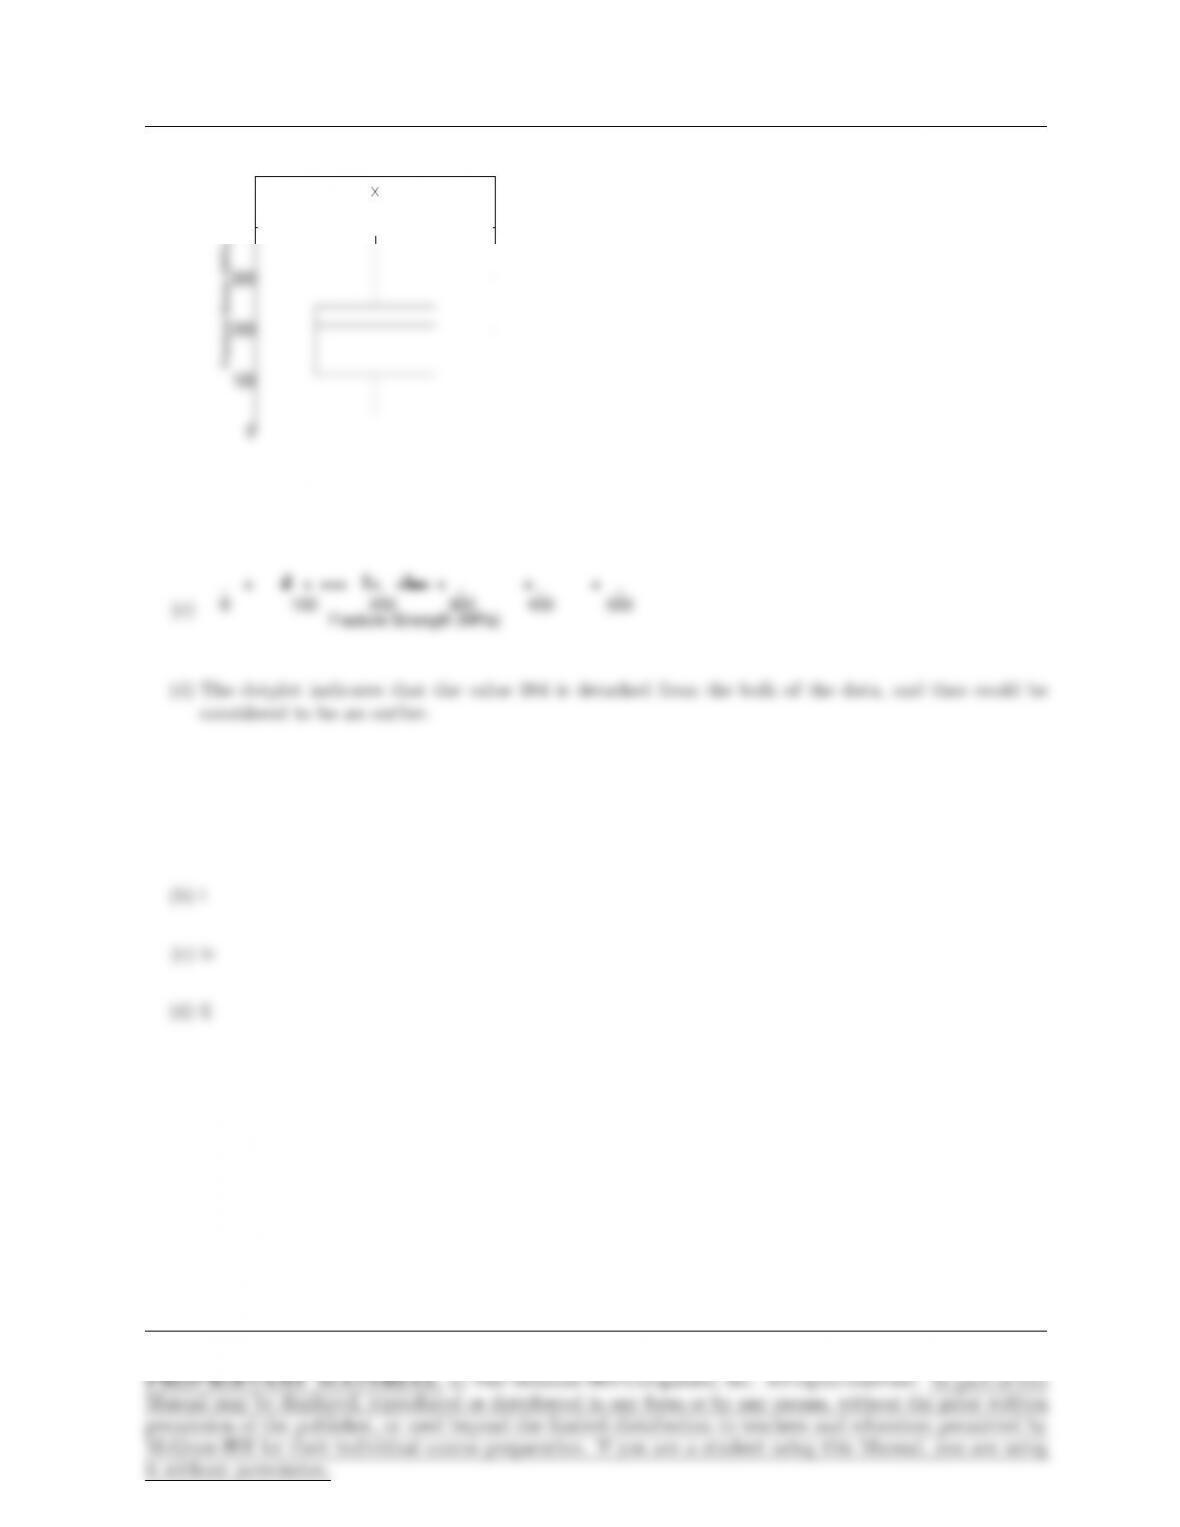
17. (a)
0
100
200
300
400
500
Fracture Stress (MPa)
(b) The boxplot indicates that the value 470 is an outlier.
18. (a) iii
Page 16
SUPPLEMENTARY EXERCISES FOR CHAPTER 1 17
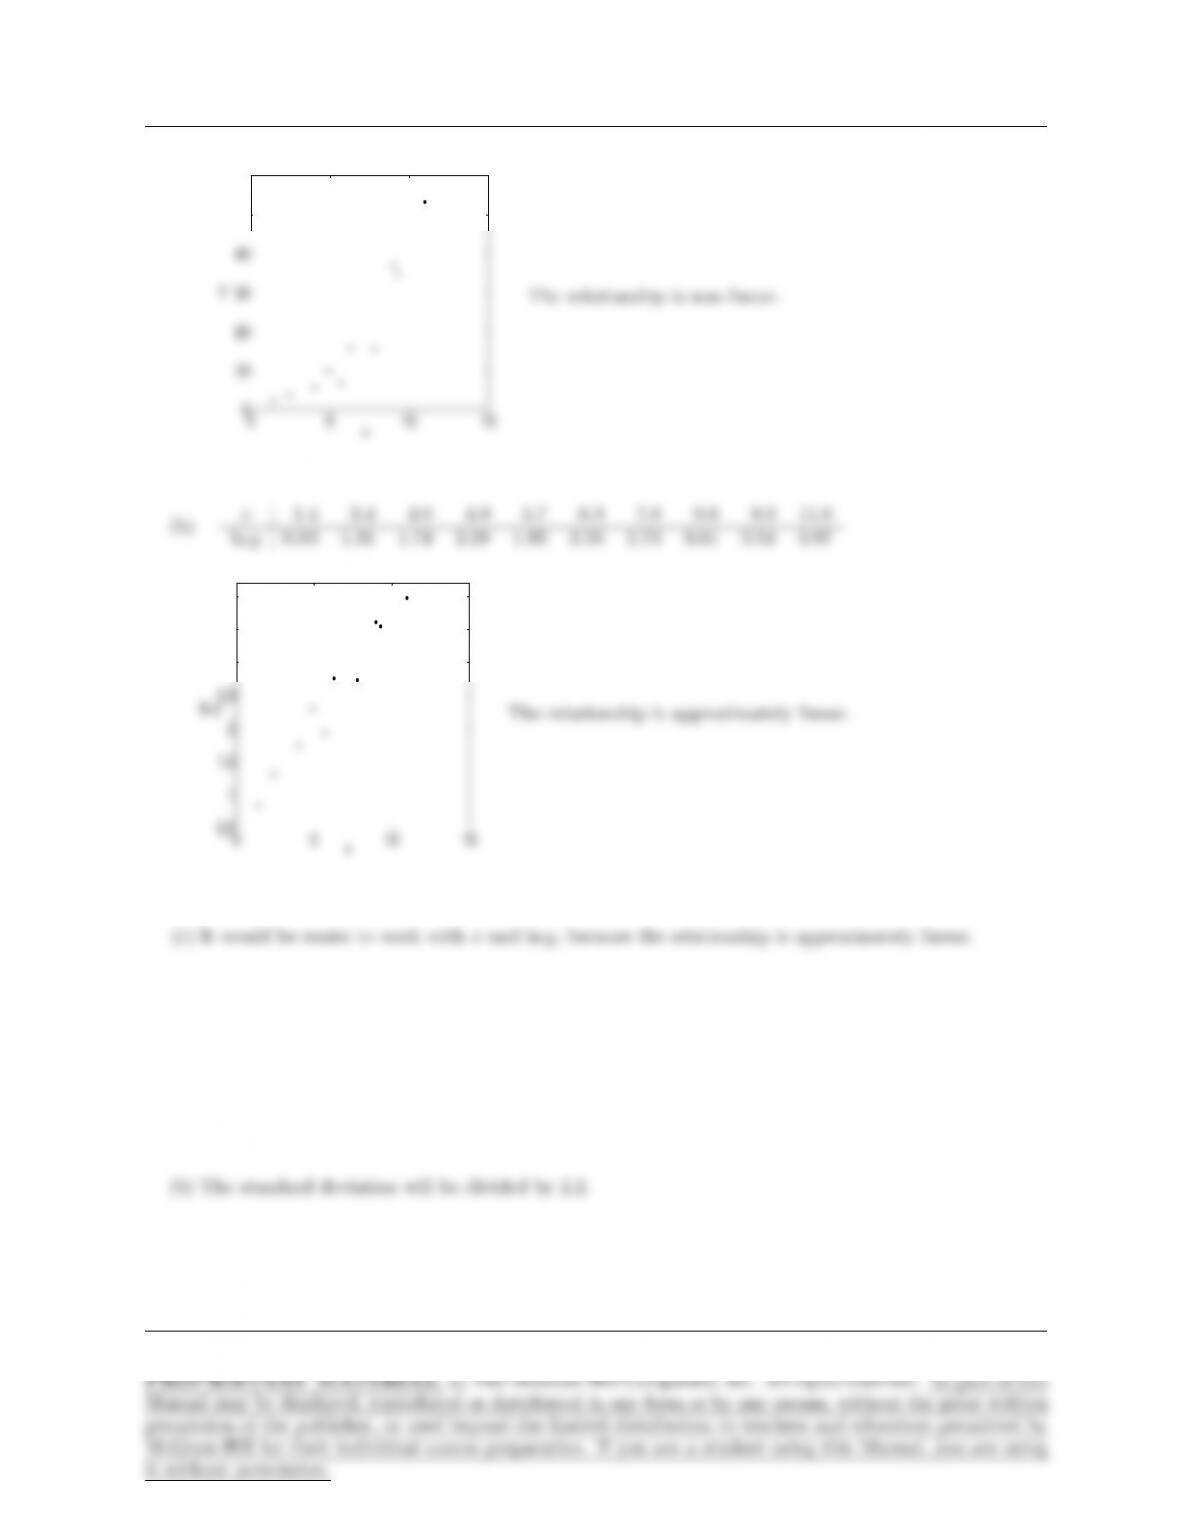
19. (a)
0 5 10 15
0
10
20
30
40
50
60
x
y
The relationship is non-linear.
(b) x1.4 2.4 4.0 4.9 5.7 6.3 7.8 9.0 9.3 11.0
ln y0.83 1.31 1.74 2.29 1.93 2.76 2.73 3.61 3.54 3.97
0 5 10 15
0.5
1
1.5
2
2.5
3
3.5
4
x
ln y
The relationship is approximately linear.
(c) It would be easier to work with xand ln y, because the relationship is approximately linear.
Supplementary Exercises for Chapter 1
1. (a) The mean will be divided by 2.2.
Page 17
18 CHAPTER 1
2. (a) The mean will increase by 50 g.
3. (a) False. The true percentage could be greater than 5%, with the observation of 4 out of 100 due to
sampling variation.
4. (a) No. This could well be sampling variation.
6. (a) The sum of the numbers decreases by 12.9−1.29 = 11.61, so the mean decreases by 11.61/15 = 0.774.
Page 18
SUPPLEMENTARY EXERCISES FOR CHAPTER 1 19
7. (a) The mean decreases by 0.774.
8. (a) The sum of the numbers 284.34, 173.01, 229.55, 312.95, 215.34, 188.72, 144.39, 172.79, 139.38, 197.81,
303.28, 256.02, 658.38, 105.14, 295.24, 170.41 is 3846.75. The mean is therefore 3846.75/16 = 240.4219.
Page 19
20 CHAPTER 1
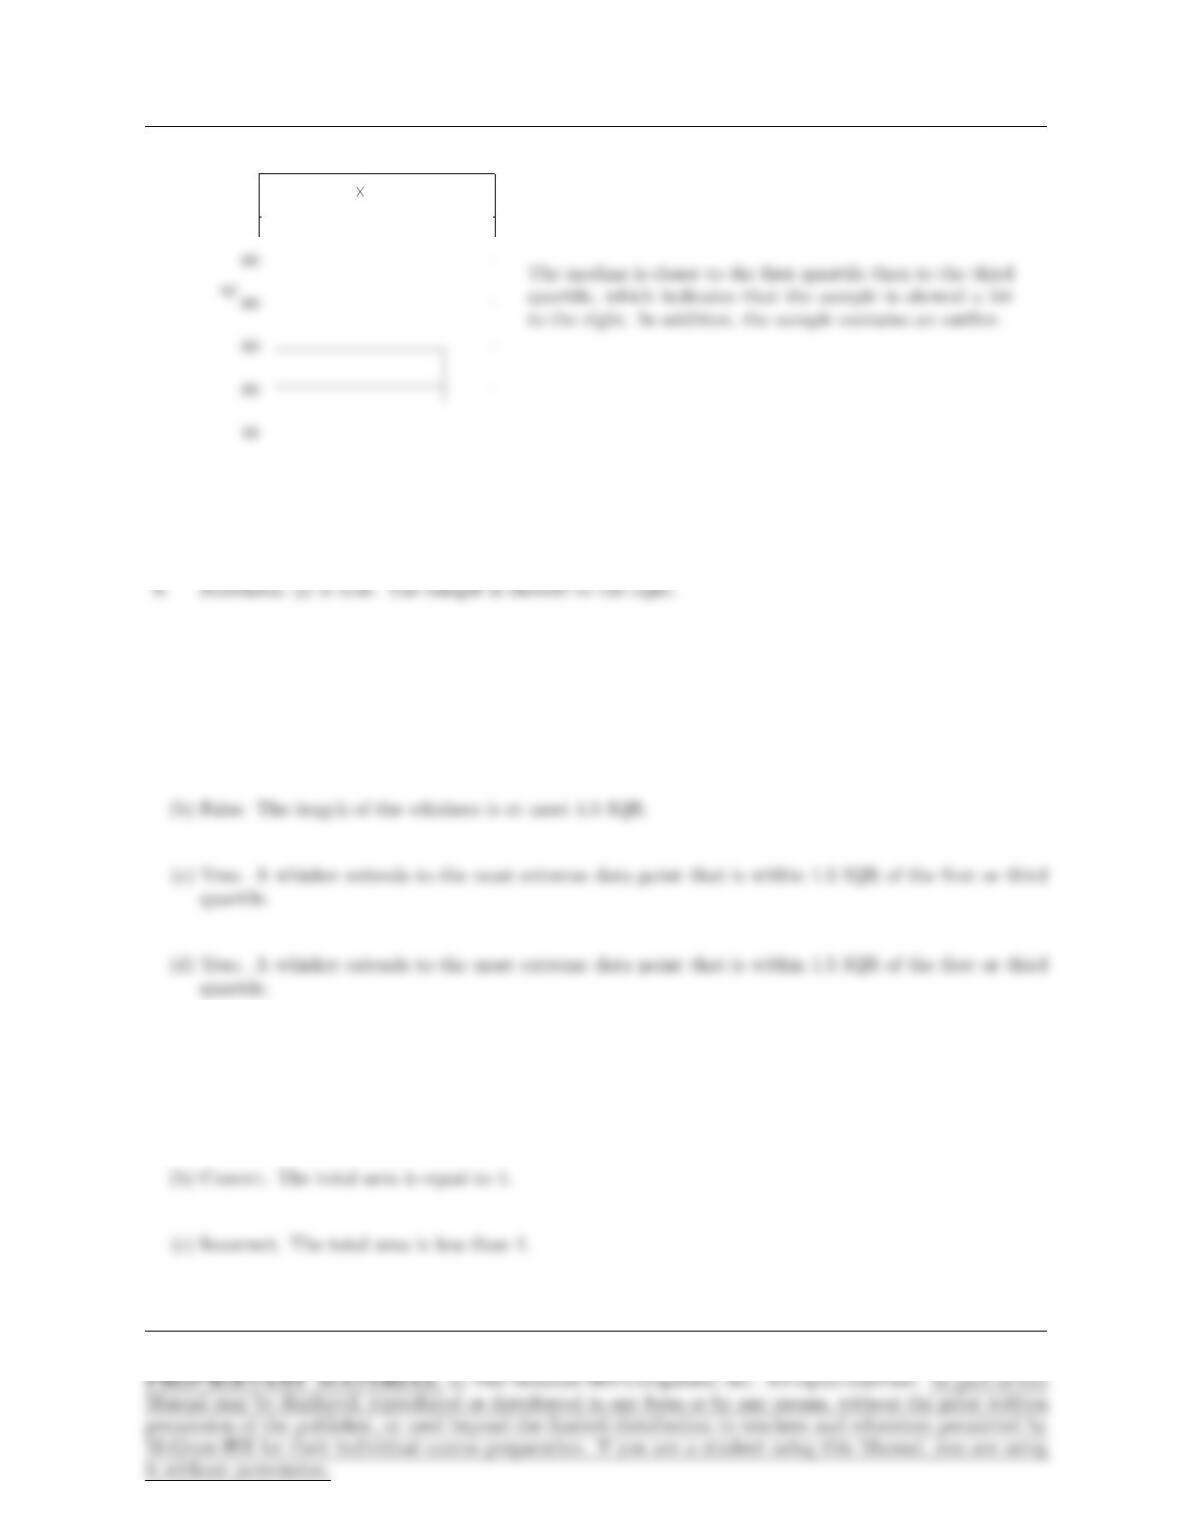
(e)
100
200
300
400
500
600
700
mg/l
The median is closer to the first quartile than to the third
quartile, which indicates that the sample is skewed a bit
to the right. In addition, the sample contains an outlier.
9. Statement (i) is true. The sample is skewed to the right.
10. (a) False. The length of the whiskers is at most 1.5 IQR.
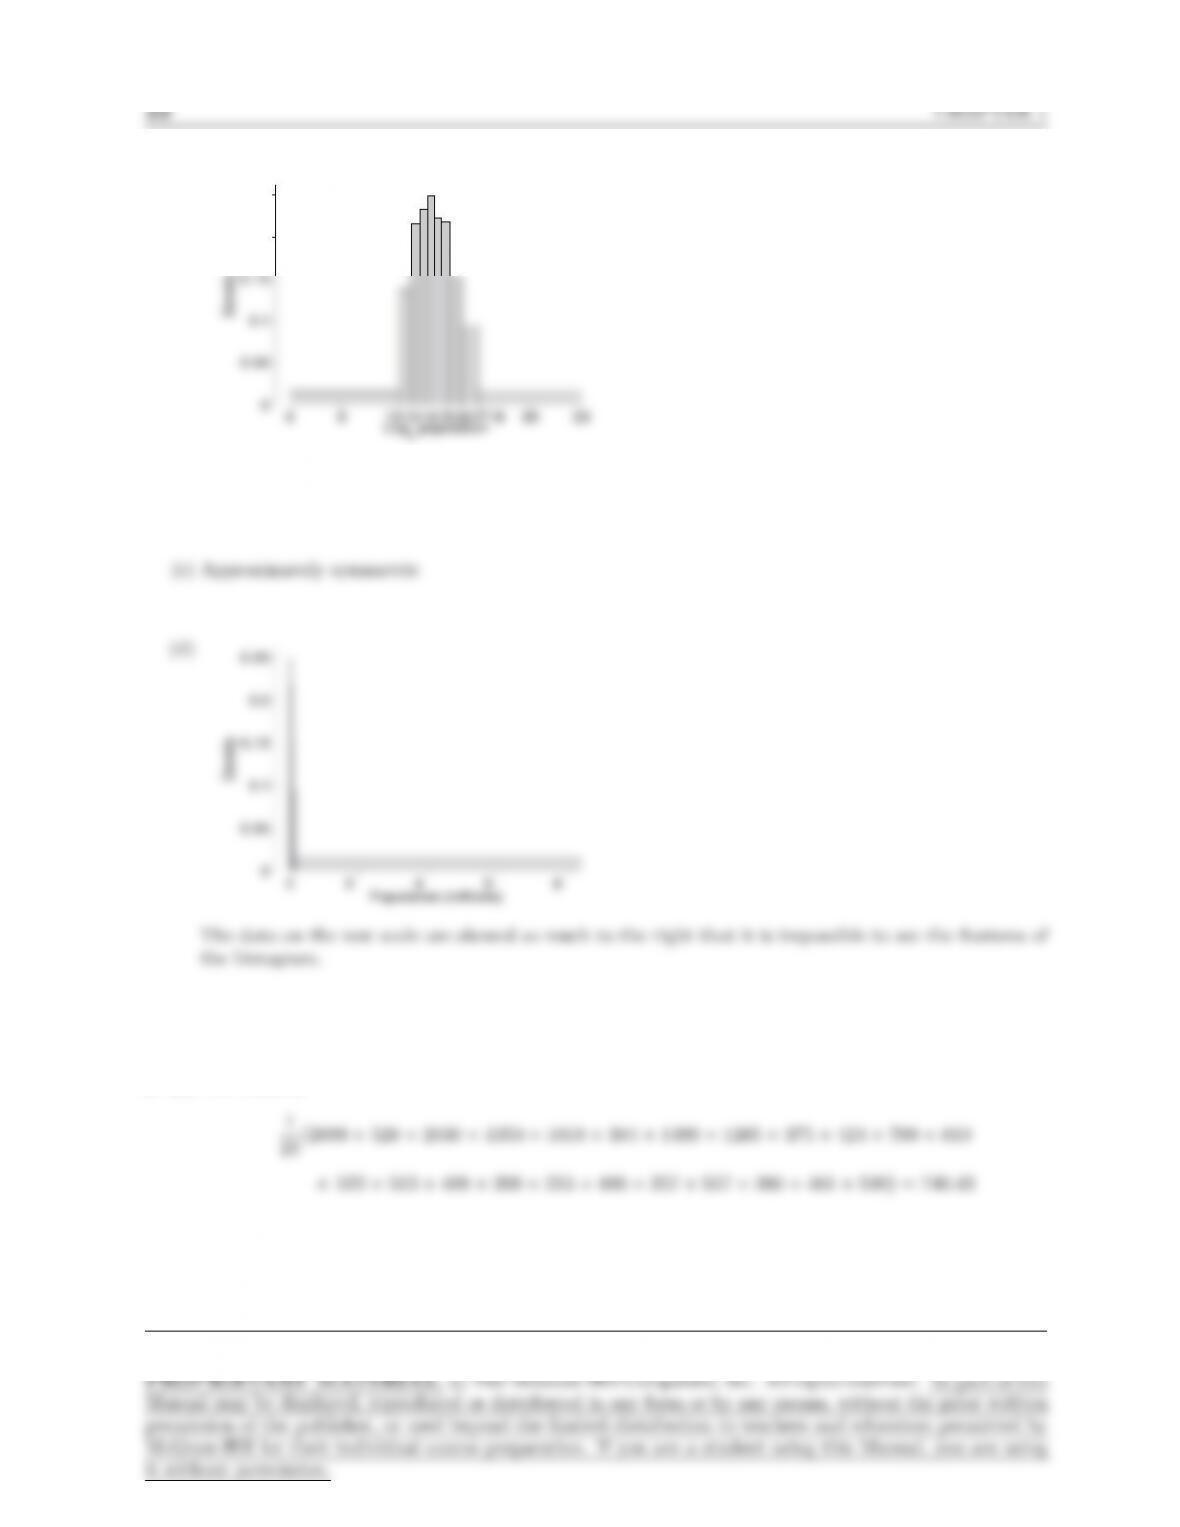
11. (a) Incorrect, the total area is greater than 1.
Page 20
SUPPLEMENTARY EXERCISES FOR CHAPTER 1 21
13. (a) Skewed to the left. The 85th percentile is much closer to the median (50th percentile) than the 15th
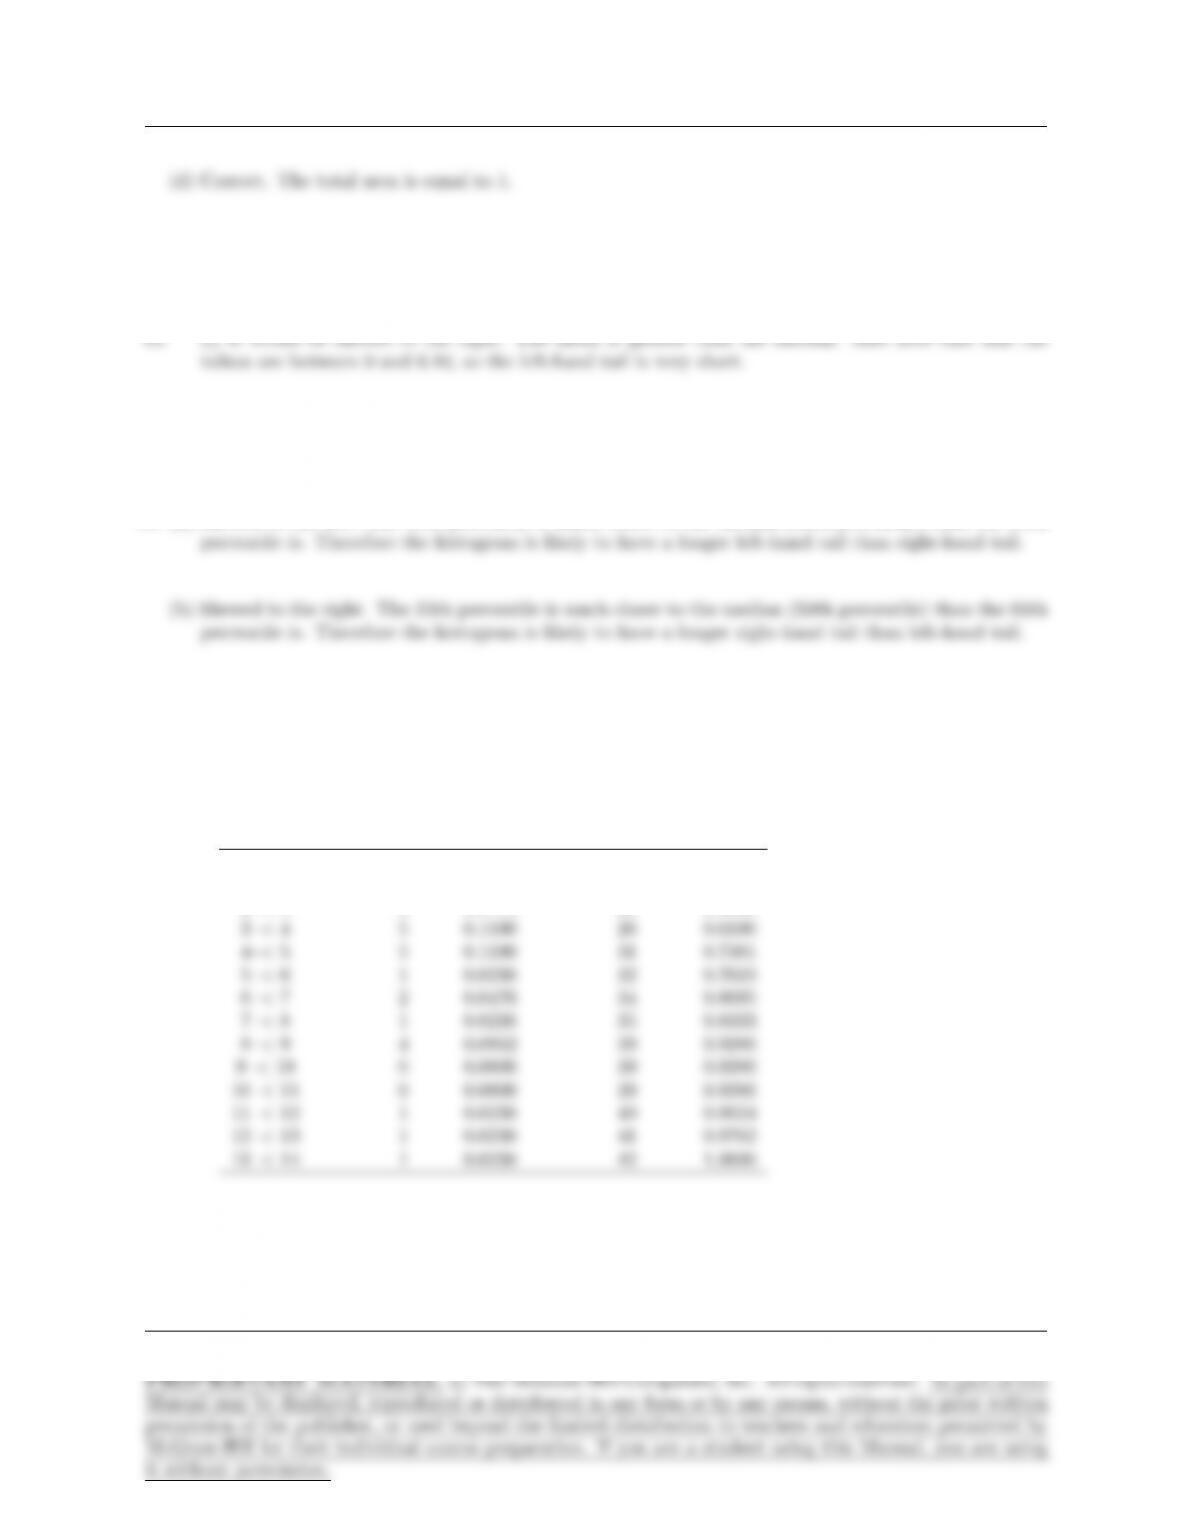
14. Cumulative
Class Relative Cumulative Relative
Interval Frequency Frequency Frequency Frequency
0–<1 12 0.2857 12 0.2857
1–<2 6 0.1429 18 0.4286
2–<3 3 0.0714 21 0.5000
Page 21
15. (a)
6 9 12131415161718 20 23
0
0.05
0.1
0.15
0.2
0.25
Density
Log2 population
(b) 0.14
16. (a) The mean is
Page 22
SUPPLEMENTARY EXERCISES FOR CHAPTER 1 23
(b) The variance is
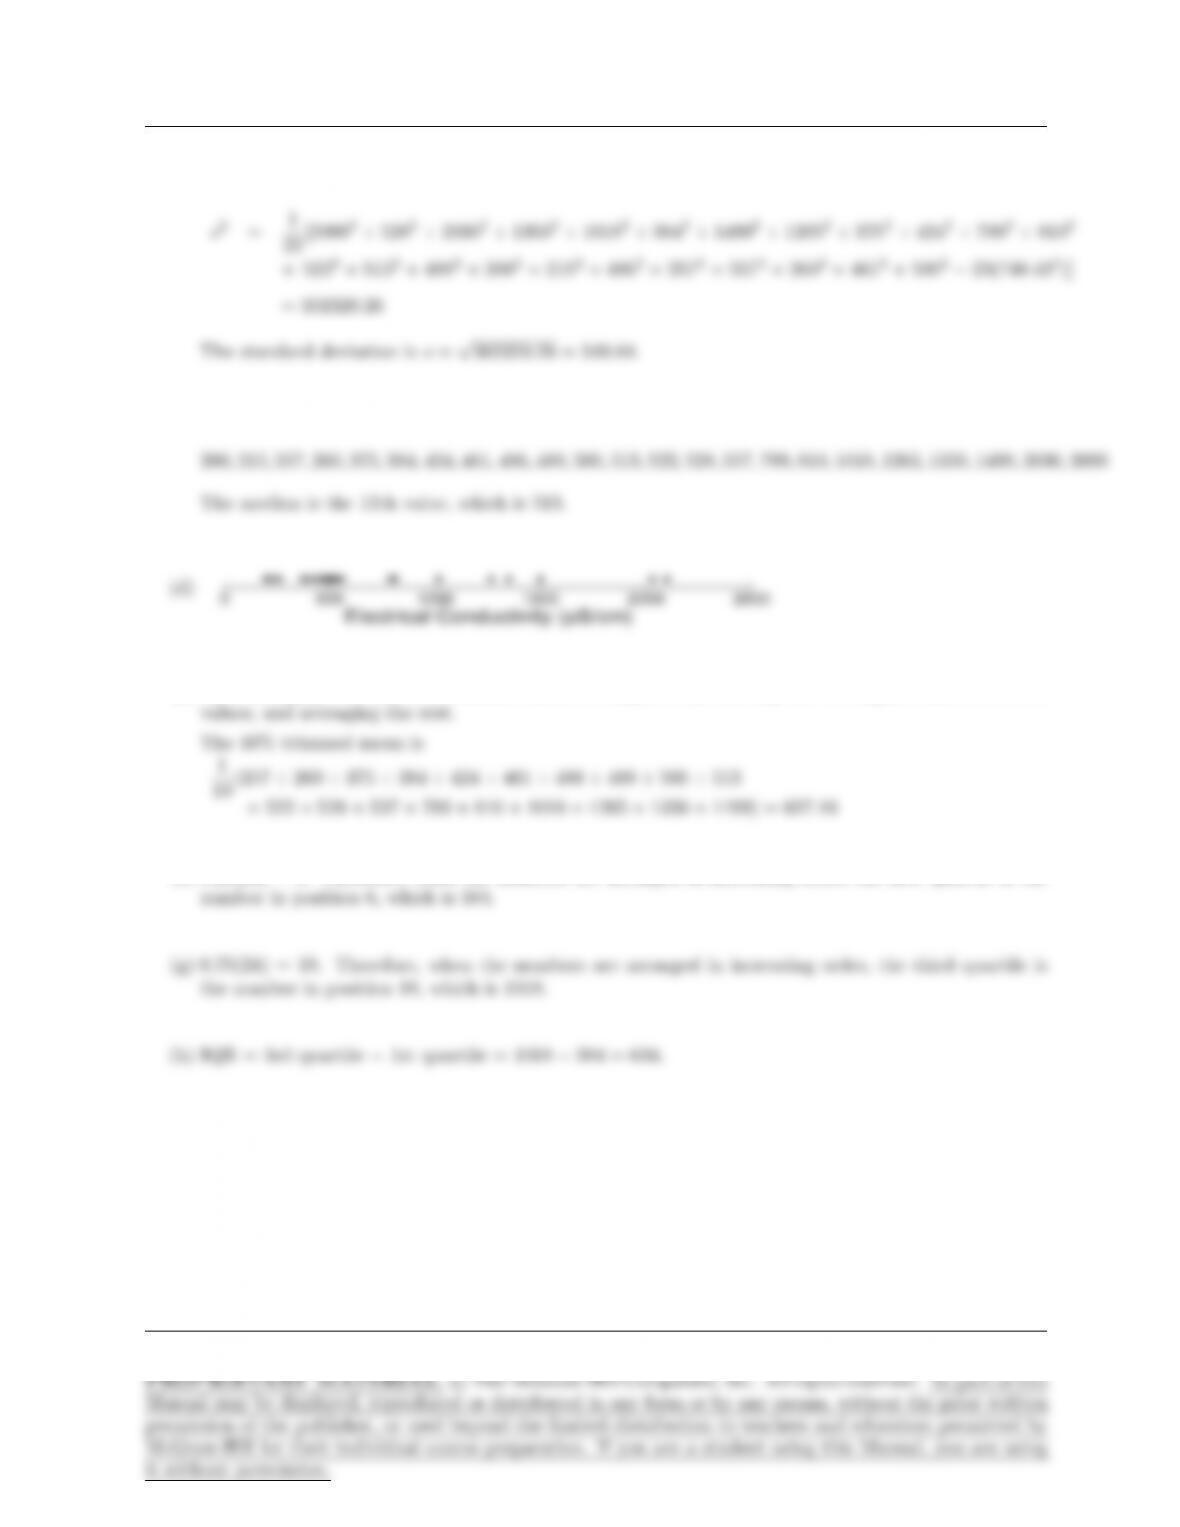
(c) The 23 values, arranged in increasing order, are:
(i)
0
500
1000
1500
2000
2500
Electrical Conductivity (µS/cm)
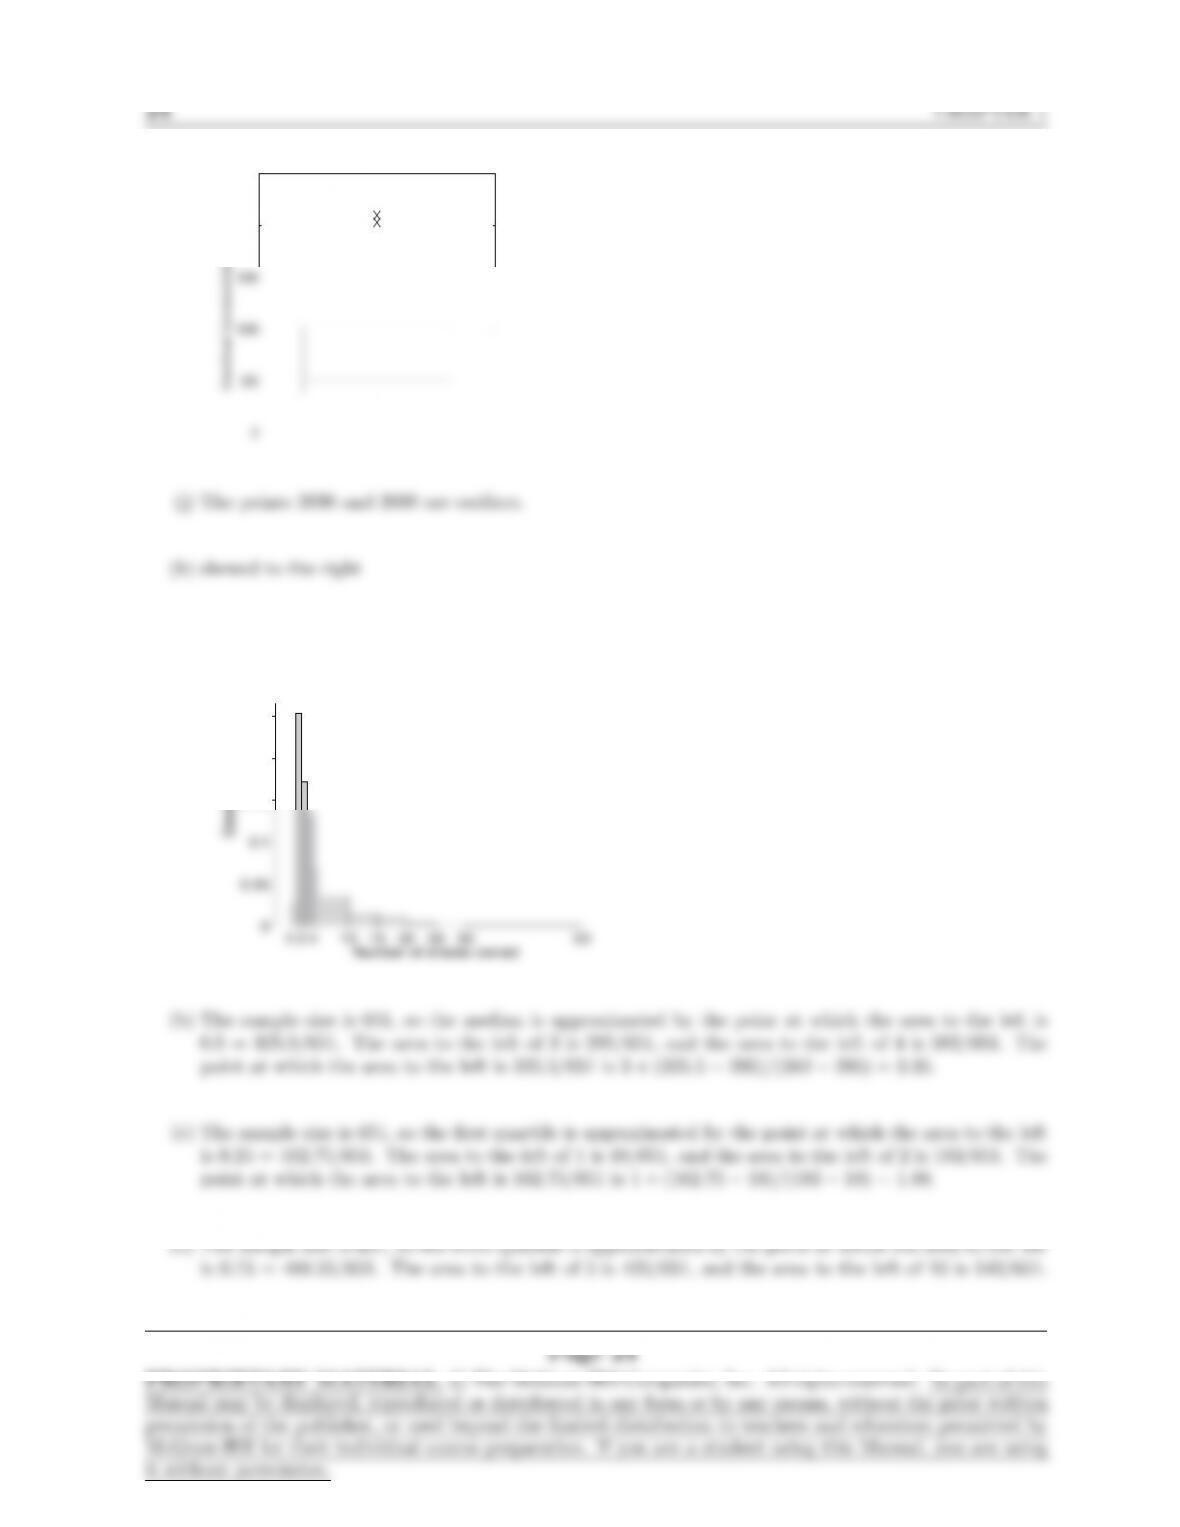
(j) The points 2030 and 2099 are outliers.
(k) skewed to the right
17. (a)
0 2 4 10 15 20 25 30 50
0
0.05
0.1
0.15
0.2
0.25
Density
Number of shares owned
(b) The sample size is 651, so the median is approximated by the point at which the area to the left is
0.5 = 325.5/651. The area to the left of 3 is 295/651, and the area to the left of 4 is 382/651. The
point at which the area to the left is 325.5/651 is 3 + (325.5−295)/(382 −295) = 3.35.
(c) The sample size is 651, so the first quartile is approximated by the point at which the area to the left
is 0.25 = 162.75/651. The area to the left of 1 is 18/651, and the area to the left of 2 is 183/651. The
point at which the area to the left is 162.75/651 is 1 + (162.75 −18)/(183 −18) = 1.88.
(d) The sample size is 651, so the third quartile is approximated by the point at which the area to the left
is 0.75 = 488.25/651. The area to the left of 5 is 425/651, and the area to the left of 10 is 542/651.
Page 24
PROPRIETARY MATERIAL. c
The McGraw-Hill Companies, Inc. All rights reserved. No part of this
SUPPLEMENTARY EXERCISES FOR CHAPTER 1 25
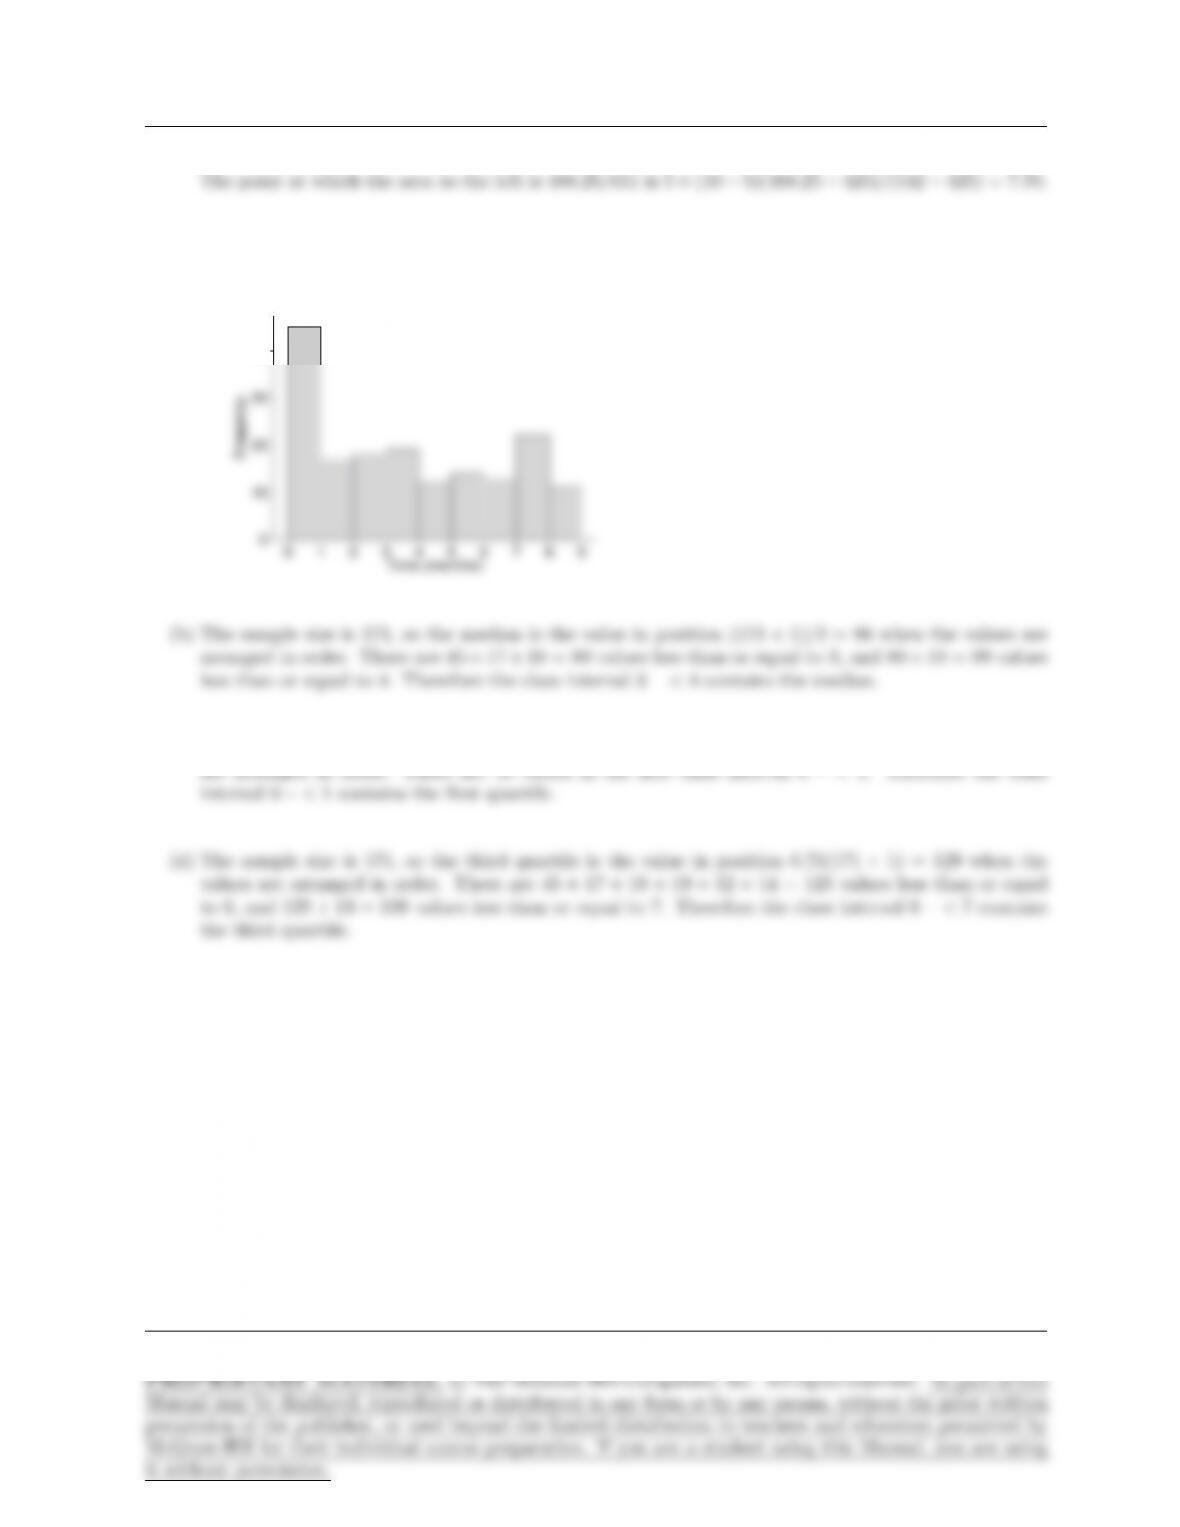
18. (a)
0 1 2 3 4 5 6 7 8 9
0
10
20
30
40
Frequency
Time (months)
(b) The sample size is 171, so the median is the value in position (171 + 1)/2 = 86 when the values are
arranged in order. There are 45 + 17 + 18 = 80 values less than or equal to 3, and 80 + 19 = 99 values
less than or equal to 4. Therefore the class interval 3 – <4 contains the median.
(c) The sample size is 171, so the first quartile is the value in position 0.25(171 + 1) = 43 when the values
Page 25
26 CHAPTER 1
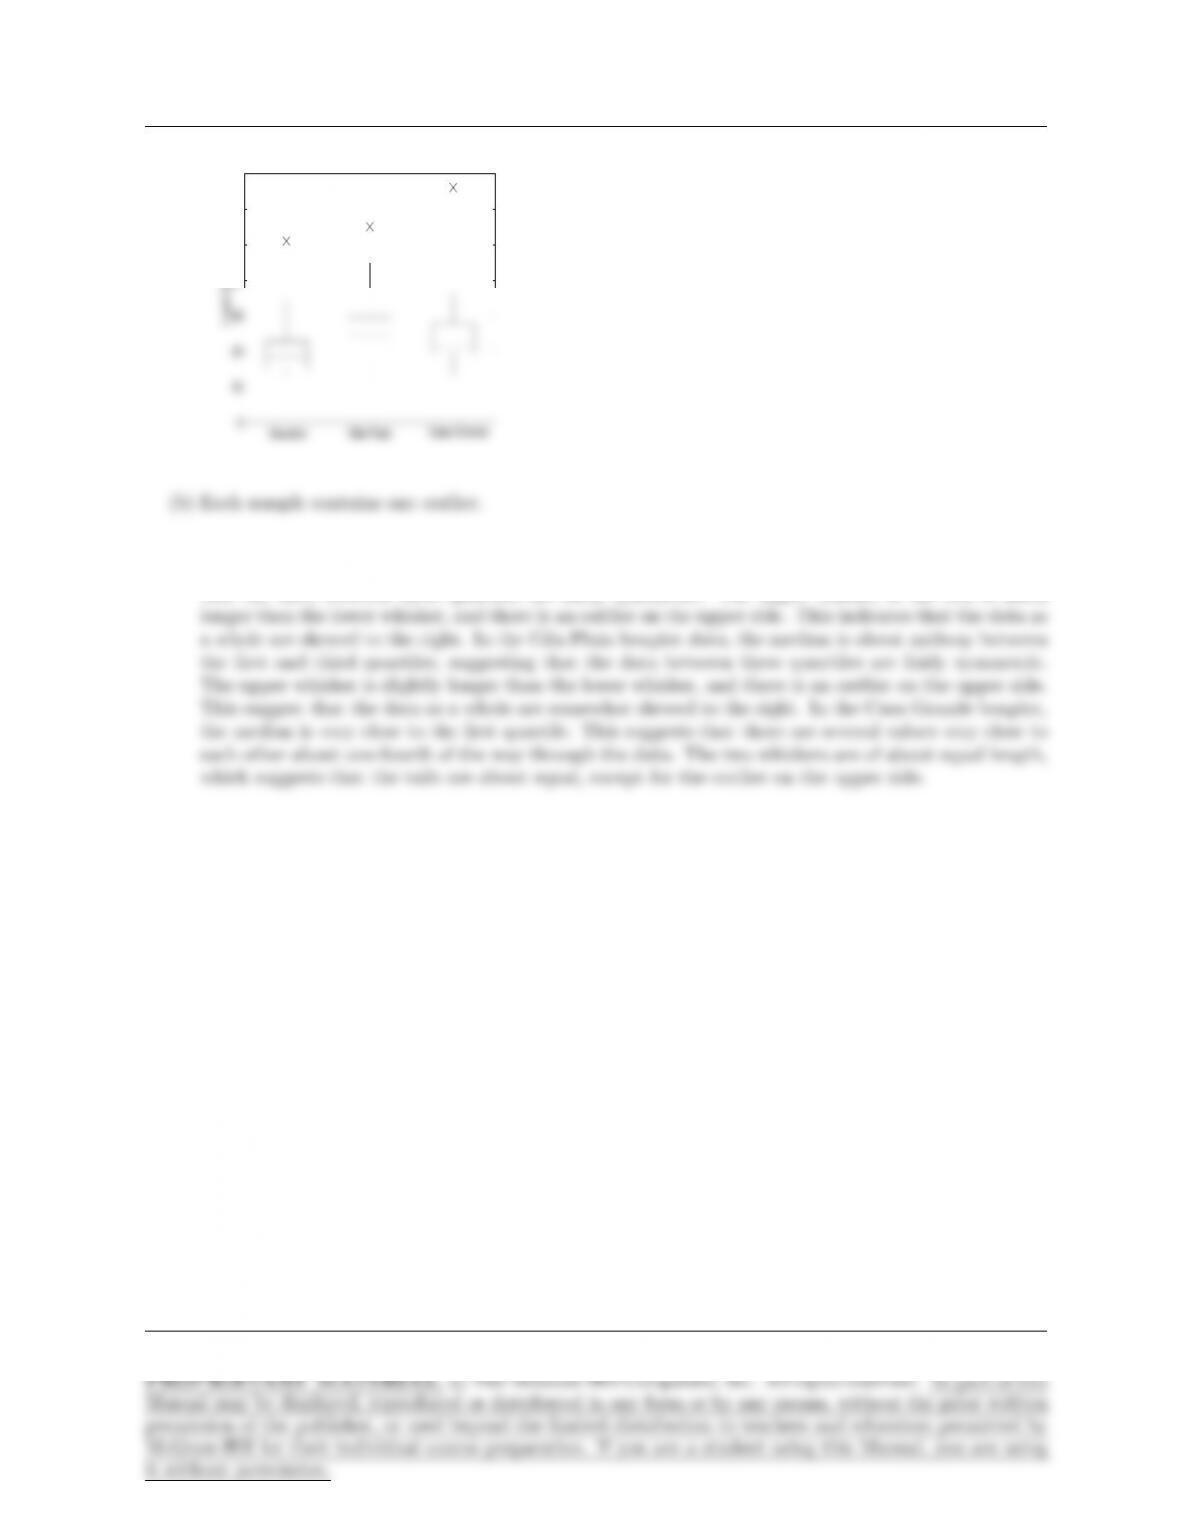
19. (a)
0
10
20
30
40
50
60
70
Load (kg)
Sacaton Gila Plain Casa Grande
(b) Each sample contains one outlier.
(c) In the Sacaton boxplot, the median is about midway between the first and third quartiles, suggesting
that the data between these quartiles are fairly symmetric. The upper whisker of the box is much
Page 26
SECTION 2.1 27
Chapter 2
Section 2.1
2. (a) {1, 2, 3}
3. (a) The outcomes are the 16 different strings of 4 true-false answers. These are {TTTT, TTTF, TTFT,
TTFF, TFTT, TFTF, TFFT, TFFF, FTTT, FTTF, FTFT, FTFF, FFTT, FFTF, FFFT, FFFF}.
4. (a) The outcomes are the 27 different strings of 3 chosen from conforming (C), downgraded (D), and
Page 27