
Solutions Manual
to accompany
STATISTICS FOR ENGINEERS
AND SCIENTISTS, 4th ed.
Prepared by
William Navidi
PROPRIETARY AND CONFIDENTIAL
This Manual is the proprietary property of The McGraw-Hill Companies, Inc.
(“McGraw-Hill”) and protected by copyright and other state and federal laws.
By opening and using this Manual the user agrees to the following restrictions,
and if the recipient does not agree to these restrictions, the Manual should
be promptly returned unopened to McGraw-Hill: This Manual is being
provided only to authorized professors and instructors for use in
preparing for the classes using the affiliated textbook. No other
use or distribution of this Manual is permitted. This Manual may
not be sold and may not be distributed to or used by any student
or other third party. No part of this Manual may be reproduced,
displayed or distributed in any form or by any means, electronic or
otherwise, without the prior written permission of McGraw-Hill.

Table of Contents
Chapter 1 . . . . . . . . . . . . . . . . . . . . . . . . . . . . . . . . . . . . . . . . . . . . . . . . . . . . . . . . . . . . . . . 1
Chapter 3 . . . . . . . . . . . . . . . . . . . . . . . . . . . . . . . . . . . . . . . . . . . . . . . . . . . . . . . . . . . . . 109
Chapter 4 . . . . . . . . . . . . . . . . . . . . . . . . . . . . . . . . . . . . . . . . . . . . . . . . . . . . . . . . . . . . . 147
Chapter 5 . . . . . . . . . . . . . . . . . . . . . . . . . . . . . . . . . . . . . . . . . . . . . . . . . . . . . . . . . . . . . 235
Chapter 6 . . . . . . . . . . . . . . . . . . . . . . . . . . . . . . . . . . . . . . . . . . . . . . . . . . . . . . . . . . . . . 273
Chapter 7 . . . . . . . . . . . . . . . . . . . . . . . . . . . . . . . . . . . . . . . . . . . . . . . . . . . . . . . . . . . . . 347
Chapter 8 . . . . . . . . . . . . . . . . . . . . . . . . . . . . . . . . . . . . . . . . . . . . . . . . . . . . . . . . . . . . . 393
Chapter 9 . . . . . . . . . . . . . . . . . . . . . . . . . . . . . . . . . . . . . . . . . . . . . . . . . . . . . . . . . . . . . 429
Chapter 10 . . . . . . . . . . . . . . . . . . . . . . . . . . . . . . . . . . . . . . . . . . . . . . . . . . . . . . . . . . . . 472
SECTION 1.1 1
Chapter 1
Section 1.1
1. (a) The population consists of all the times the process could be run. It is conceptual.
2. (iii). It is very unlikely that students whose names happen to fall at the top of a page in the phone
3. (a) False
Page 1
2CHAPTER 1
6. (a) False
8. (a) An observational study
9. (a) A controlled experiment
Section 1.2
1. False
Page 2
SECTION 1.2 3
6. Yes. For example, the list 1, 2, 12 has an average of 5 and a standard deviation of 6.08.
10. (a) Let X1, …, X100 denote the 100 numbers of children.
(b) The sample variance is
X
Alternatively, the sample variance can be computed as
100
X
= 1.7034
Page 3
11. The total height of the 20 men is 20×178 = 3560. The total height of the 30 women is 30×164 = 4920.
12. (a) The mean for A is
(18.0+18.0+18.0+20.0+22.0+22.0+22.5+23.0+24.0+24.0+25.0+25.0+25.0+25.0+26.0+26.4)/16 = 22.744
Page 4
SECTION 1.2 5
(c) 0.20(16) = 3.2≈3. Trim the 3 highest and 3 lowest observations.
The 20% trimmed mean for A is
(d) 0.25(17) = 4.25. Therefore the first quartile is the average of the numbers in positions 4 and 5.
(e) The variance for A is
s2=1
15[18.02+ 18.02+ 18.02+ 20.02+ 22.02+ 22.02+ 22.52+ 23.02+ 24.02
+ 24.02+ 25.02+ 25.02+ 25.02+ 25.02+ 26.02+ 26.42−16(22.7442)] = 8.2506
The standard deviation for C is s=√0.17583 = 0.4193.
Page 5
6CHAPTER 1
(f) Method A has the largest standard deviation. This could be expected, because of the four methods,
14. (a) We will work in units of $1000. Let S0be the sum of the original 10 numbers and let S1be the sum
after the change. Then S0/10 = 70, so S0= 700. Now S1=S0−100 + 1000 = 1600, so the new mean
15. (a) The sample size is n= 16. The tertiles have cutpoints (1/3)(17) = 5.67 and (2/3)(17) = 11.33. The
first tertile is therefore the average of the sample values in positions 5 and 6, which is (44+46)/2 = 45.
Page 6
16. (a) Seems certain to be an error.
Section 1.3
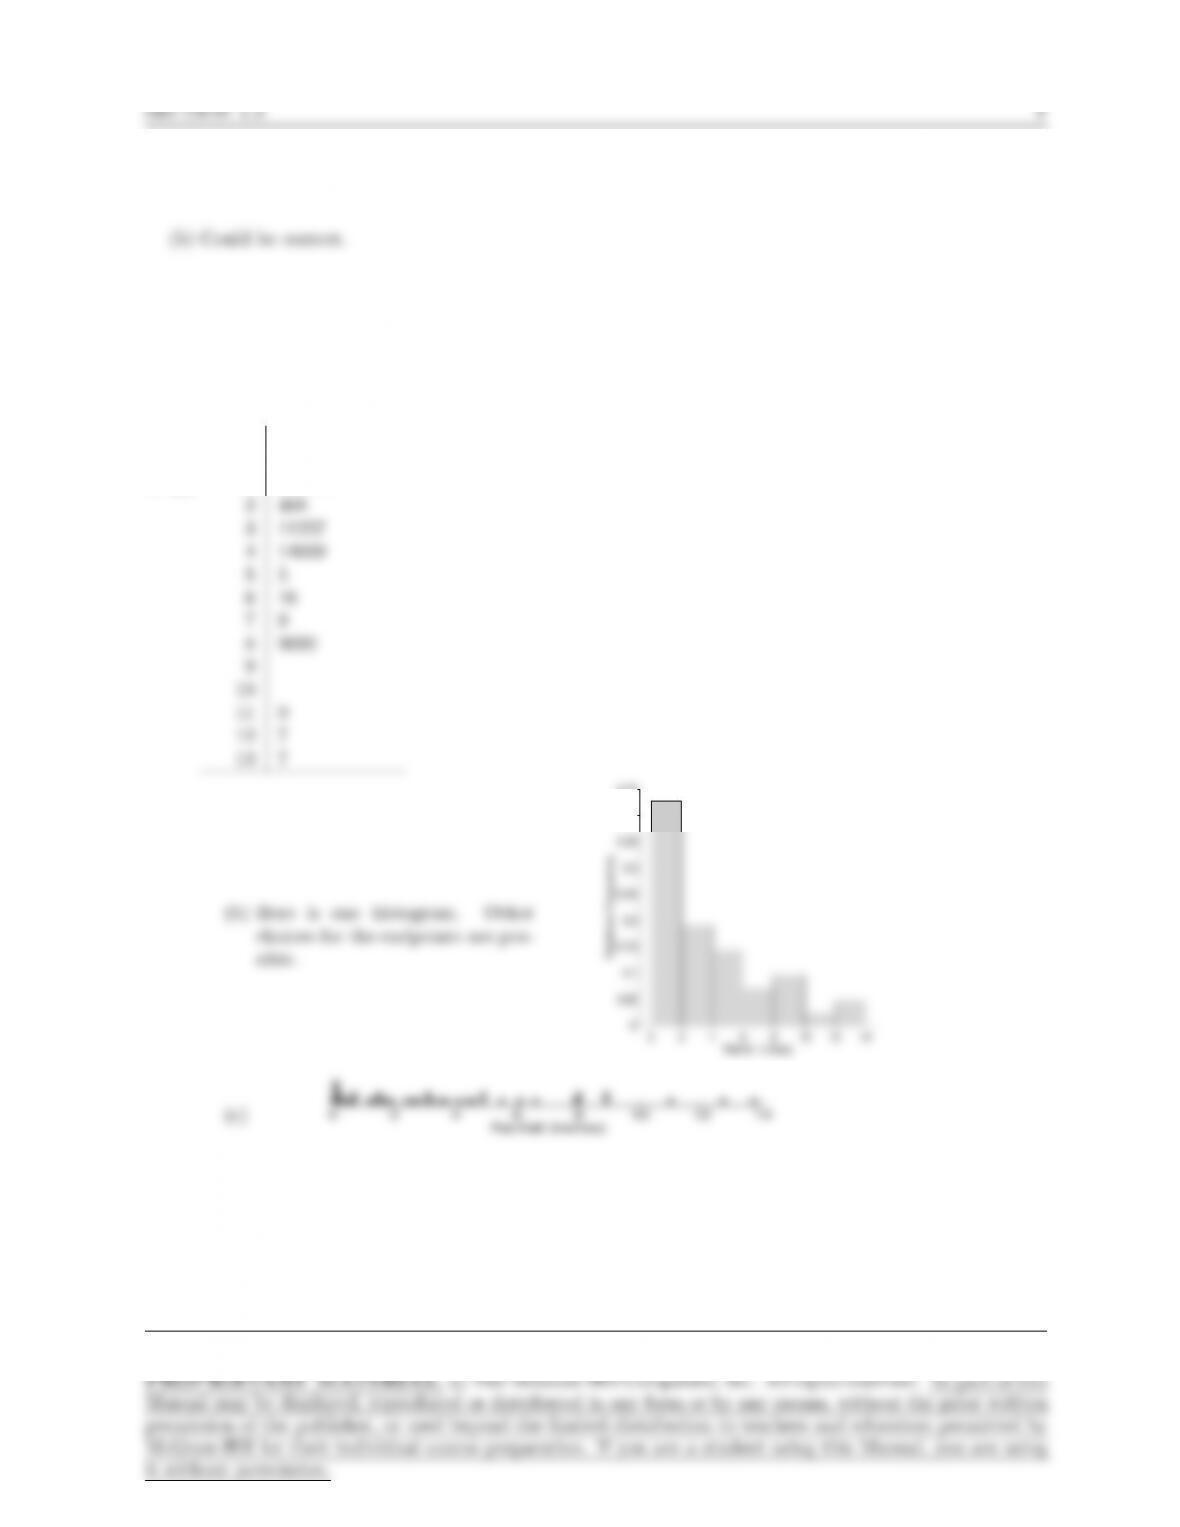
1. (a)
Stem Leaf
0011112235677
1 235579
Page 7
8CHAPTER 1
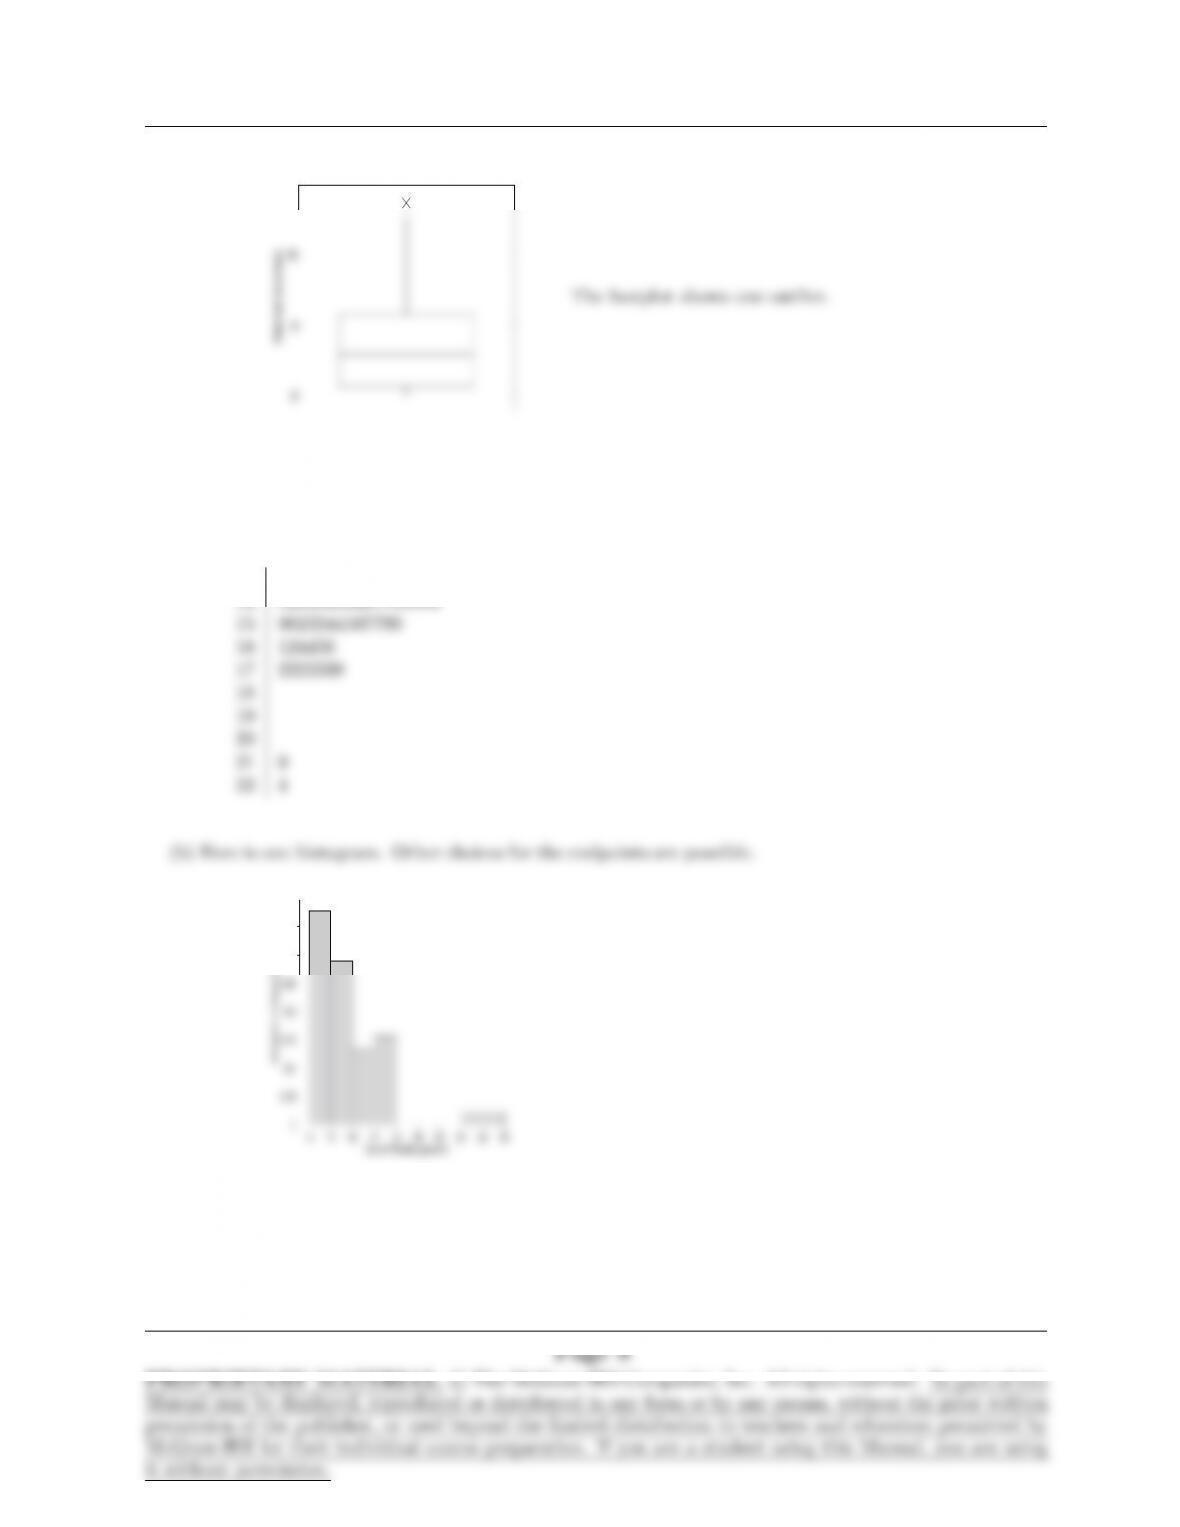
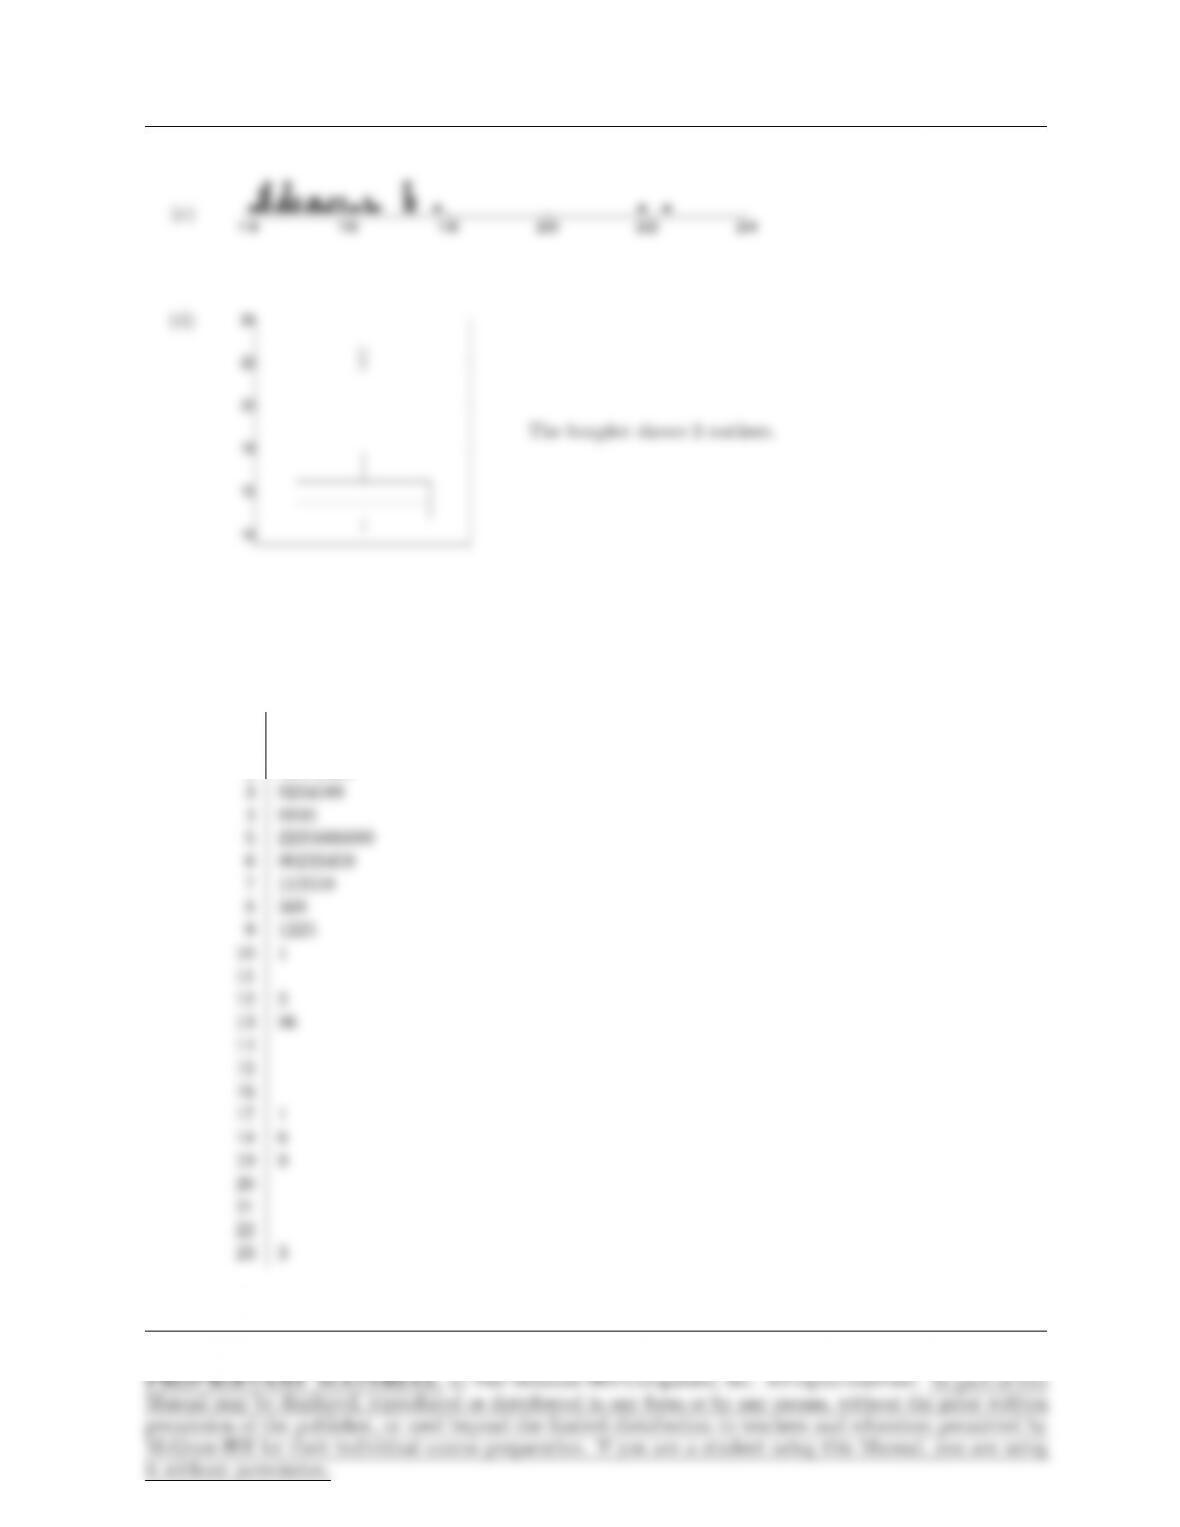
(d)
0
5
10
15
Rainfall (inches)
The boxplot shows one outlier.
2. (a)
Stem Leaf
PROPRIETARY MATERIAL. c
The McGraw-Hill Companies, Inc. All rights reserved. No part of this
Manual may be displayed, reproduced or distributed in any form or by any means, without the prior written
SECTION 1.3 9
14
16
18
3. Stem Leaf
1 1588
2 00003468
Page 9
10 CHAPTER 1
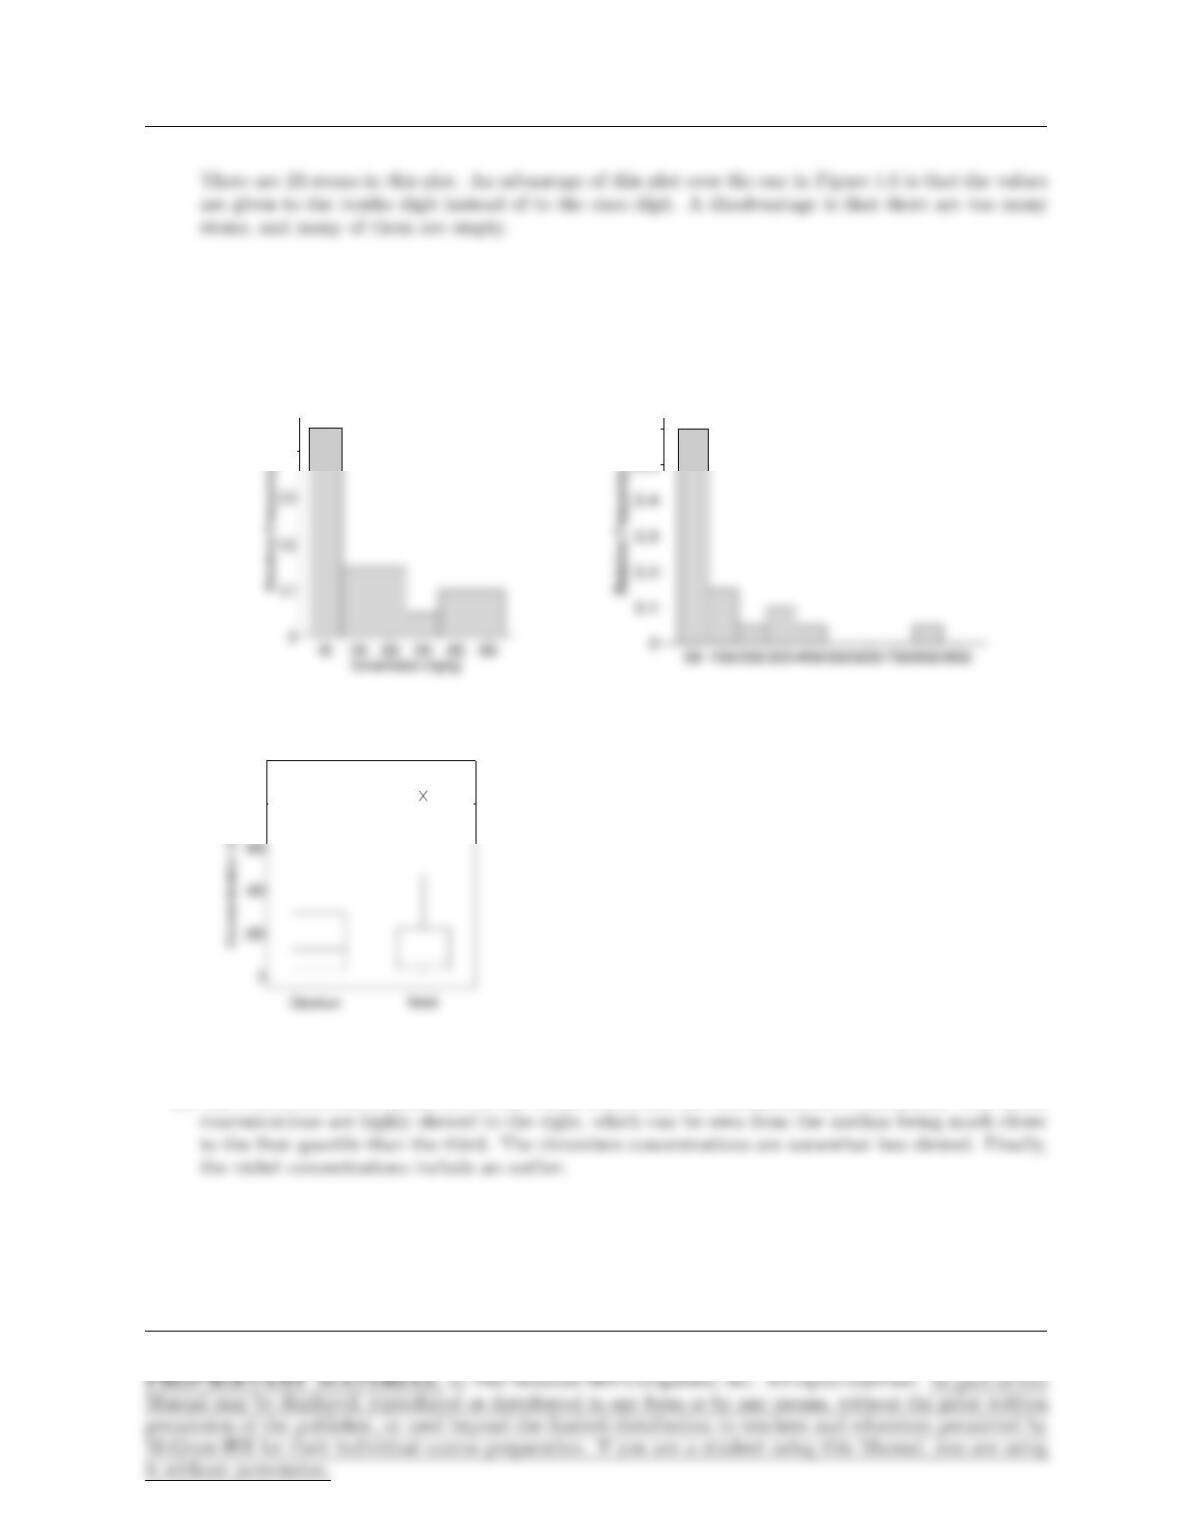
4. (a) Here are histograms for each group. Other choices for the endpoints are possible.
50 150 250 350 450 550
0
0.1
0.2
0.3
0.4
Relative Frequency
Concentration (mg/kg)
50 150250350450550650750850950
0
0.1
0.2
0.3
0.4
0.5
0.6
Relative Frequency
(b)
0
200
400
600
800
1000
Concentration (mg/kg)
Chromium Nickel
(c) The concentrations of nickel are on the whole lower than the concentrations of chromium. The nickel
Page 10
SECTION 1.3 11
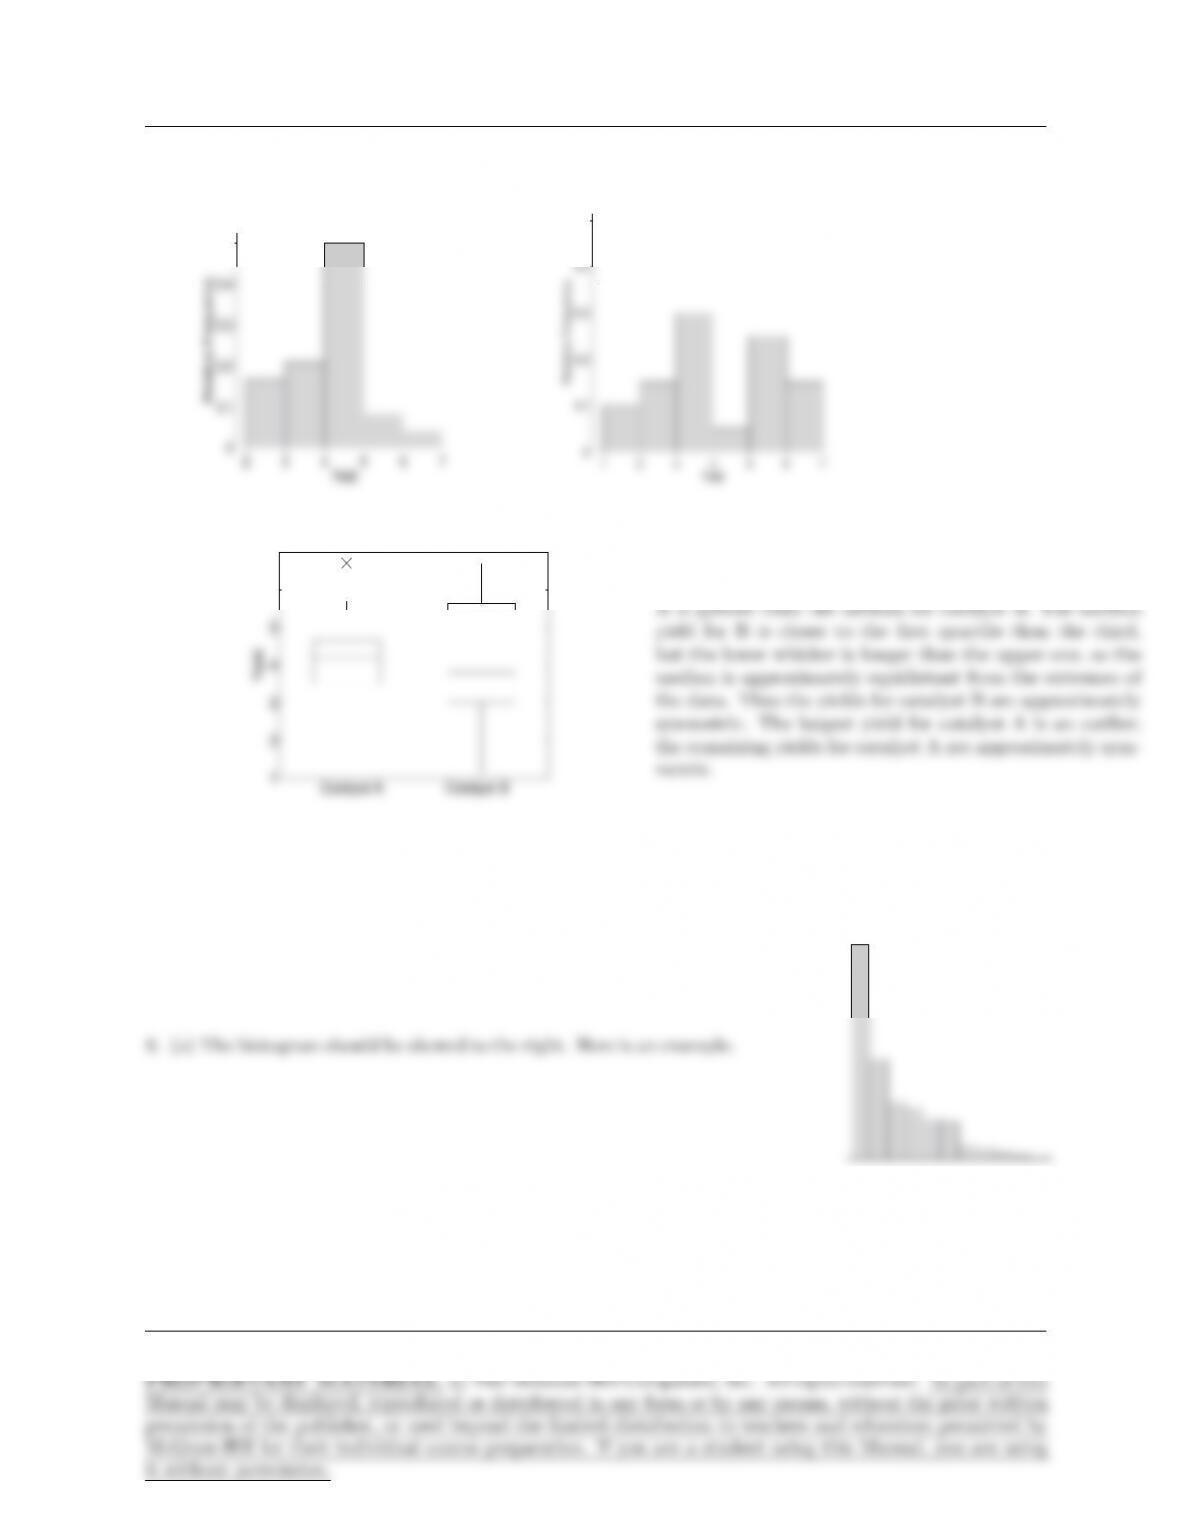
5. (a) Here are histograms for each group. Other choices for the endpoints are possible.
234567
0
0.1
0.2
0.3
0.4
0.5
Relative Frequency
Yield
Catalyst A
1 2 3 4 5 6 7
0
0.1
0.2
0.3
0.4
0.5
Relative Frequency
Yield
(b)
6
7
(c) The yields for catalyst B are considerably more spread out
than those for catalyst A.The median yield for catalyst
Page 11
12 CHAPTER 1
(b) The histogram should be skewed to the left. Here is an example.
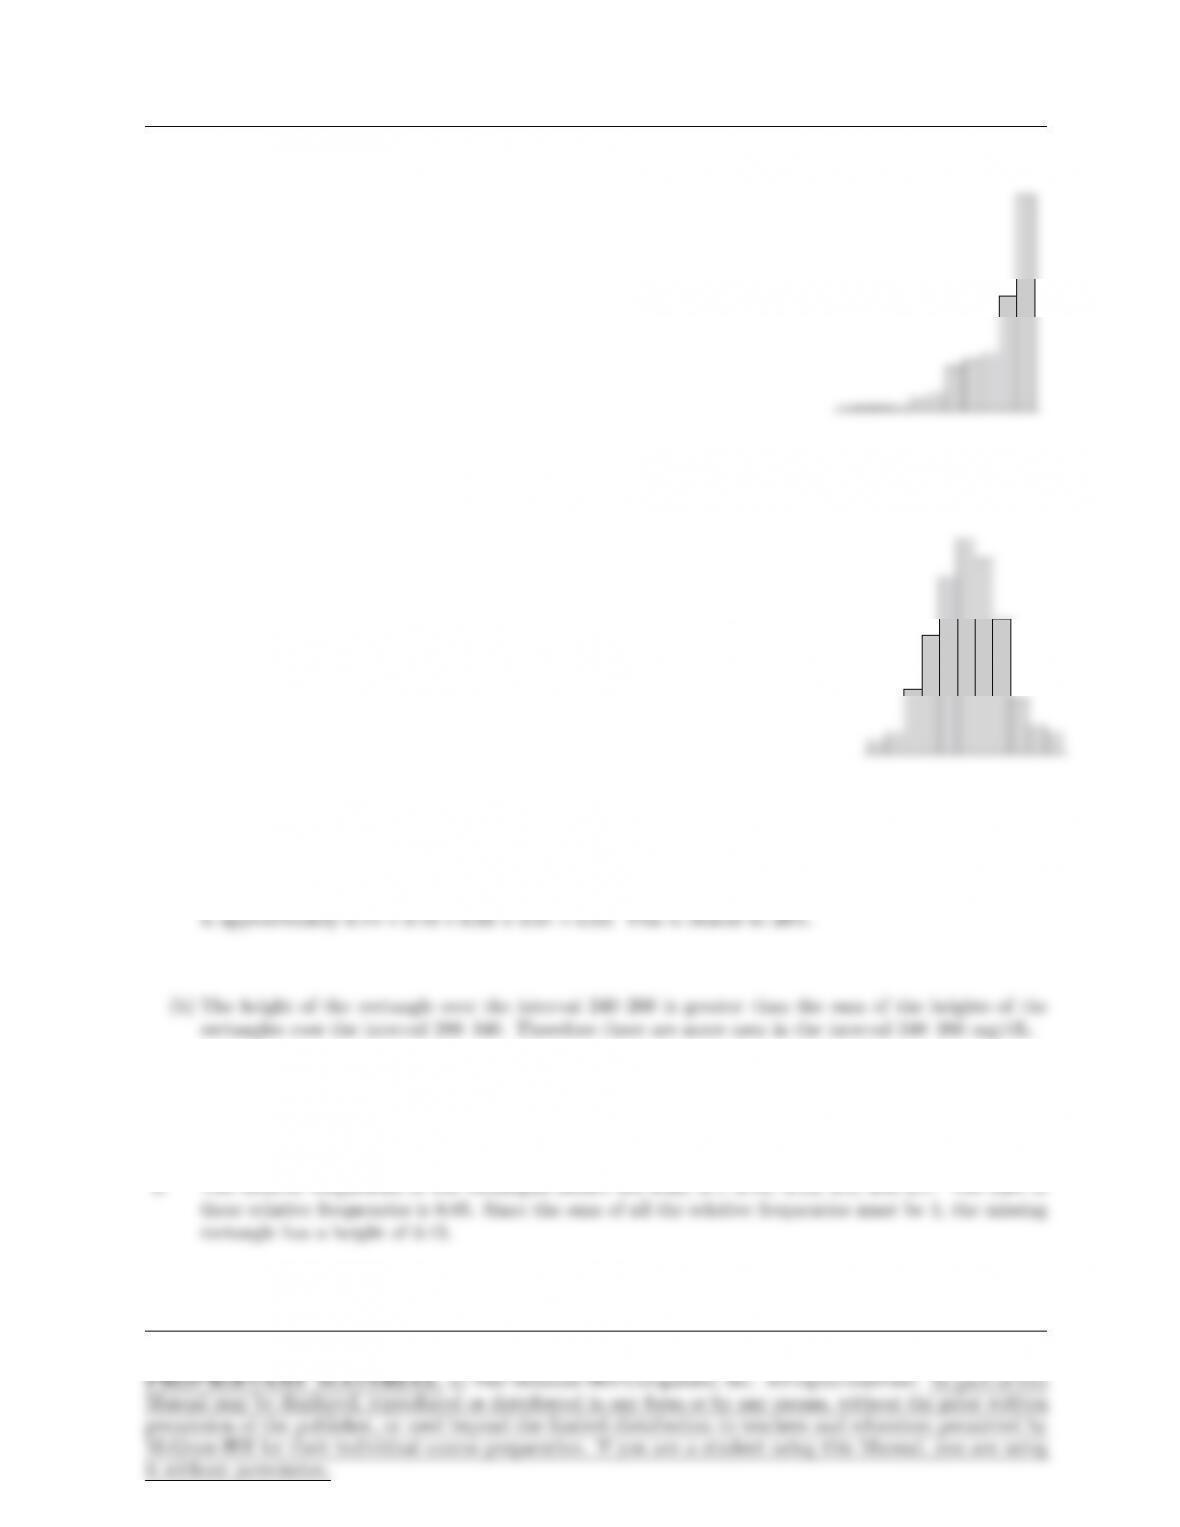
(c) The histogram should be approximately symmetric. Here is an
example.
7. (a) The proportion is the sum of the relative frequencies (heights) of the rectangles above 240. This sum
Page 12
9. (a)
1 3 5 7 9 11 13 15 17 19 21 23 25
0
3
6
9
12
15
18
Frequency
Emissions (g/gal)
(b)
1 3 5 7 9 11 13 15 17 19 21 23 25
0
0.05
0.1
0.15
Density
Emissions (g/gal)
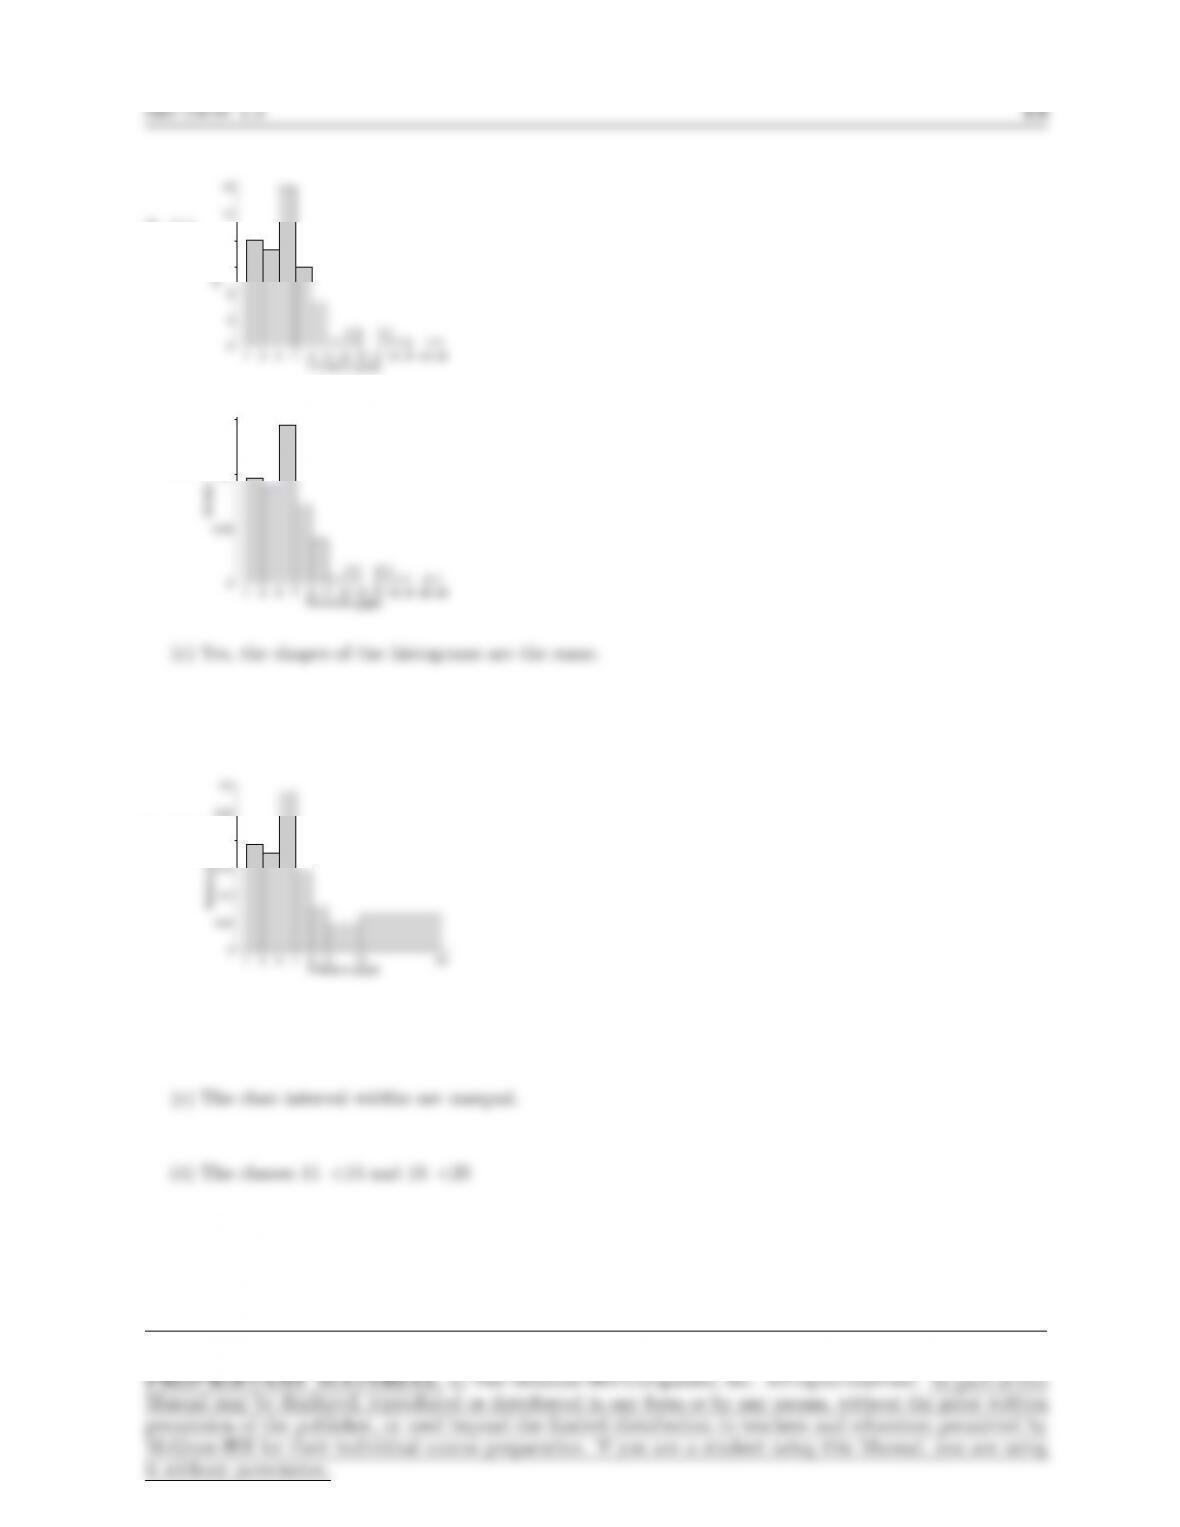
(c) Yes, the shapes of the histograms are the same.
10. (a)
1 3 5 7 9 11 15 25
0
0.05
0.1
0.15
0.2
0.25
0.3
Relative Frequency
Emissions (g/gal)
(b) No
Page 13