-160
-120
-80
-40
0
40
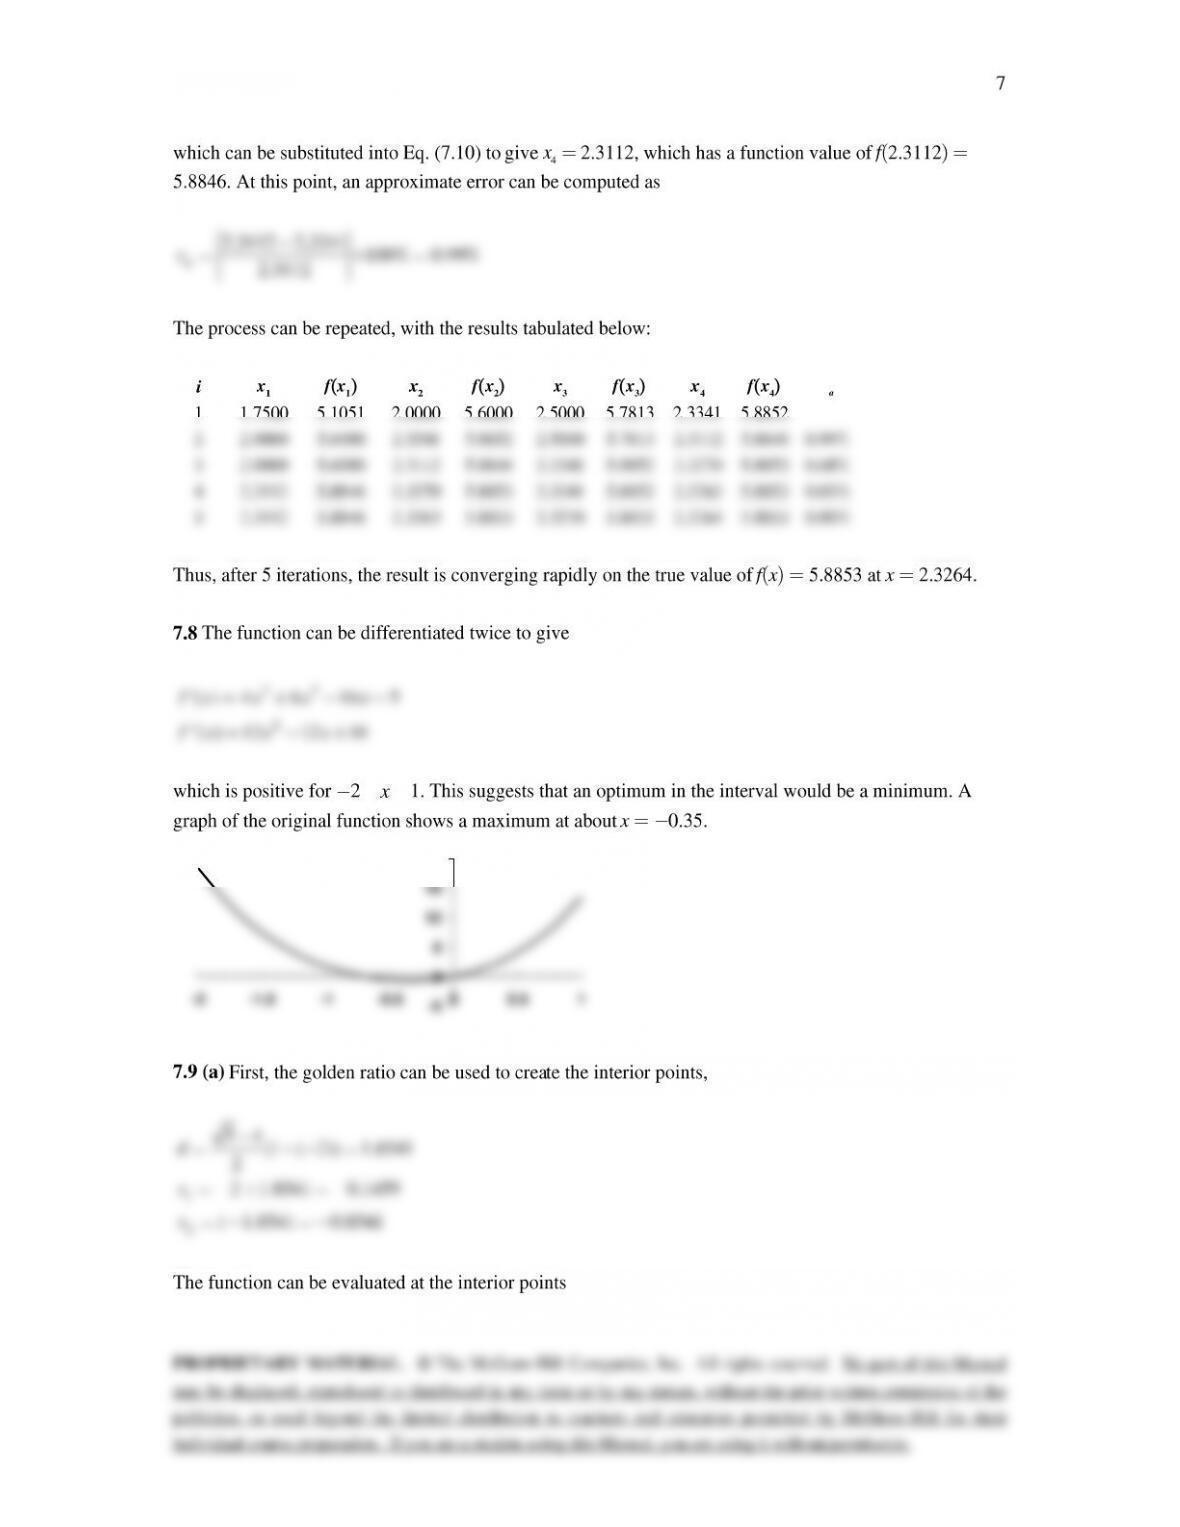
-2 -1 0 1 2
-400
-200
0
200
400
-2 -1 012
-6
0
6
12
18
24
-2 -1.5 -1 -0.5 0 0.5 1
2 4 6 8 10 12 14 16 18 20
-2
-1.5
-1
-0.5
0
0.5
1
1.5
2
©
1.21598 5.3623
0
20
20
40
40
60
60
80
80
100
100
120
140
x1
x2
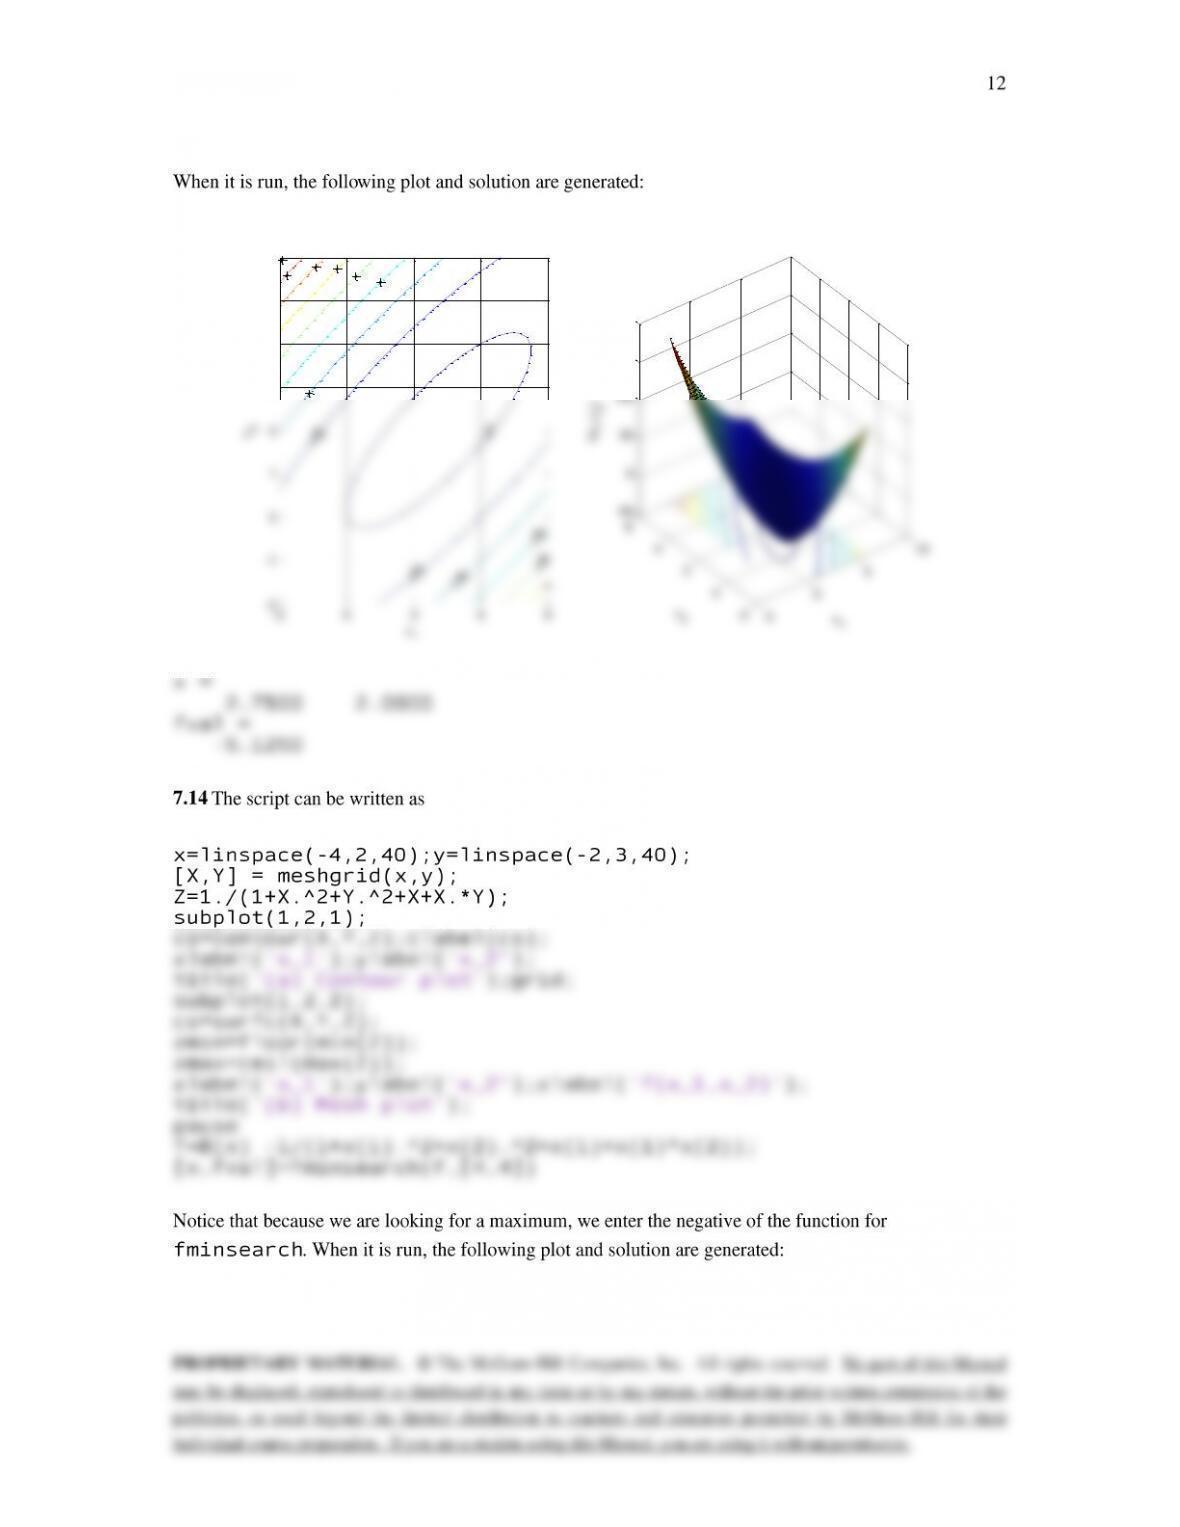
(a) Contour plot
-2 0 2 4 6
-2
-1
0
1
2
3
4
5
6
-5
0
5
10
-2
0
2
4
6
-50
0
50
100
150
200
x1
(b) Mesh plot
x2
f(x1,x2)
©
0.2
0.4
0.6
0.8
1
1.2
1.4
x1
x2
(a) Contour plot
-4 -3 -2 -1 0 1 2
-2
-1.5
-1
-0.5
0
0.5
1
1.5
2
2.5
3
-4
-2
0
2
-2
0
2
4
0
0.5
1
1.5
x1
(b) Mesh plot
x2
f(x1,x2)
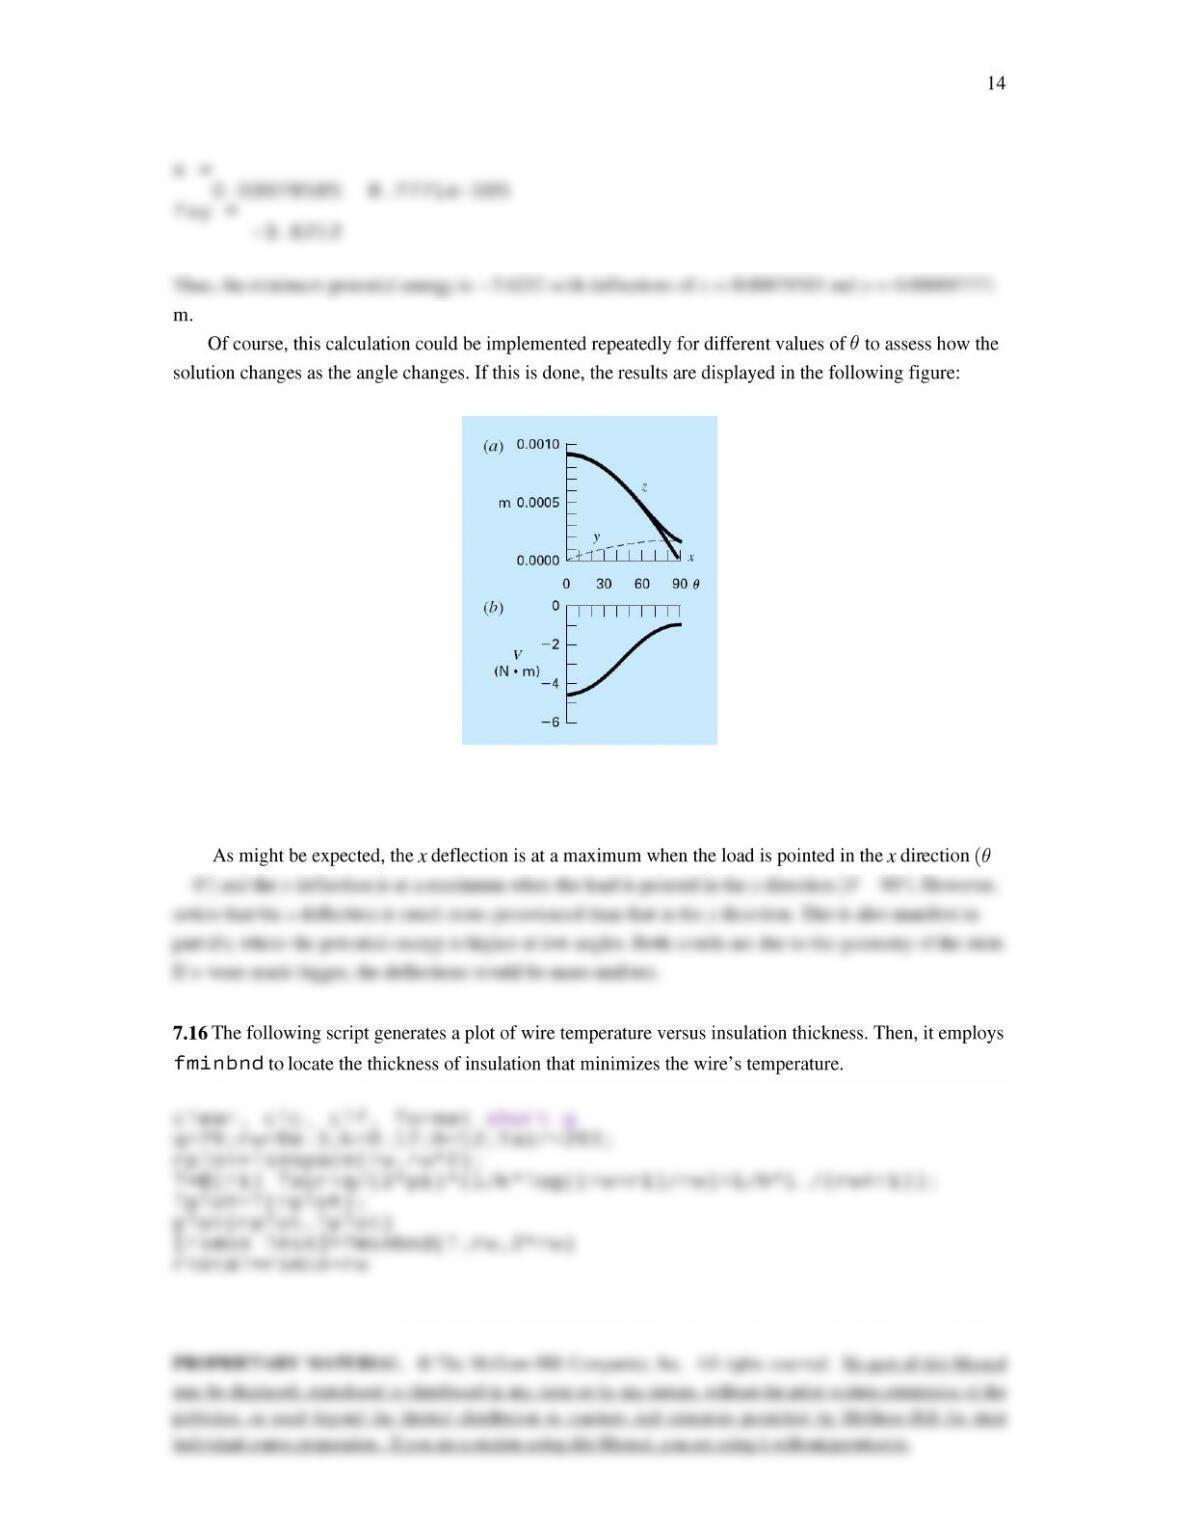
(a) The impact of different angles on the deflections (note that z is the resultant of the x and y
components) and (b) potential energy.
©
6 7 8 9 10 11 12
x 10-3
423.5
424
424.5
425
425.5