0.22 0.23 0.24 0.25 0.26 0.27 0.28 0.29
0
100
200
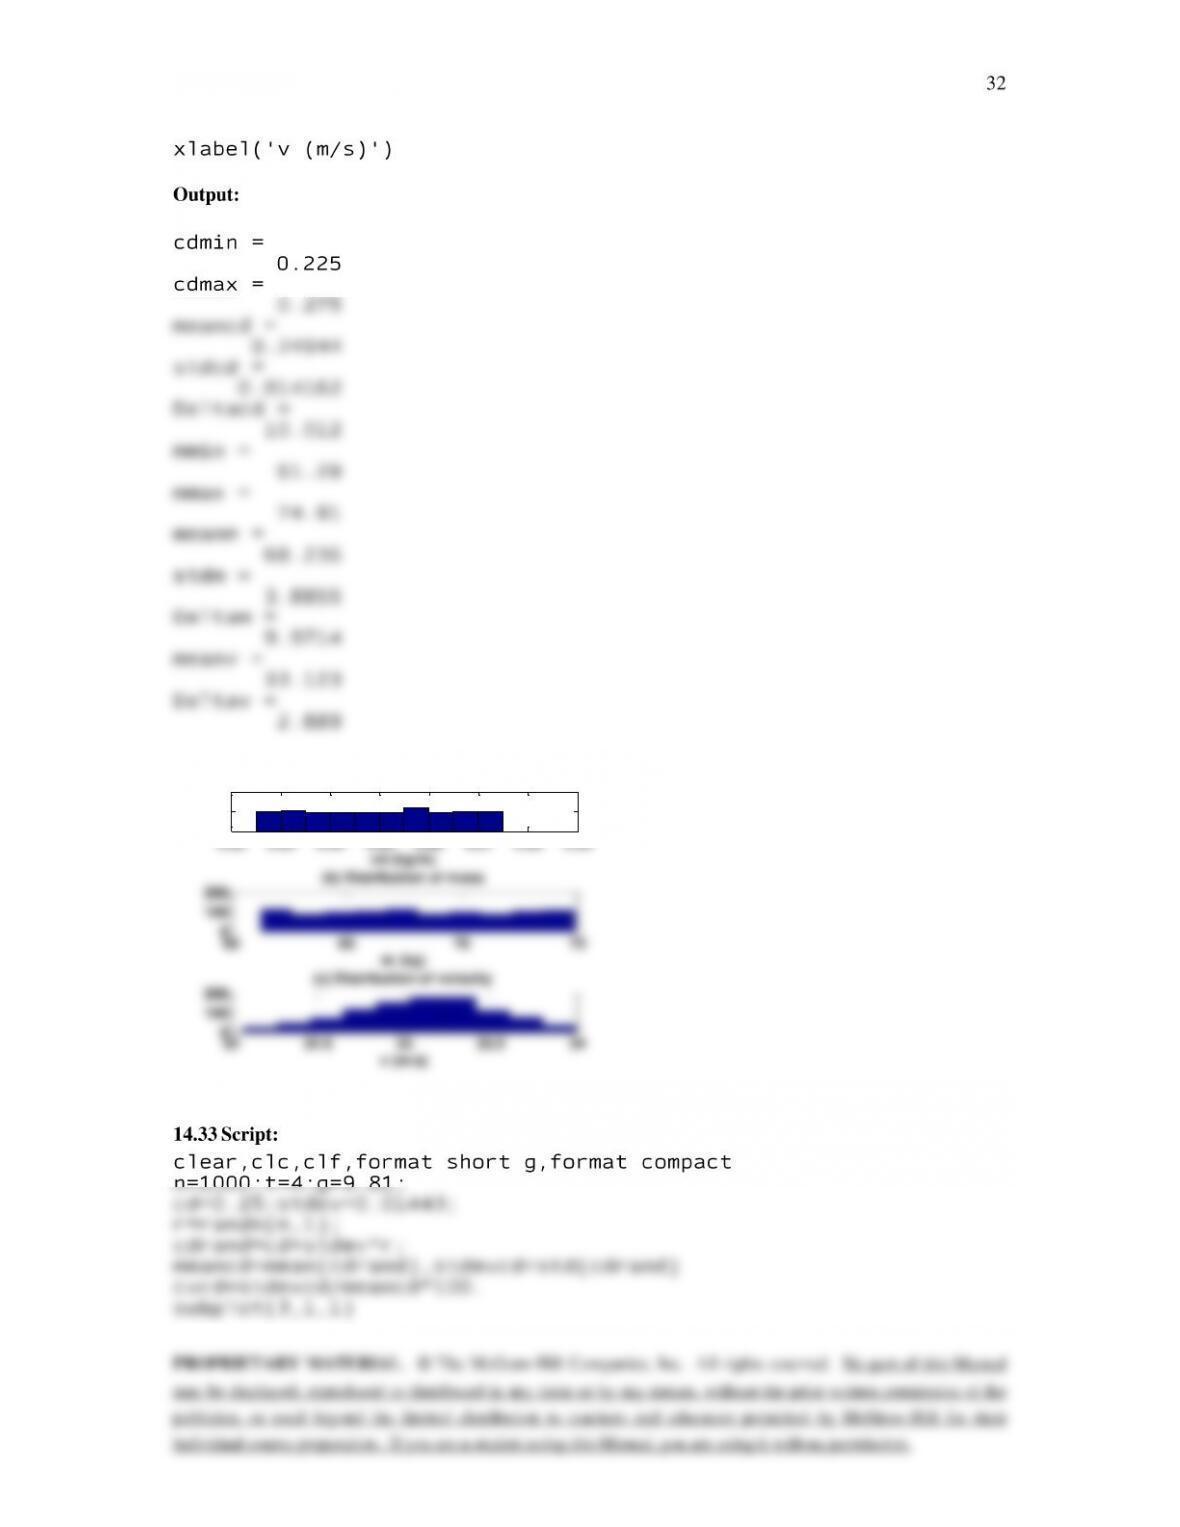
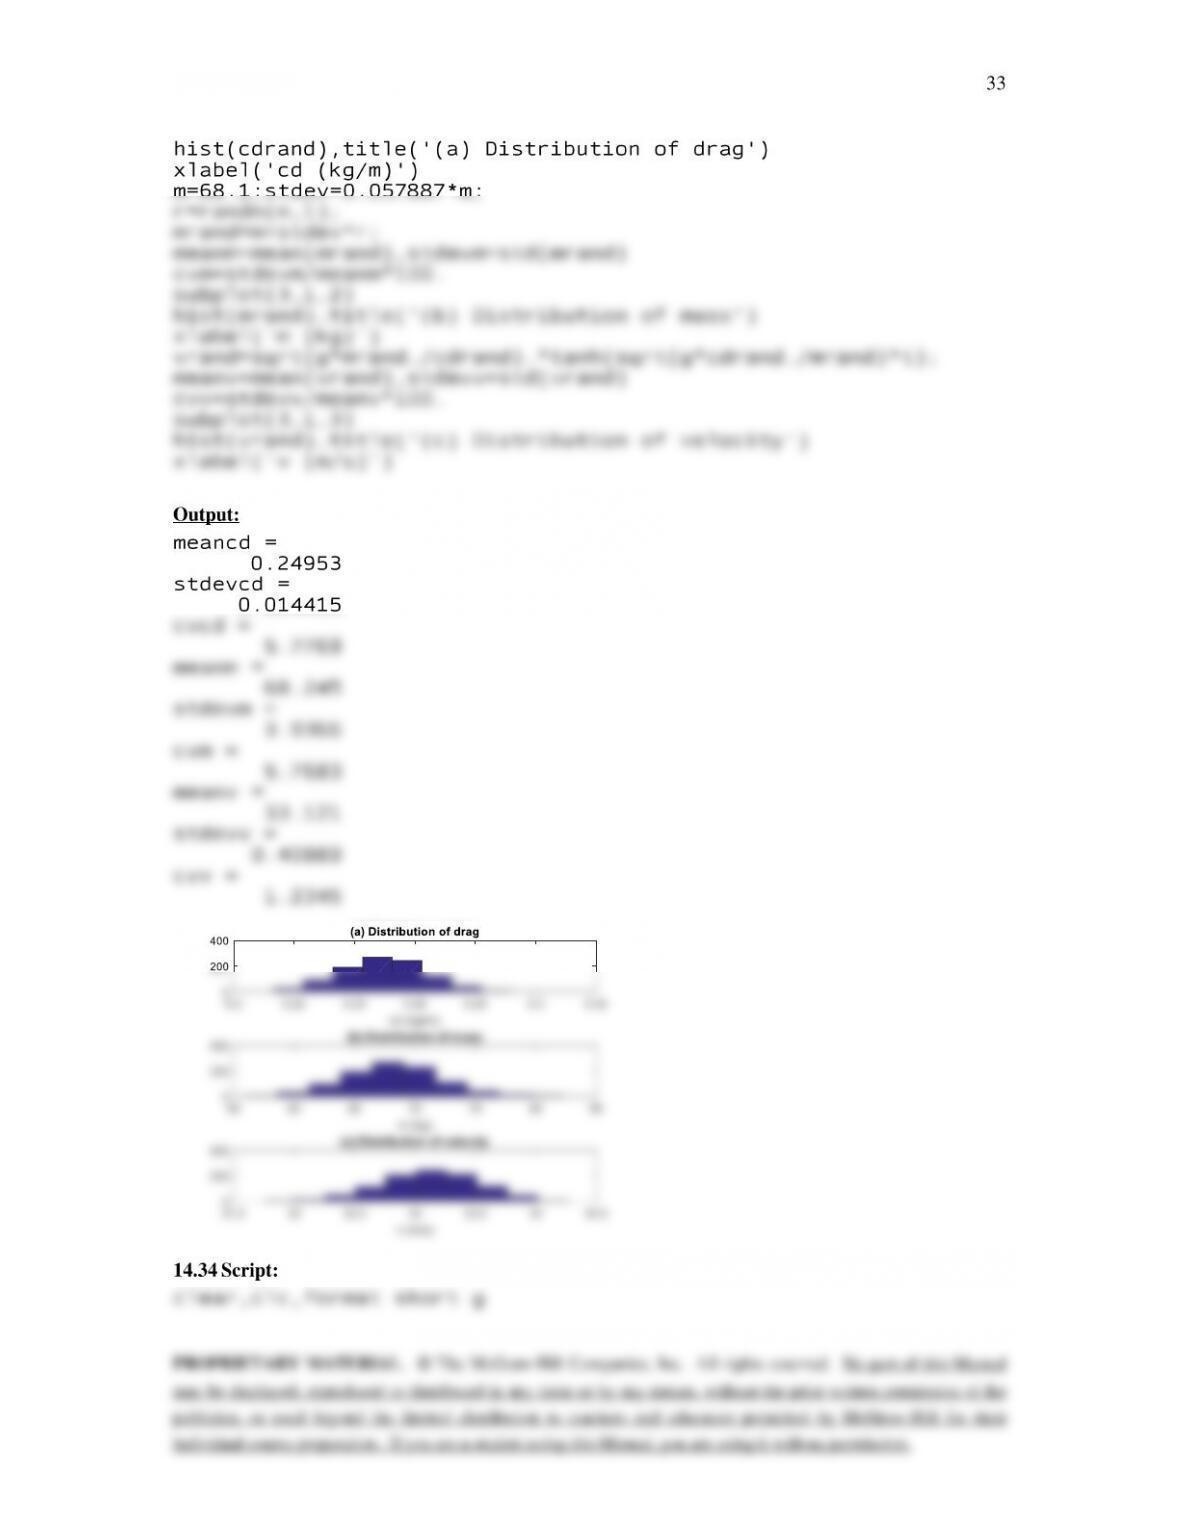
(a) Distribution of drag
cd (kg/m)
60 65 70 75
0
100
200
(b) Distribution of mass
m (kg)
32 32.5 33 33.5 34
0
100
200
(c) Distribution of velocity
v (m/s)
©
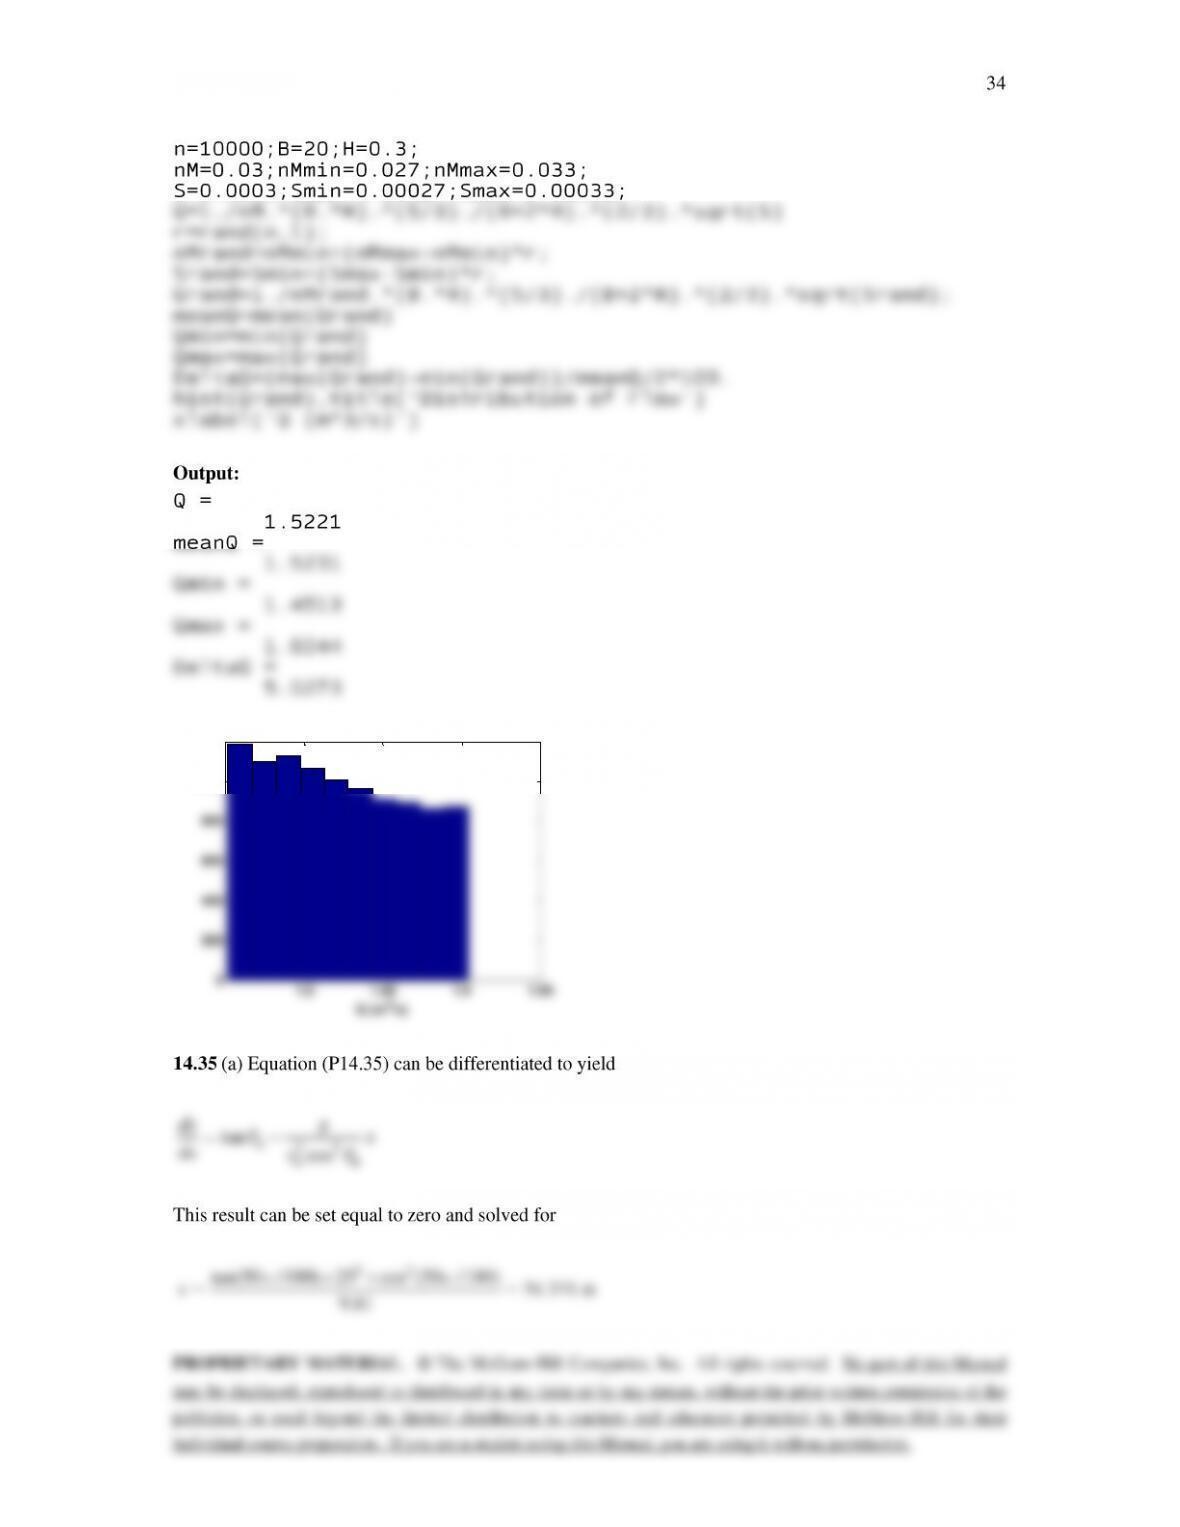
1.5 1.55 1.6 1.65
0
200
400
600
800
1000
1200
Distribution of Flow
Q (m3/s)
©
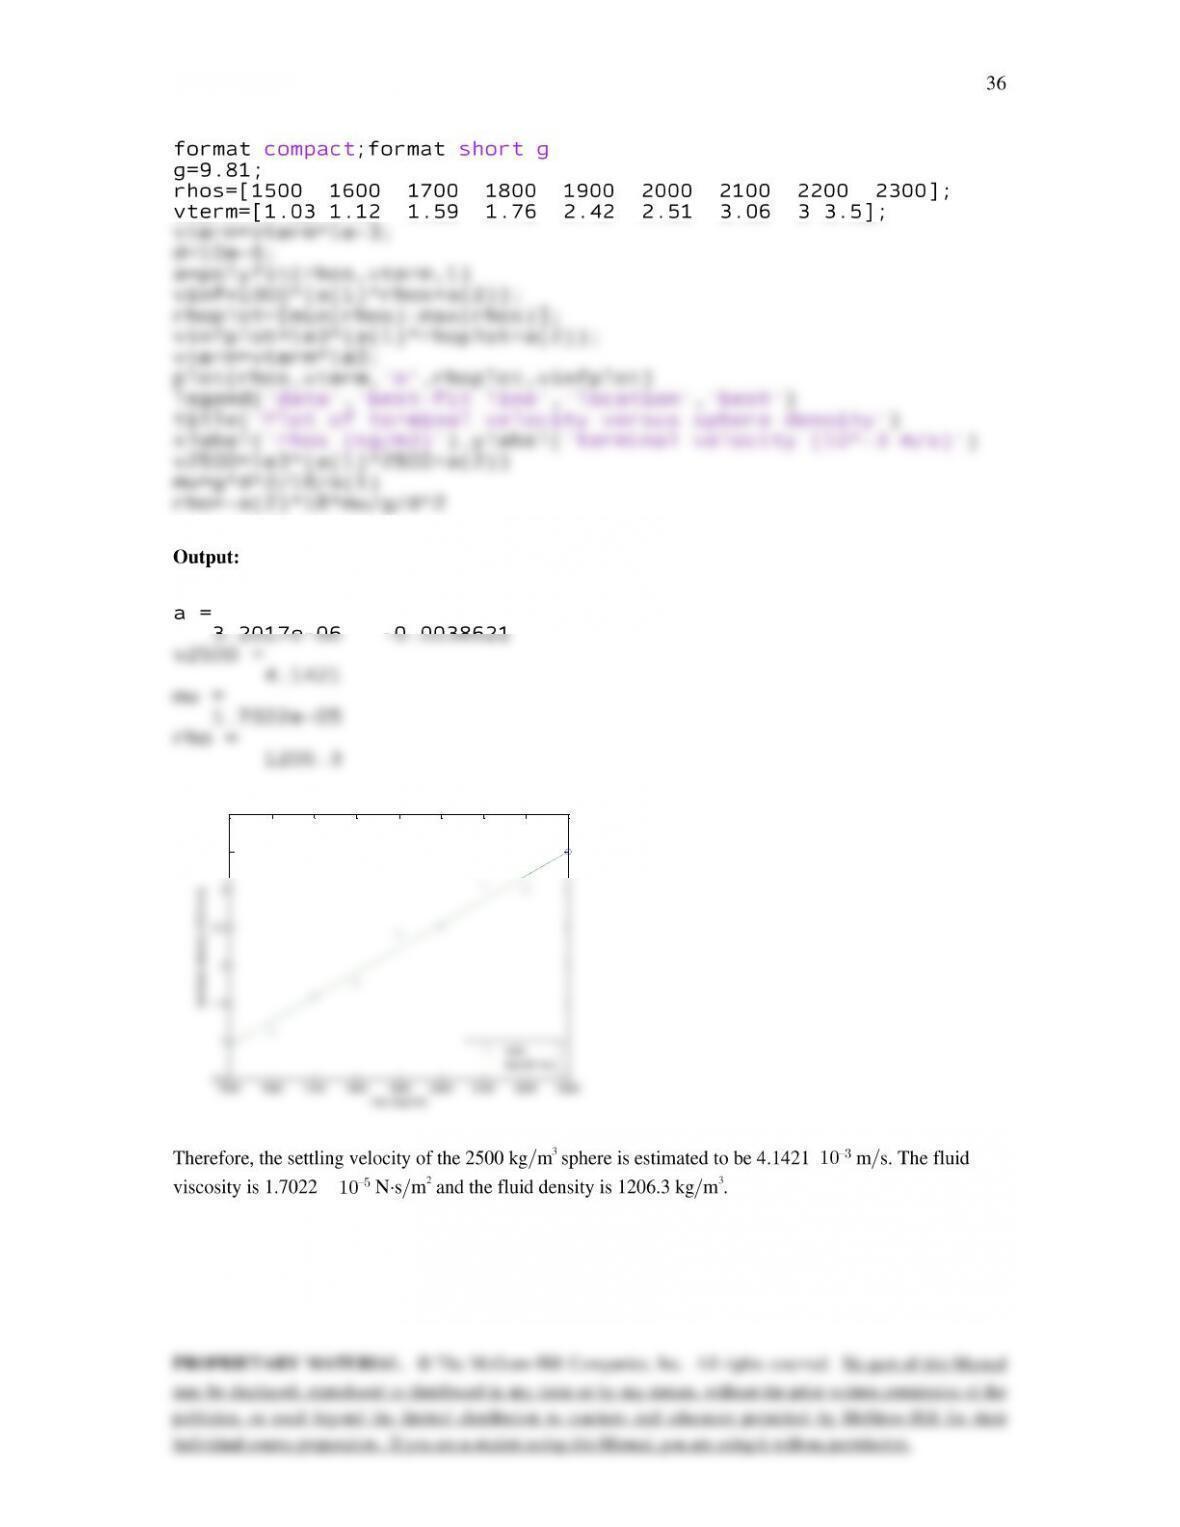
1500 1600 1700 1800 1900 2000 2100 2200 2300
0.5
1
1.5
2
2.5
3
3.5
4
rhos (kg/m3)
terminal velocity (10
–3 m/s)
Plot of terminal velocity versus sphere density
data
best-fit line

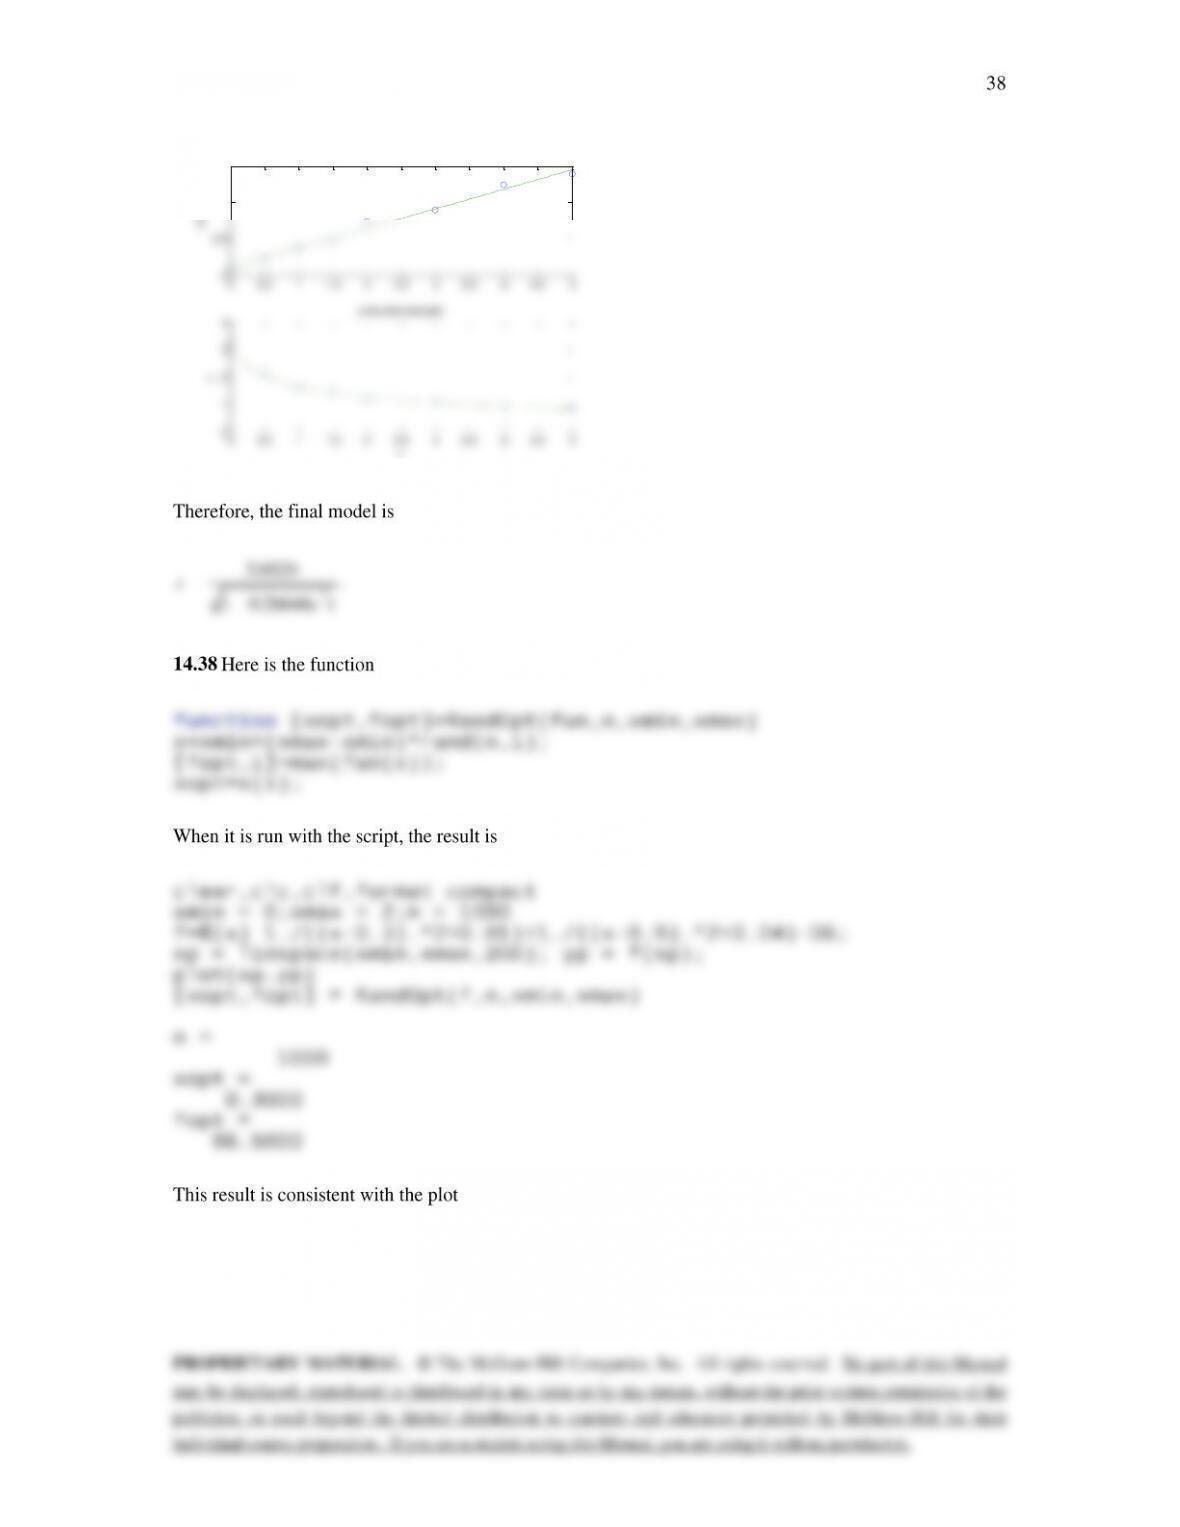
0 0.5 1 1.5 2 2.5 3 3.5 4 4.5 5
0
0.5
1
1.5
linear transformed plot
1/c2
0 0.5 1 1.5 2 2.5 3 3.5 4 4.5 5
0
1
2
3
4
untransformed plot
t
c