B-230 SOLUTIONS
Intermediate
13. To find the real return, we first need to find the nominal return, which means we need the current price
of the bond. Going back to the chapter on pricing bonds, we find the current price is:
P
1 = $80(PVIFA7%,6) + $1,000(PVIF7%,6) = $1,047.67
So the nominal return is:
R = [($1,047.67 – 1,030) + 80]/$1,030 = .0948 or 9.48%
14. Here we know the average stock return, and four of the five returns used to compute the average return.
We can work the average return equation backward to find the missing return. The average return is
calculated as:
.525 = .07 – .12 + .18 + .19 + R
R = .205 or 20.5%
The missing return has to be 20.5 percent. Now we can use the equation for the variance to find:
15. The arithmetic average return is the sum of the known returns divided by the number of returns, so:
Arithmetic average return = (.03 + .38 + .21 – .15 + .29 – .13) / 6
Arithmetic average return = .1050 or 10.50%
Using the equation for the geometric return, we find:
year. The return for each year is:
R
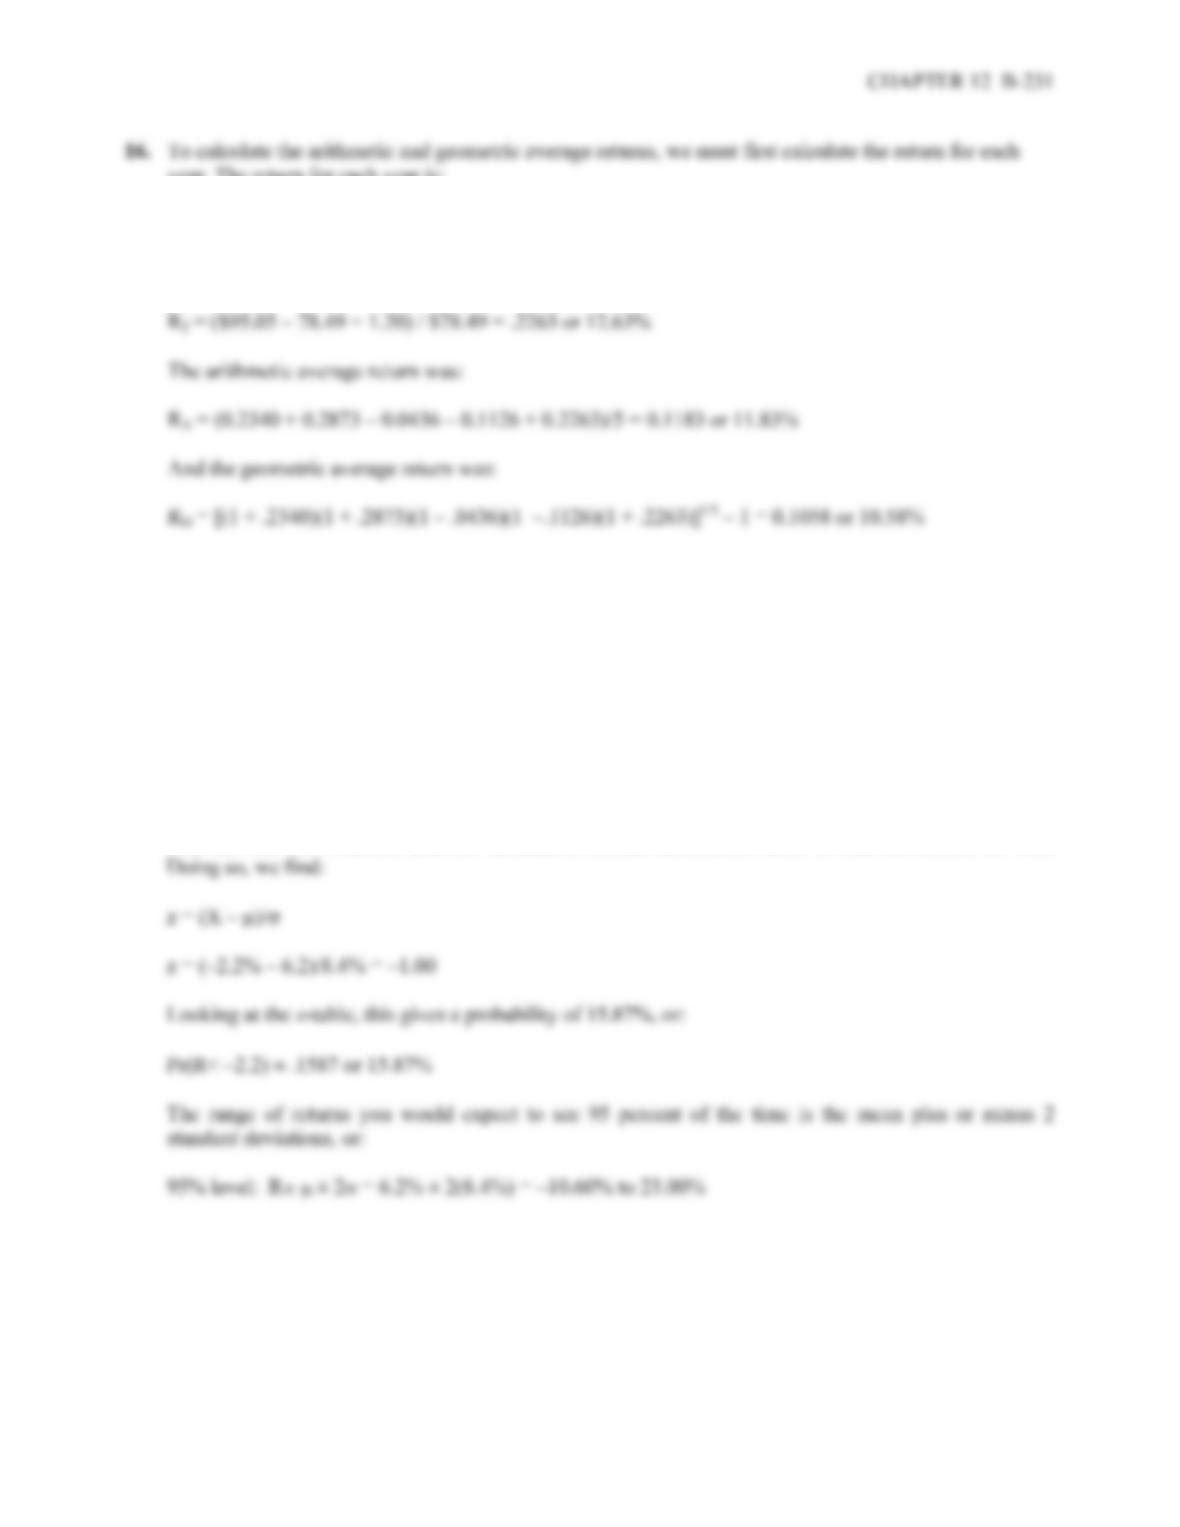
1 = ($73.66 – 60.18 + 0.60) / $60.18 = .2340 or 23.40%
R
2 = ($94.18 – 73.66 + 0.64) / $73.66 = .2873 or 28.73%
R
3 = ($89.35 – 94.18 + 0.72) / $94.18 = –.0436 or –4.36%
R
4 = ($78.49 – 89.35 + 0.80)/ $89.35 = –.1126 or 11.26%
17. Looking at the long-term corporate bond return history in Figure 12.10, we see that the mean return was
6.2 percent, with a standard deviation of 8.4 percent. In the normal probability distribution,
approximately 2/3 of the observations are within one standard deviation of the mean. This means that
1/3 of the observations are outside one standard deviation away from the mean. Or:
Pr(R< –2.2 or R>14.6) 1/3
But we are only interested in one tail here, that is, returns less than –2.2 percent, so:
Pr(R< –2.2)
1/6
You can use the z-statistic and the cumulative normal distribution table to find the answer as well.
18. The mean return for small company stocks was 17.1 percent, with a standard deviation of 32.6 percent.
Doubling your money is a 100% return, so if the return distribution is normal, we can use the z-statistic.
So:
z = (X – µ)/
19. It is impossible to lose more than 100 percent of your investment. Therefore, return distributions are
truncated on the lower tail at –100 percent.
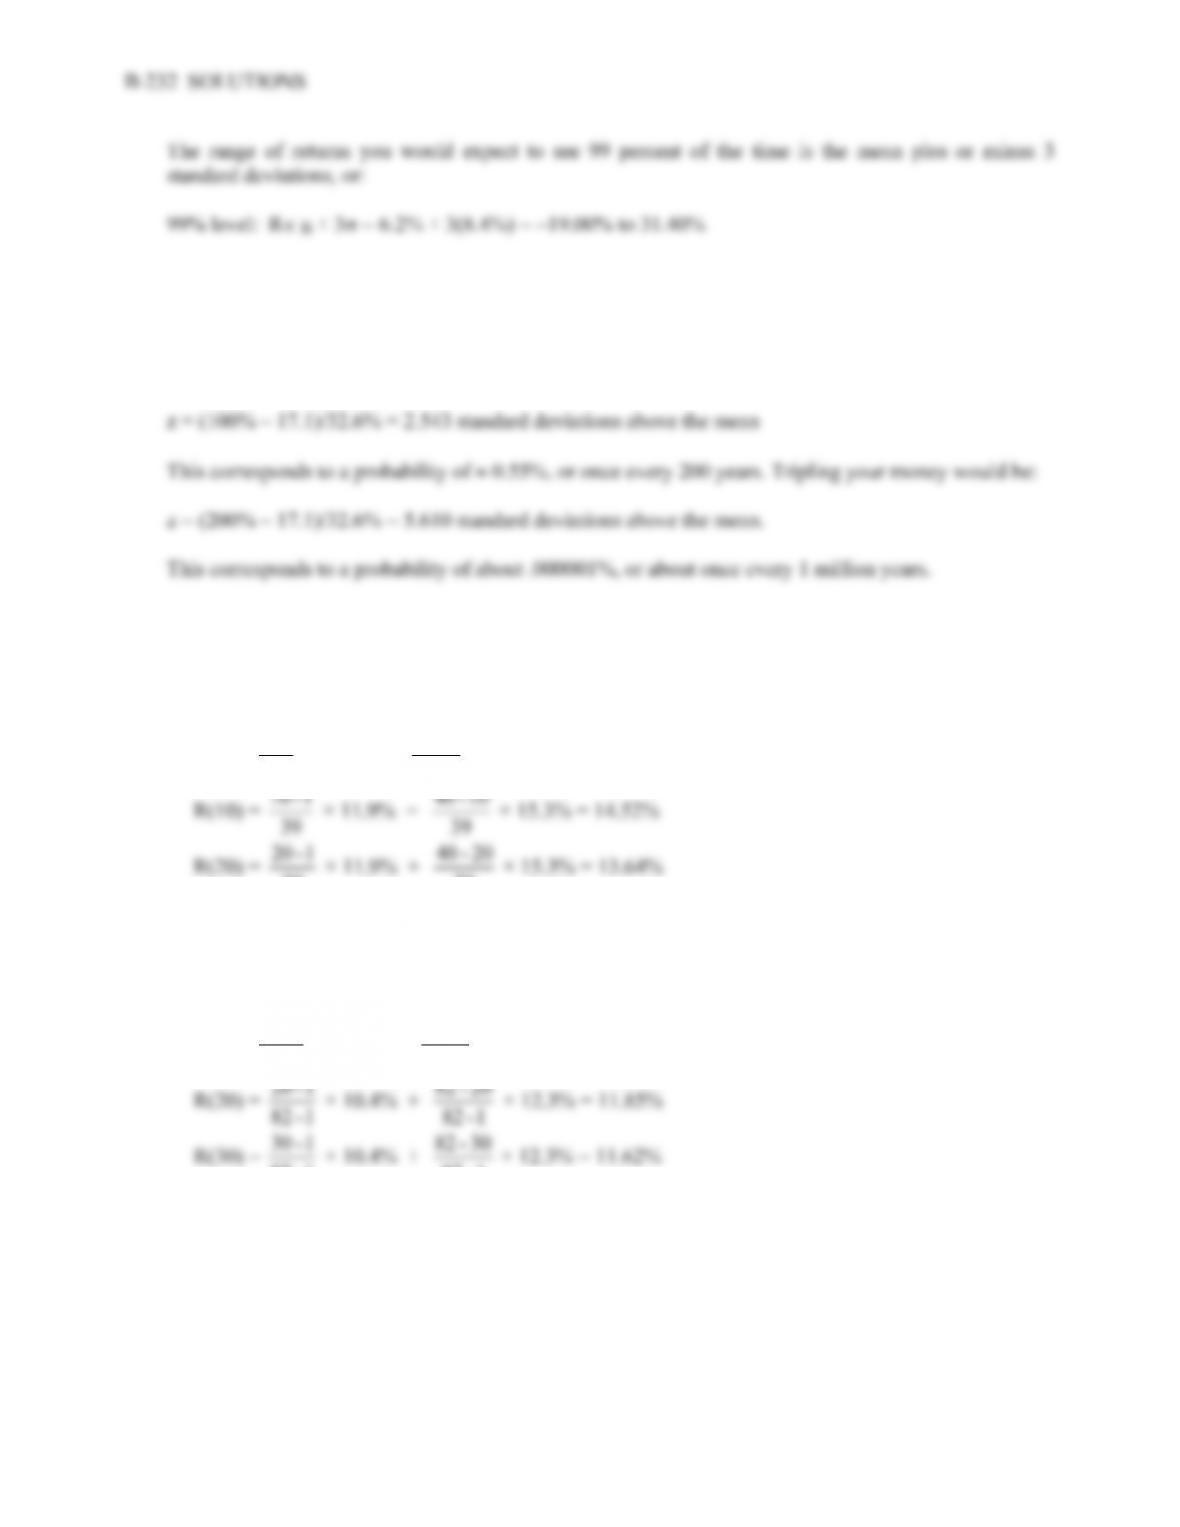
20. To find the best forecast, we apply Blume’s formula as follows:
R(5) =
39
1 – 5 × 11.9% + 39
5 – 40 × 15.3% = 14.95%
1 – 10 × 11.9% + 39
10 – 40 × 15.3% = 14.52%
R(20) =
39
21. The best forecast for a one year return is the arithmetic average, which is 12.3 percent. The geometric
average, found in Table 12.4 is 10.4 percent. To find the best forecast for other periods, we apply
Blume’s formula as follows:
R(5) =
1 – 82
1 – 5 × 10.4% + 1 – 82
5 – 82 × 12.3% = 12.21%
1 – 20 × 10.4% + 1 – 82
20 – 82 × 12.3% = 11.85%
R(30) = 1 –82
CHAPTER 12 B-233
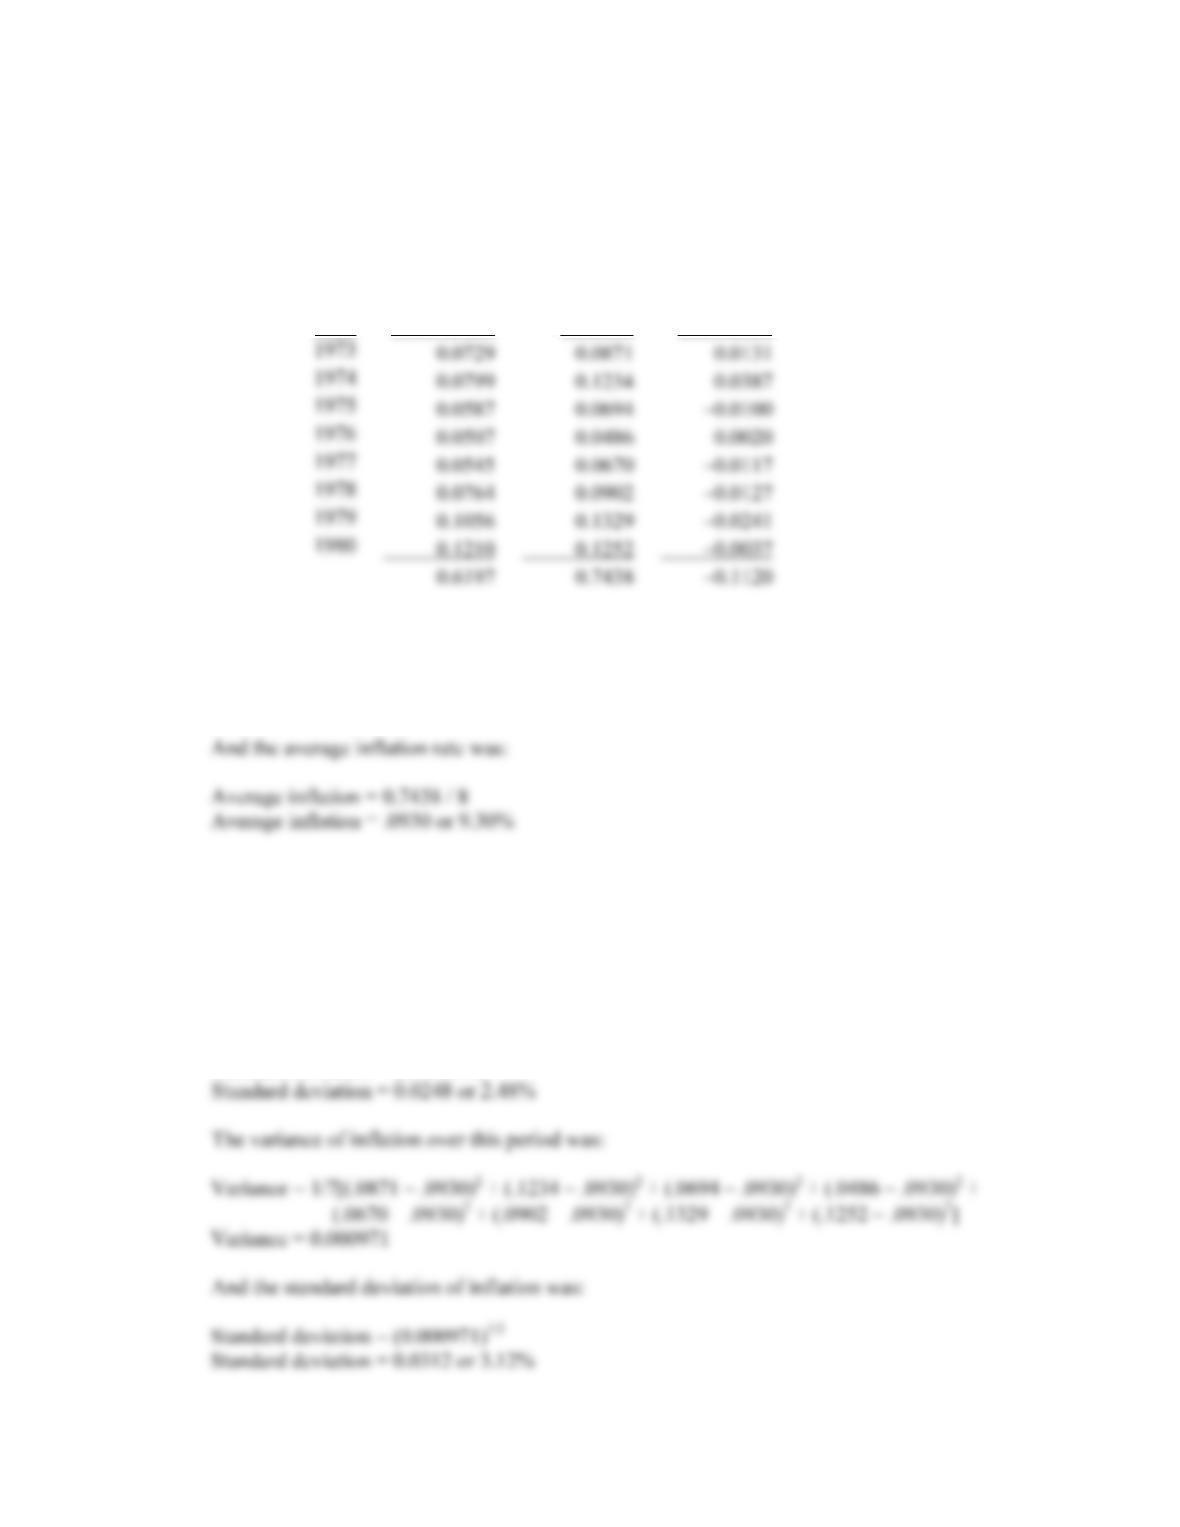
22. To find the real return we need to use the Fisher equation. Re-writing the Fisher equation to solve for
the real return, we get:
r = [(1 + R)/(1 + h)] – 1
So, the real return each year was:
Year T-bill return Inflation Real return
a. The average return for T-bills over this period was:
Average return = 0.619 / 8
Average return = .0775 or 7.75%
b. Using the equation for variance, we find the variance for T-bills over this period was:
Variance = 1/7[(.0729 – .0775)2 + (.0799 – .0775)2 + (.0587 – .0775)2 + (.0507 – .0775)2 +
(.0545 – .0775)2 + (.0764 – .0775)2 + (.1056 – .0775)2 + (.1210 .0775)2]
Variance = 0.000616
And the standard deviation for T-bills was:
Standard deviation = (0.000616)1/2
B-234 SOLUTIONS
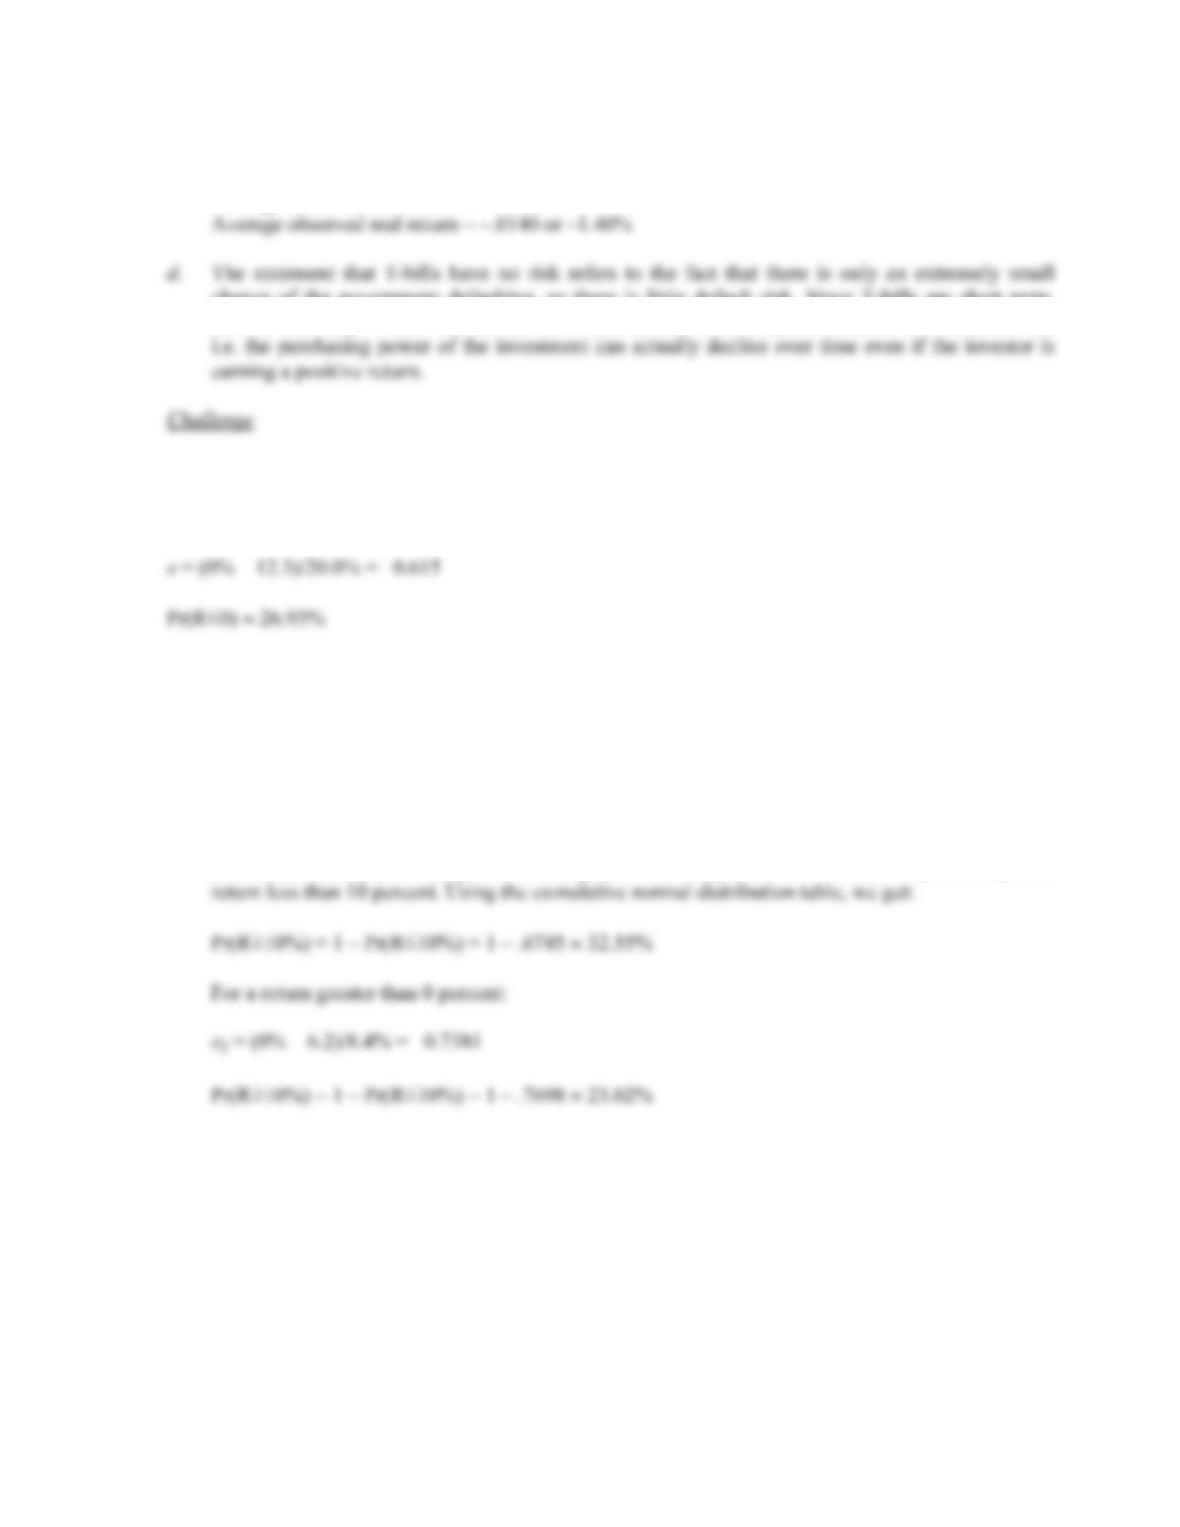
c. The average observed real return over this period was:
Average observed real return = –.1122 / 8
chance of the government defaulting, so there is little default risk. Since T-bills are short term,
there is also very limited interest rate risk. However, as this example shows, there is inflation risk,
23. Using the z-statistic, we find:
z = (X – µ)/
24. For each of the questions asked here, we need to use the z-statistic, which is:
z = (X – µ)/
a. z1 = (10% – 6.2)/8.4% = 0.4524
This z-statistic gives us the probability that the return is less than 10 percent, but we are looking
for the probability the return is greater than 10 percent. Given that the total probability is 100
percent (or 1), the probability of a return greater than 10 percent is 1 minus the probability of a
b. The probability that T-bill returns will be greater than 10 percent is:
z
3 = (10% – 3.8)/3.1% = 2
Pr(R≥10%) = 1 – Pr(R≤10%) = 1 – .9772 2.28%
CHAPTER 12 B-235
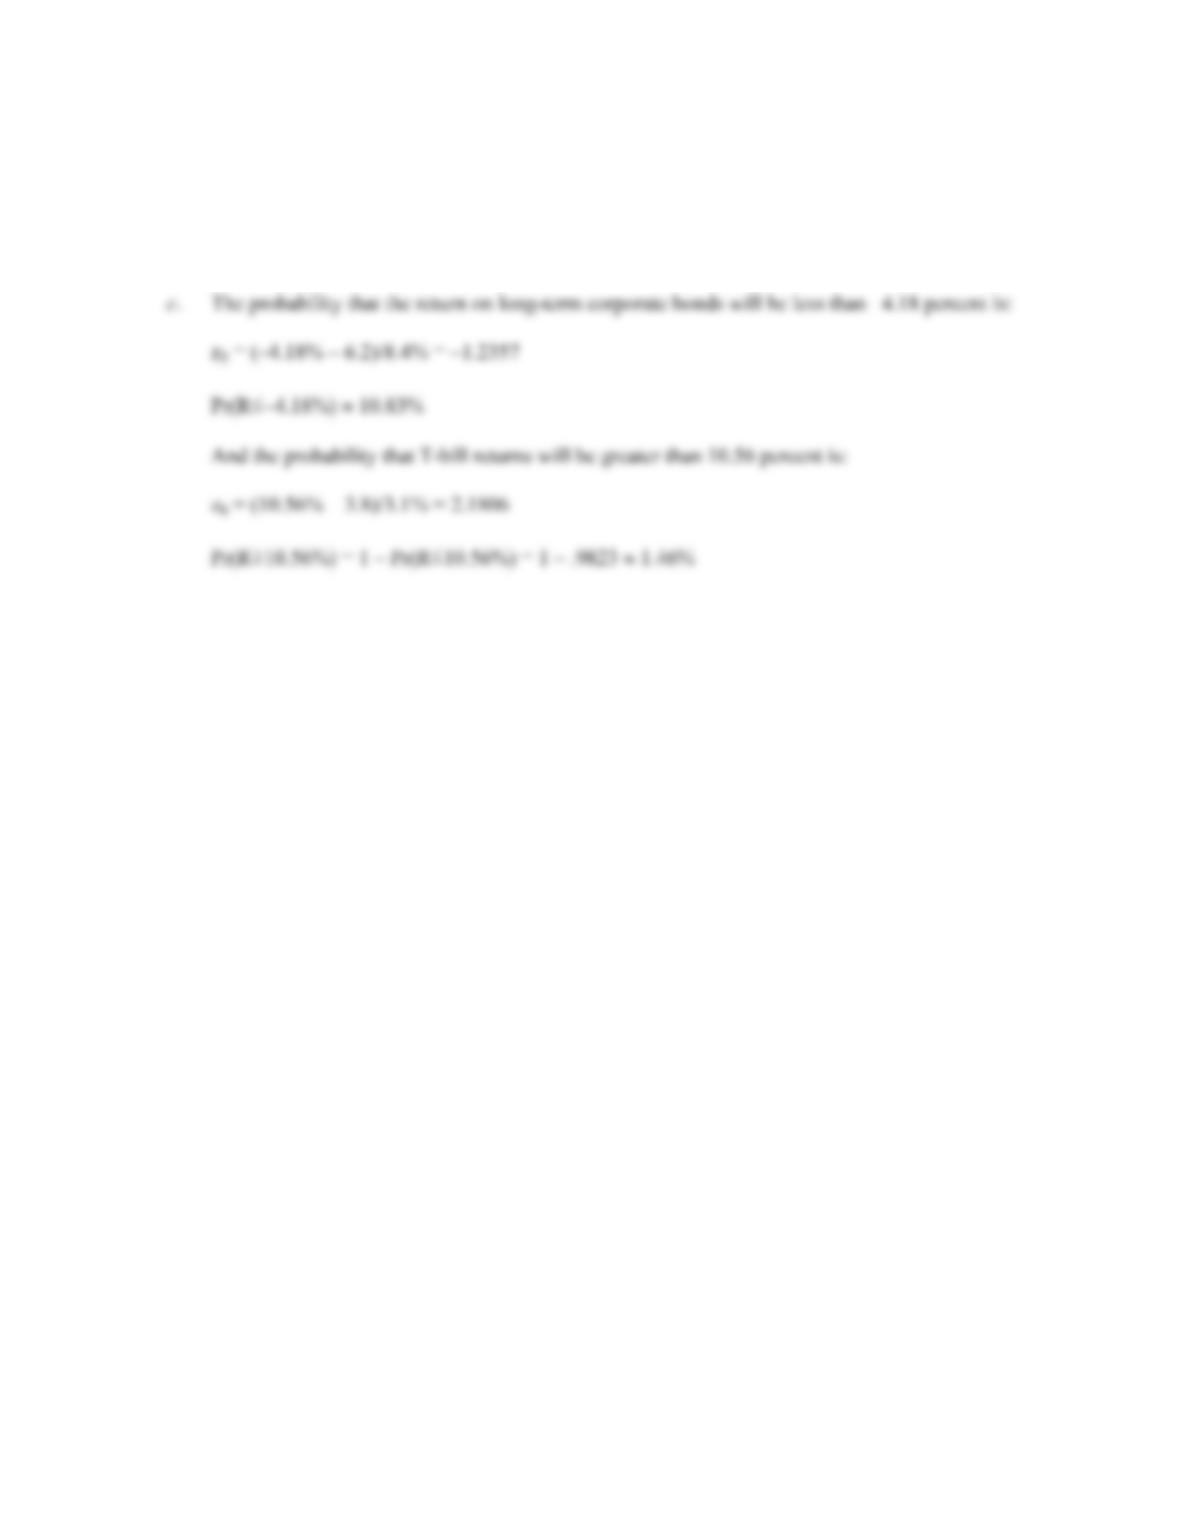
And the probability that T-bill returns will be less than 0 percent is:
z
4 = (0% – 3.8)/3.1% = –1.2258
Pr(R≤0) 11.01%