CHAPTER 12 B-225
b. Under (2), if the market is not semi-strong form efficient, then this information could be used to
buy the stock “cheap” before the rest of the market discovers the financial statement anomaly.
Since (2) is stronger than (1), both imply that a profit opportunity exists; under (3) and (4), this
information is fully impounded in the current price and no profit opportunity exists.
c. Under (3), if the market is not strong form efficient, then this information could be used as a
profitable trading strategy, by noting the buying activity of the insiders as a signal that the stock is
underpriced or that good news is imminent. Since (1) and (2) are weaker than (3), all three imply
that a profit opportunity exists. Note that this assumes the individual who sees the insider trading is
the only one who sees the trading. If the information about the trades made by company
management is public information, it will be discounted in the stock price and no profit
opportunity exists. Under (4), this information does not signal any profit opportunity for traders;
any pertinent information the manager-insiders may have is fully reflected in the current share
price.
Solutions to Questions and Problems
NOTE: All end of chapter problems were solved using a spreadsheet. Many problems require multiple steps.
Due to space and readability constraints, when these intermediate steps are included in this solutions
manual, rounding may appear to have occurred. However, the final answer for each problem is found
without rounding during any step in the problem.
Basic
1. The return of any asset is the increase in price, plus any dividends or cash flows, all divided by the
initial price. The return of this stock is:
2. The dividend yield is the dividend divided by price at the beginning of the period price, so:
Dividend yield = $2.40 / $91 = .0264 or 2.64%
3. Using the equation for total return, we find:
R = [($83 – 91) + 2.40] / $91 = –.0615 or –6.15%
And the dividend yield and capital gains yield are:
B-226 SOLUTIONS
4. The total dollar return is the increase in price plus the coupon payment, so:
Total dollar return = $1,070 – 1,040 + 70 = $100
The total percentage return of the bond is:
R = [($1,070 – 1,040) + 70] / $1,040 = .0962 or 9.62%
5. The nominal return is the stated return, which is 12.30 percent. Using the Fisher equation, the real return
was:
6. Using the Fisher equation, the real returns for long-term government and corporate bonds were:
(1 + R) = (1 + r)(1 + h)
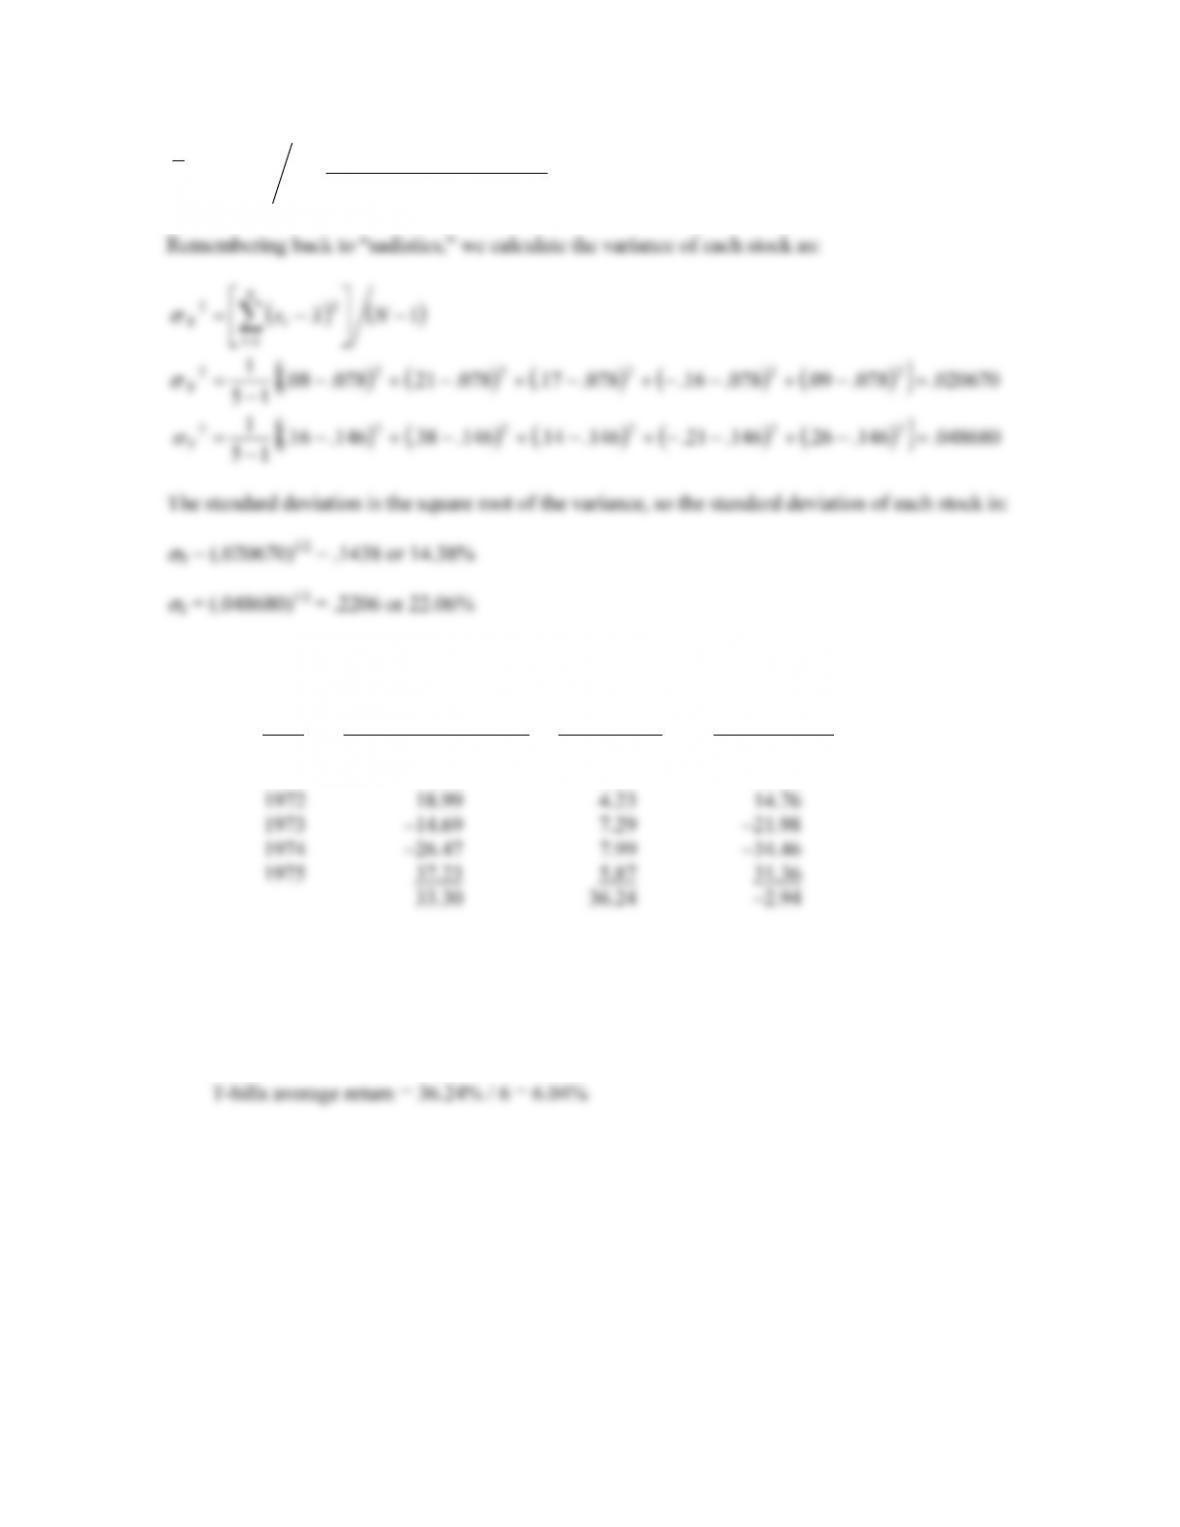
7. The average return is the sum of the returns, divided by the number of returns. The average return for each
stock was:
%7.80or .0780
5
09.16.17.21.08.
1
NxX N
ii
CHAPTER 12 B-227
%60.14or .1460
5
26.21.14.38.16.
1
NyY N
ii
8. We will calculate the sum of the returns for each asset and the observed risk premium first. Doing so,
we get:
Year Large co. stock return T-bill return Risk premium
1970 3.94% 6.50% 2.56%
1971 14.30 4.36 9.94
a. The average return for large company stocks over this period was:
Large company stocks average return = 33.30% / 6 = 5.55%
And the average return for T-bills over this period was:
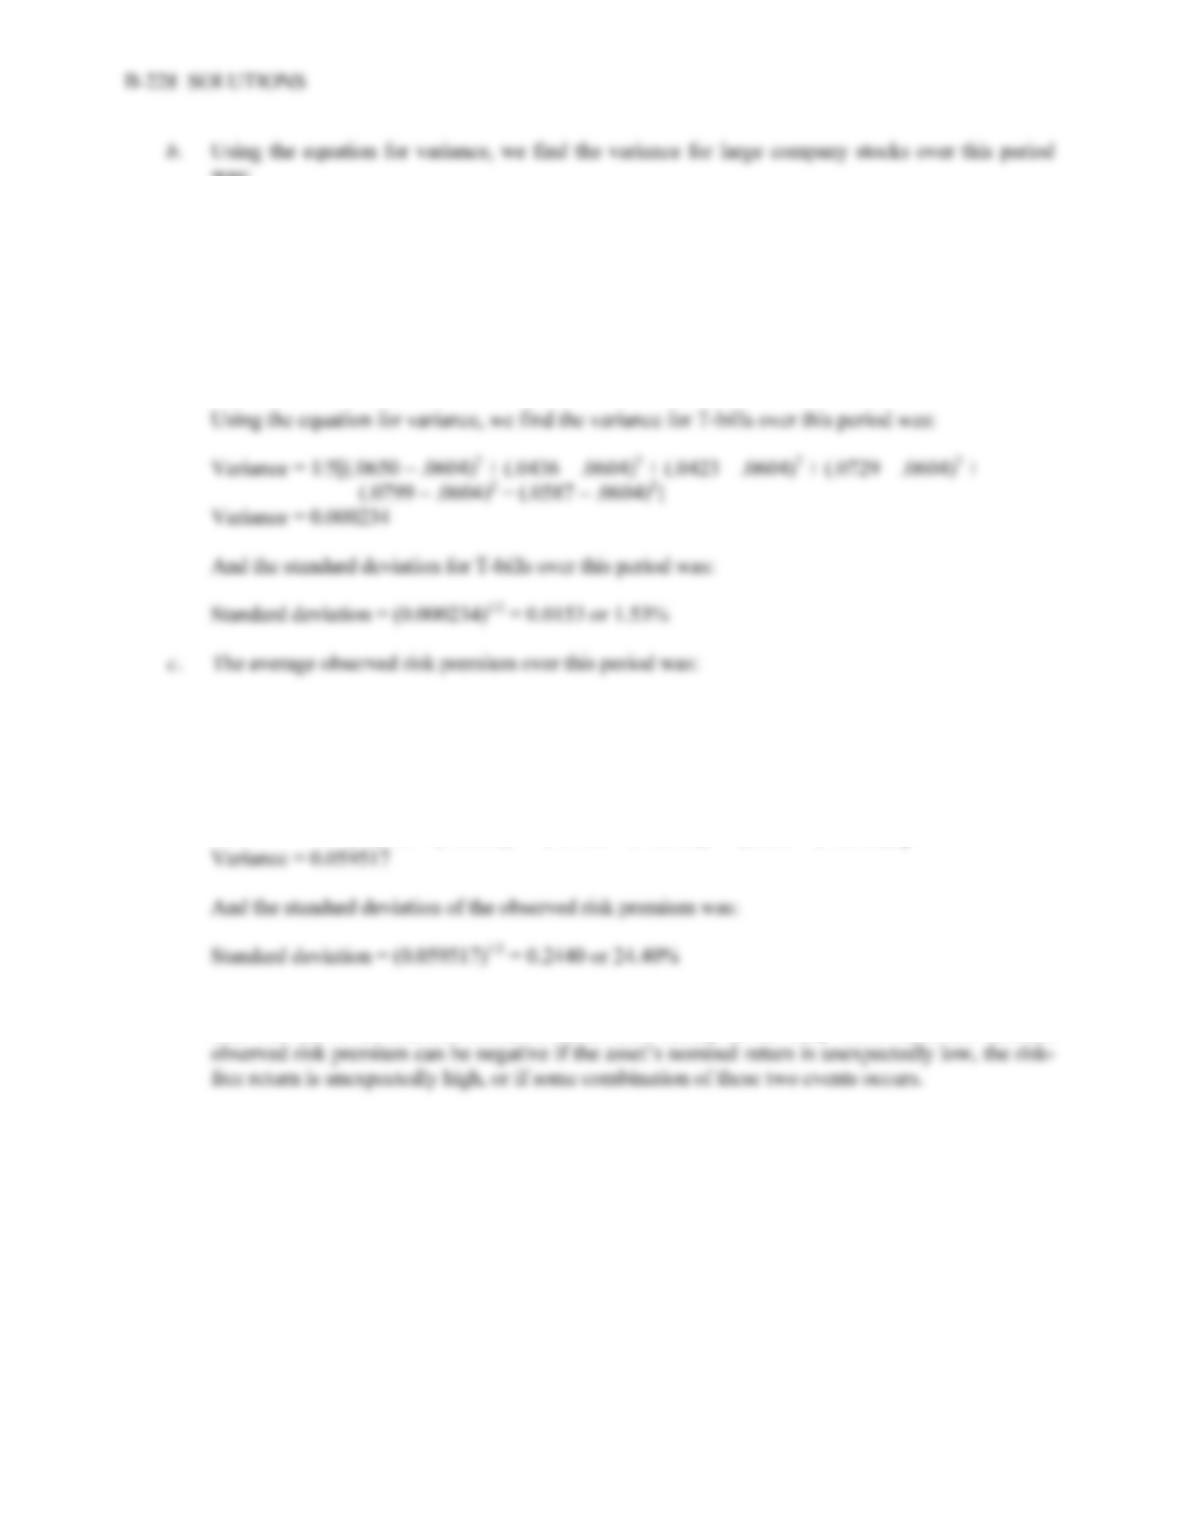
was:
Variance = 1/5[(.0394 – .0555)2 + (.1430 – .0555)2 + (.1899 – .0555)2 + (–.1469 – .0555)2 +
(–.2647 – .0555)2 + (.3723 – .0555)2]
Variance = 0.053967
And the standard deviation for large company stocks over this period was:
Standard deviation = (0.053967)1/2 = 0.2323 or 23.23%
Average observed risk premium = –2.94% / 6 = –0.49%
The variance of the observed risk premium was:
Variance = 1/5[(–.0256 – (–.0049))2 + (.0994 – (–.0049))2 + (.1476 – (–.0049)))2 +
(–.2198 – (–.0049))2 + (–.3446 – (–.0049))2 + (.3136 – (–.0049))2]
d. Before the fact, for most assets the risk premium will be positive; investors demand compensation
over and above the risk-free return to invest their money in the risky asset. After the fact, the
9. a. To find the average return, we sum all the returns and divide by the number of returns, so:
Average return = (.07 –.12 +.11 +.38 +.14)/5 = .1160 or 11.60%
CHAPTER 12 B-229
b. Using the equation to calculate variance, we find:
Variance = 1/4[(.07 – .116)2 + (–.12 – .116)2 + (.11 – .116)2 + (.38 – .116)2 +
(.14 – .116)2]
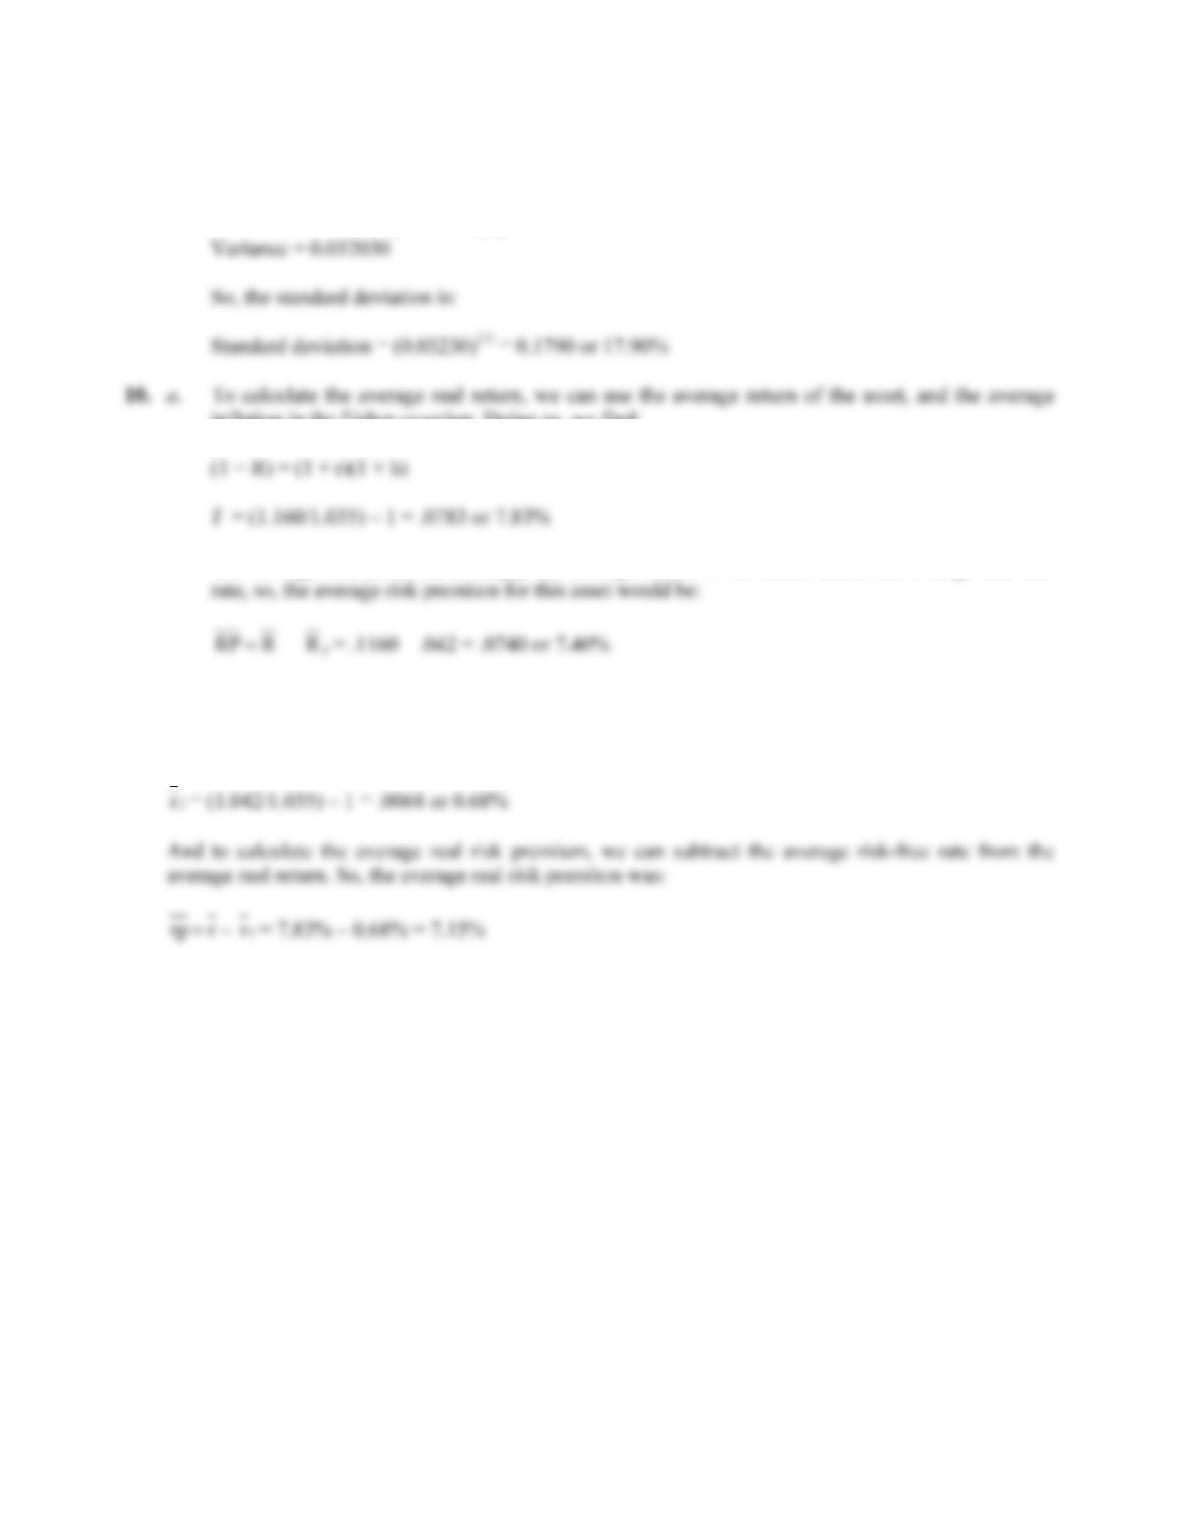
inflation in the Fisher equation. Doing so, we find:
b. The average risk premium is simply the average return of the asset, minus the average risk-free
11. We can find the average real risk-free rate using the Fisher equation. The average real risk-free rate was:
(1 + R) = (1 + r)(1 + h)
12. T-bill rates were highest in the early eighties. This was during a period of high inflation and is
consistent with the Fisher effect.