
Solutions Manual
for
Digital Communications, 5th Edition
(Chapter 3) 1
Prepared by
Kostas Stamatiou
January 11, 2008
Problem 3.1
Assuming Mis even we have
12+ 32+ 52+…(M−1)2=
M
X
i=1
i2−
M/2
X
k=1
(2k)2
M/2
X
Problem 3.2
s1=√E,0
✻
f2
s3
o
As we see, this signal set is indeed equivalent to a 4-phase PSK signal.

Problem 3.3
1.2. The signal space diagram, together with the Gray encoding of each signal point is given
in the following figure :
00
01
11
10
The signal points that may be transmitted at times t= 2nT n = 0,1, … are given with blank
circles, while the ones that may be transmitted at times t= 2nT + 1, n = 0,1, … are given with
filled circles.
Problem 3.4
1. Consider the QAM constellation of Fig. P3-4. Using the Pythagorean theorem we can find the
radius of the inner circle as:
2. If we denote by rthe radius of the circle, then using the cosine theorem we obtain:
3. The average transmitted power of the PSK constellation is:
PPSK = 8 ×1
8× A
p2−√2!2
=⇒PPSK =A2
2−√2
Problem 3.5
1. Although it is possible to assign three bits to each point of the 8-PSK signal constellation so that
adjacent points differ in only one bit, (e.g. going in a clockwise direction : 000, 001, 011, 010, 110,
111, 101, 100). this is not the case for the 8-QAM constellation of Figure P3-4. This is because there
2. Since each symbol conveys 3 bits of information, the resulted symbol rate is :
Problem 3.6
The constellation of Fig. P3-6(a) has four points at a distance 2Afrom the origin and four points
at a distance 2√2A. Thus, the average transmitted power of the constellation is:

5
The second constellation has four points at a distance √7Afrom the origin, two points at a dis-
tance √3Aand two points at a distance A. Thus, the average transmitted power of the second
constellation is:
Since Pb< Pathe second constellation is more power efficient.
Problem 3.7
One way to label the points of the V.29 constellation using the Gray-code is depicted in the next
figure.
O
O
O
O
0101
0111
0110
1011
1010
Problem 3.8
We assume that the input bits 0, 1 are mapped to the symbols -1 and 1 respectively. The terminal

6
phase of an MSK signal at time instant nis given by
2
k
X
k=0
where θ0is the initial phase and akis ±1 depending on the input bit at the time instant k. The
following table shows θ(n;a) for two different values of θ0(0, π), and the four input pairs of data:
{00,01,10,11}.
θ0b0b1a0a1θ(n;a)
0 0 0 -1 -1 −π
0 0 1 -1 1 0
Problem 3.9
1.
(i) There are no correlative states in this system, since it is a full response CPM. Based on (3-3-16),
we obtain the phase states :
Θs=0,2π
3,4π
3
2.
(i) The combined states are Sn= (θn, In−1, In−2),where , In−1/n−2take the values ±1.Hence
there are 3 ×2×2 = 12 combined states in all.

Problem 3.10
The bandwidth required for transmission of an M–ary PAM signal is
W=R
2 log2MHz
Problem 3.11
The autocorrelation function for u∆(t) is :
Ru∆u∆(t) = E[u∆(t+τ)u∗
∆(t)]
=P∞
n=−∞ P∞
m=−∞ E(ImI∗
n)E[u(t+τ−mT −∆)u∗(t−nT −∆)]
Let a= ∆ + nT, da =d∆,and a∈(−∞,∞).Then :
1

8
Thus we have obtained the same autocorrelation function as given by (4.4.11). Consequently the
power spectral density of u∆(t) is the same as the one given by (4.4.12) :
Problem 3.12
The 16-QAM signal is represented as s(t) = Incos 2πf t +Qnsin 2πft, where In={±1,±3}, Qn=
{±1,±3}.A superposition of two 4-QAM (4-PSK) signals is :
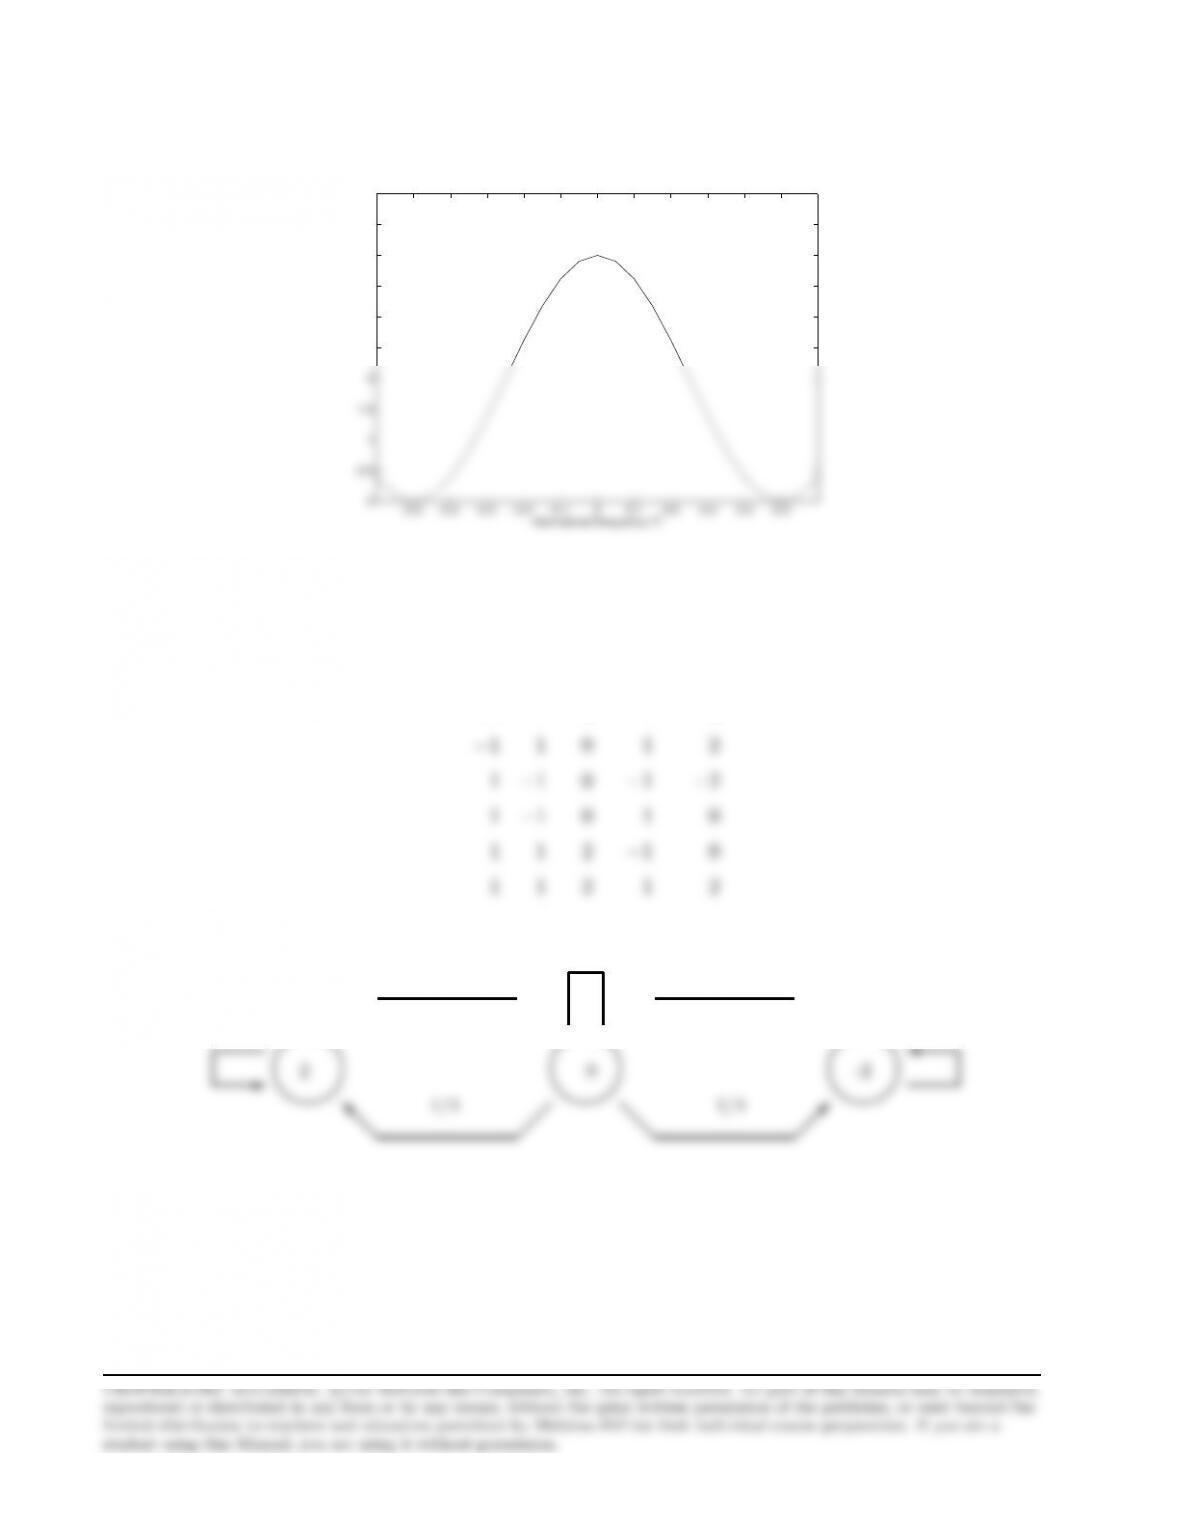
Problem 3.13
We have that Suu(f) = 1
T|G(f)|2Sii(f) But E(In) = 0, E |In|2= 1,hence : Rii (m) =
0, m 6= 0
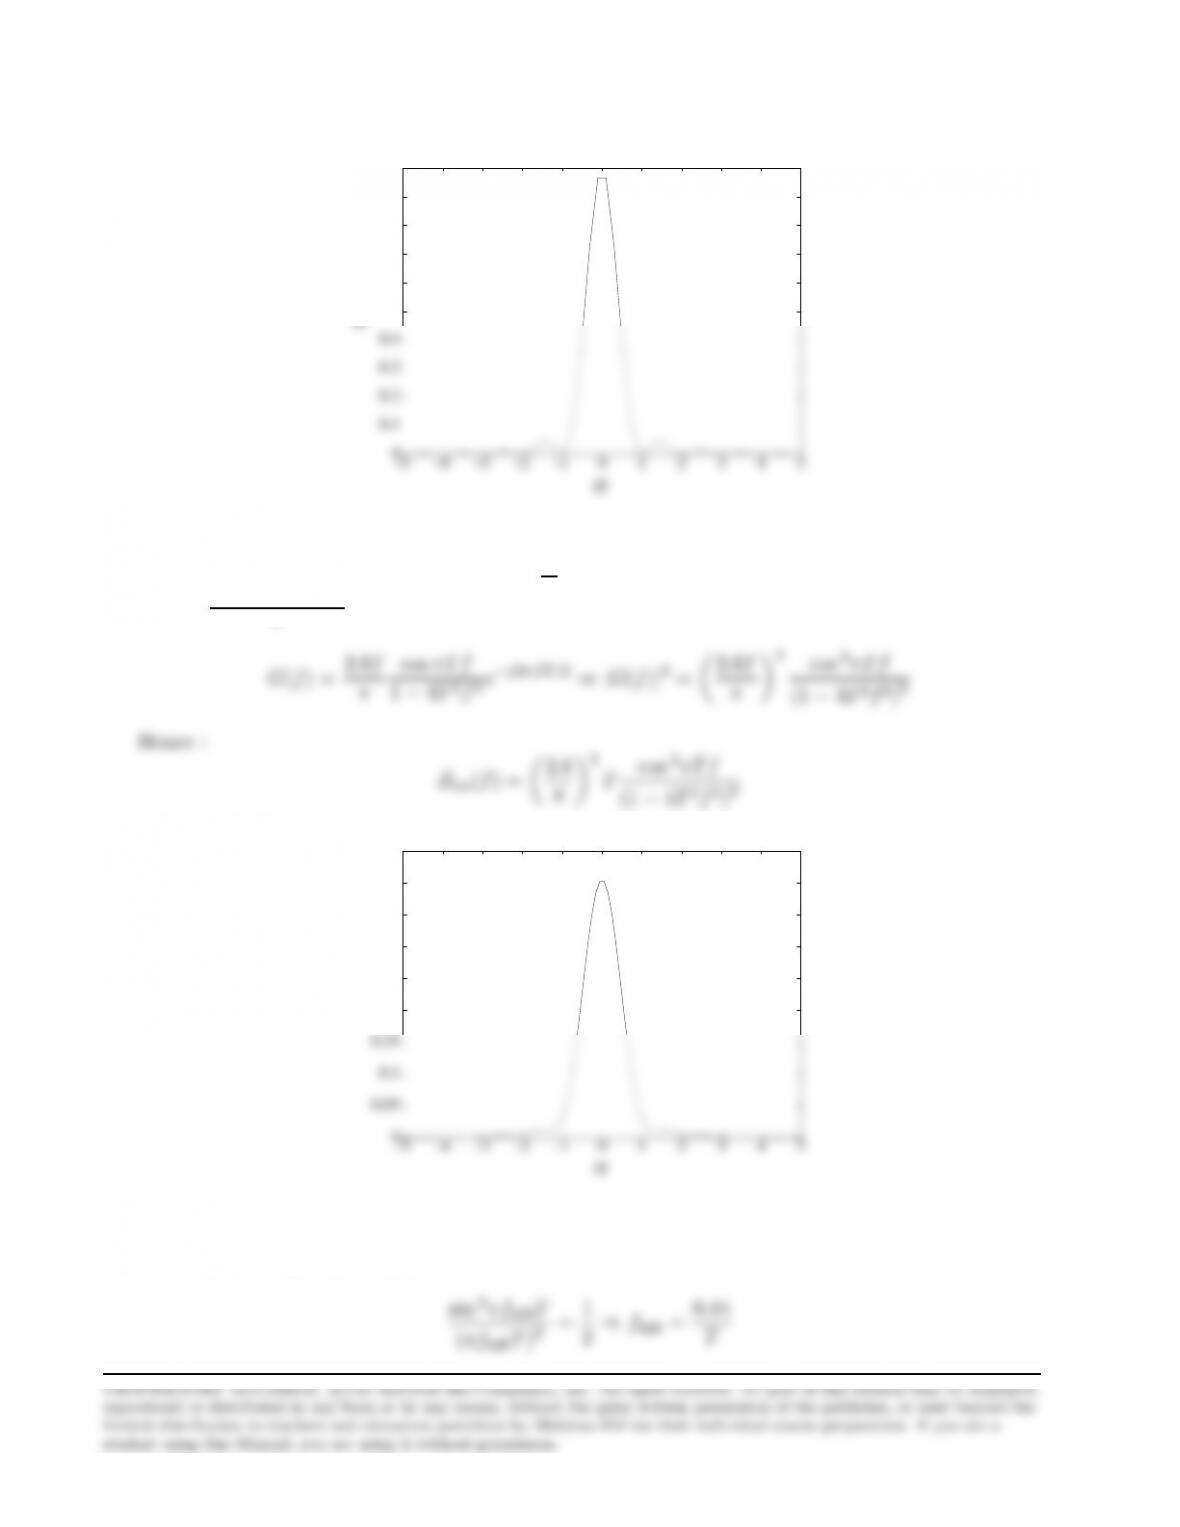
1. For the rectangular pulse :
G(f) = AT sin πfT
πf T e−j2πf T/2⇒ |G(f)|2=A2T2sin 2πf T
(πf T )2
9
0
0.1
0.2
0.3
0.4
0.5
0.6
0.7
0.8
0.9
1
-5 -4 -3 -2 -1 0 1 2 3 4 5
fT
Sv(f)
2. For the sinusoidal pulse : G(f) = RT
0sin πt
Texp(−j2πft)dt. By using the trigonometric identity
sin x=exp(jx)−exp(−jx)
2jit is easily shown that :
cos πT f
0
0.05
0.1
3. The 3-db frequency for (a) is :
10
(where this solution is obtained graphically), while the 3-db frequency for the sinusoidal pulse on
Problem 3.14
1. Bn=In+In−1.Hence :
InIn−1Bn
1 1 2
2.
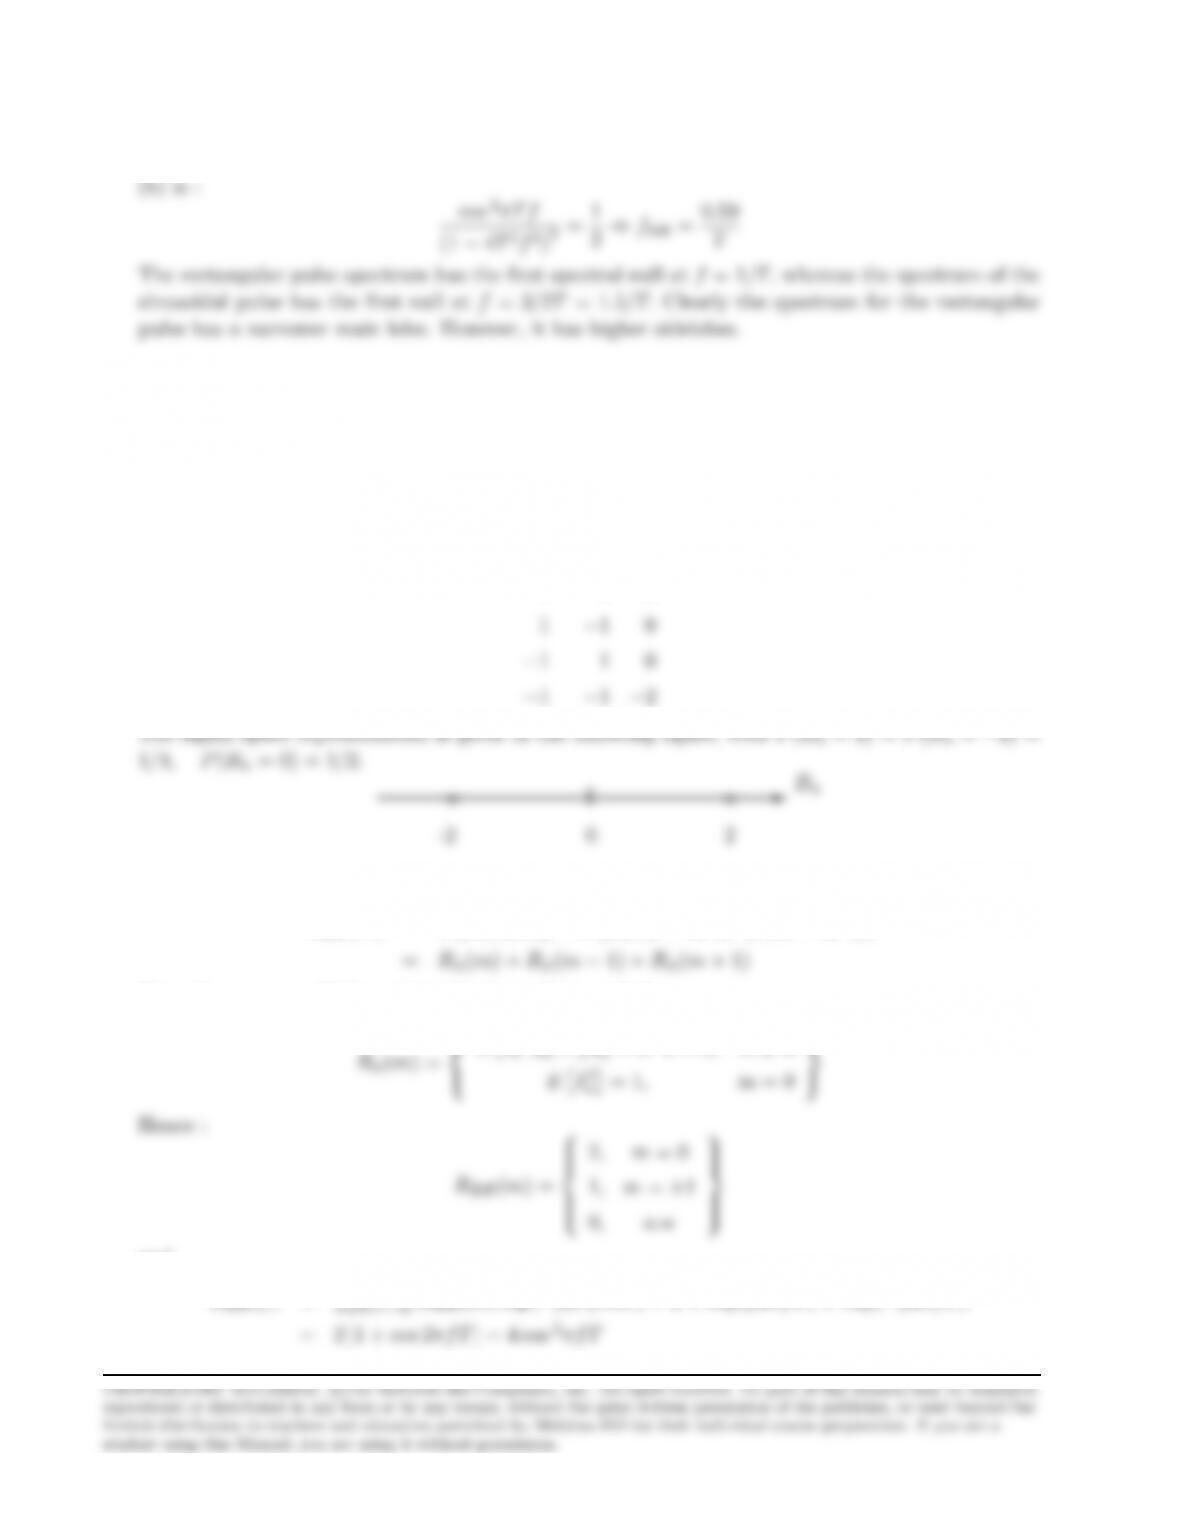
RBB (m) = E[Bn+mBn] = E[(In+m+In+m−1) (In+In−1)]
Since the sequence {In}consists of independent symbols :
E[In+m]E[In] = 0 ·0 = 0,m6= 0
0,o.w
and
SBB (f) = P∞
11
A plot of the power spectral density SB(f) is given in the following figure :
−0.5 −0.4 −0.3 −0.2 −0.1 0 0.1 0.2 0.3 0.4 0.5
0
0.5
1
1.5
2
2.5
3
3.5
4
4.5
5
Normalized frequency fT
Power spectral density of B
3. The transition matrix is :
In−1InBnIn+1 Bn+1
−1−1−2−1−2
−1−1−2 1 0
−1 1 0 −1 0
The corresponding Markov chain model is illustrated in the following figure :
★✥
★✥ ✧✦
★✥
❅
❅❘
✠ ❅
❅
❅
❅■
✒
❅
❅
✛
❄
1/2
1/2
1/2
1/2
1/2
Problem 3.15
1. In=an−an−2,with the sequence {an}being uncorrelated random variables (i.e E(an+man) =

12
δ(m)). Hence :
Rii(m) = E[In+mIn] = E[(an+m−an+m−2) (an−an−2)]
0,o.w.
2. Suu(f) = 1
T|G(f)|2Sii(f) where :
Sii(f) = P∞
and
|G(f)|2= (AT )2sin πfT
πf T 2
πf T 2
3. If {an}takes the values (0,1) with equal probability then E(an) = 1/2 and E(an+man) =
1/2,m = 0
Rii(m) = E[In+mIn] = 2Raa(0) −Raa(2) −Raa(−2)
and
Sii(f) = P∞
Problem 3.16
We may use the result in (3.4.27), where we set K= 2, p1=p2= 1/2 :
∞
X
2
X
1
2
2
X
1
1

13
To simplify the computations we may define the signals over the symmetric interval −T /2≤t≤
(the well-known rectangular pulse spectrum, modulated by sin 2πfit) and :
|Si(f)|2=T
22“sin π(f−fi)T
π(f−fi)T2
+sin π(f+fi)T
π(f+fi)T2#
where the cross-term involving the product sin π(f−fi)T
π(f−fi)T·sin π(f+fi)T
π(f+fi)Tis negligible when fi>> 0.Also
and similarly for S2(l
T) (with minstead of n).Note that if n(m) is even then S1(2)(l
T) = 0 for all l
except at l=±n(m)/2,where S1(2)(n(m)
2T) = ±T
2j.For this case
∞
X
l=−∞
2
X
i=1
2
The third term in (3.4.27) involves the product of S1(f) and S2(f) which is negligible since they
have little spectral overlap. Hence :
In comparison with the spectrum of the MSK signal, we note that this signal has impulses in the
spectrum.
Problem 3.17
MFSK signal with waveforms : si(t) = sin 2πit
T, i = 1,2, ..., M 0≤t≤T
The expression for the power density spectrum is given by (3.4.27) with K=Mand pi= 1/M.
From Problem 4.23 we have that :

14
for a signal si(t) shifted to the left by T/2 (which does not affect the power spectrum). We also
have that :
±T/2j, n =±i
0,o.w.
Hence from (3.4.27) we obtain :
S(f) = 1
T21
M2T2
4PM
i=1 [δ(f−fi) + δ(f+fi)]
=1
Problem 3.18
QPRS signal v(t) = Pn(Bn+jCn)u(t−nT ), Bn=In+In−1, Cn=Jn+Jn−1.
1. Similarly to Problem 3.11, the sequence Bncan take the values : P(Bn= 2) = P(Bn=
independent :
P{Bn=i, Cn=j}=P{Bn= 1}P{Cn=j}
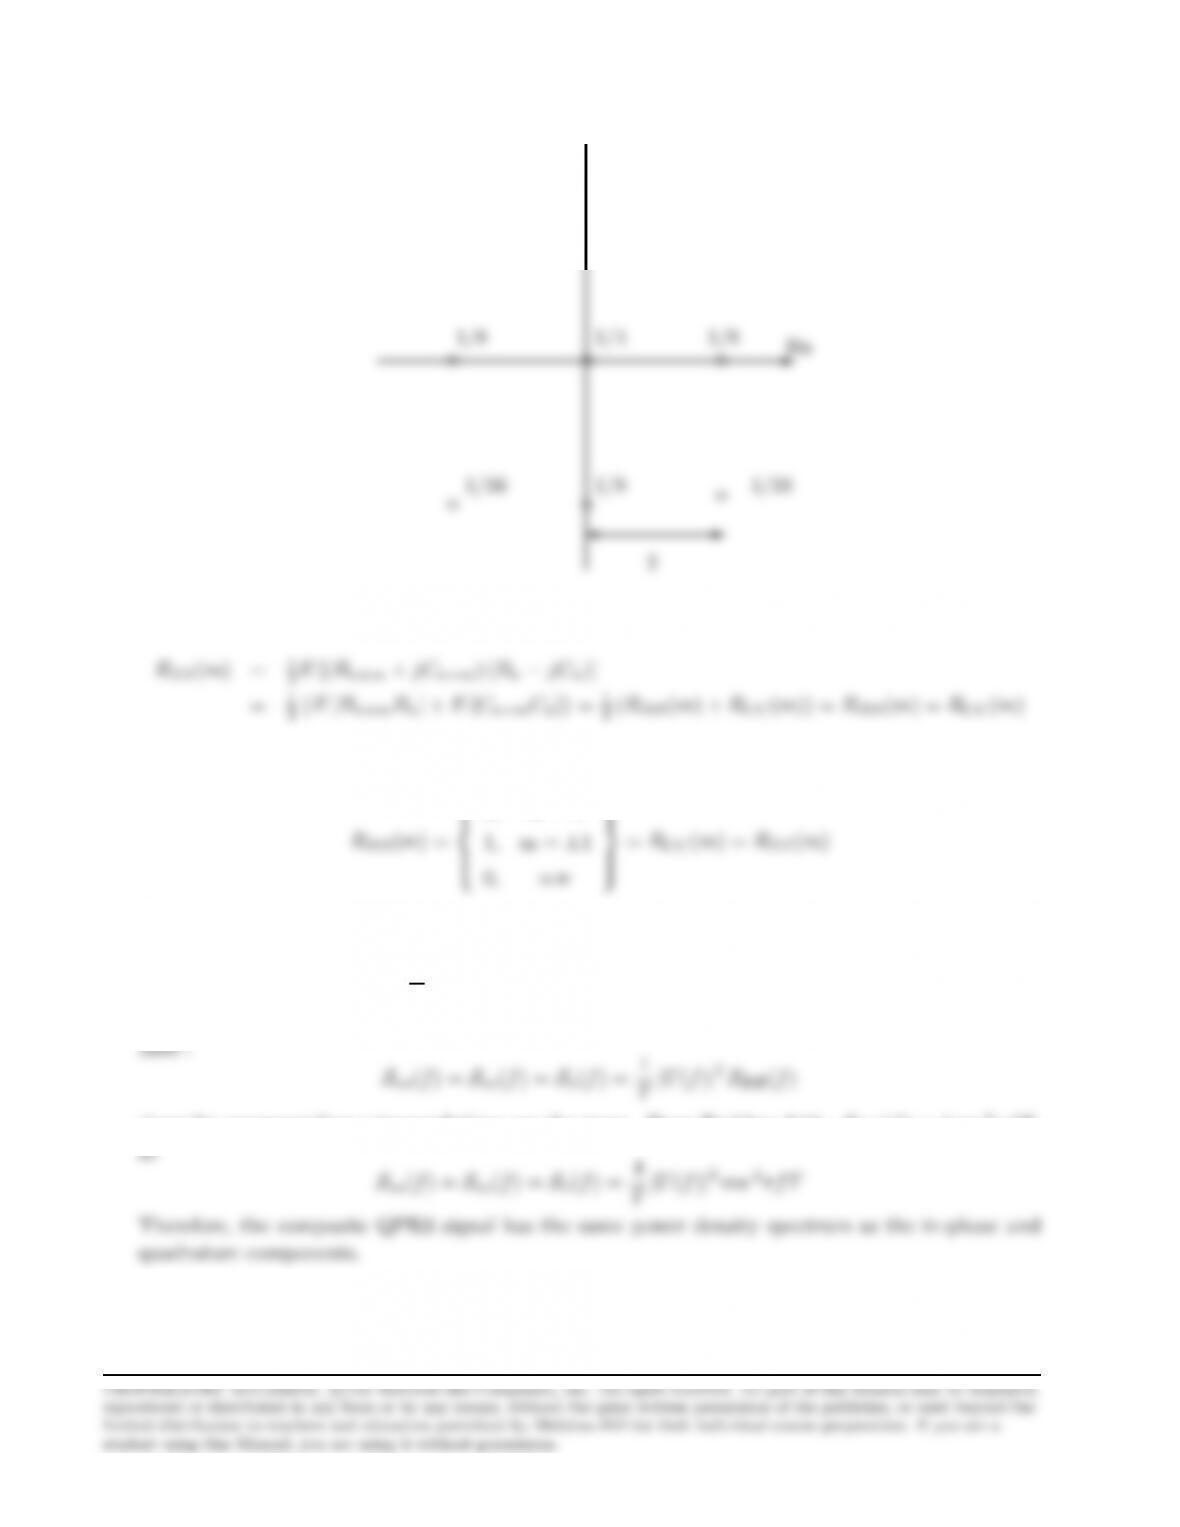
15
✻
oo
Cn
1/16
1/16
o1/8
2. If we name Zn=Bn+jCn:
since the sequences Bn, Cnare independent, and have the same statistics. Now, from Problem 3.11
:
2,m = 0
Hence, from (4-4-11) :
Rvs(τ) = 1
T
∞
X
m=−∞
RBB (m)Ruu(τ−mT ) = Rvc(τ) = Rv(τ)
since the corresponding autocorrelations are the same . From Problem 3.11 : SBB (f) = 4 cos 2πfT ,
3. The transition probabilities for the Bn, Cnsequences are independent, so the probability of
a transition between one state of the QPRS signal to another state, will be the product of the
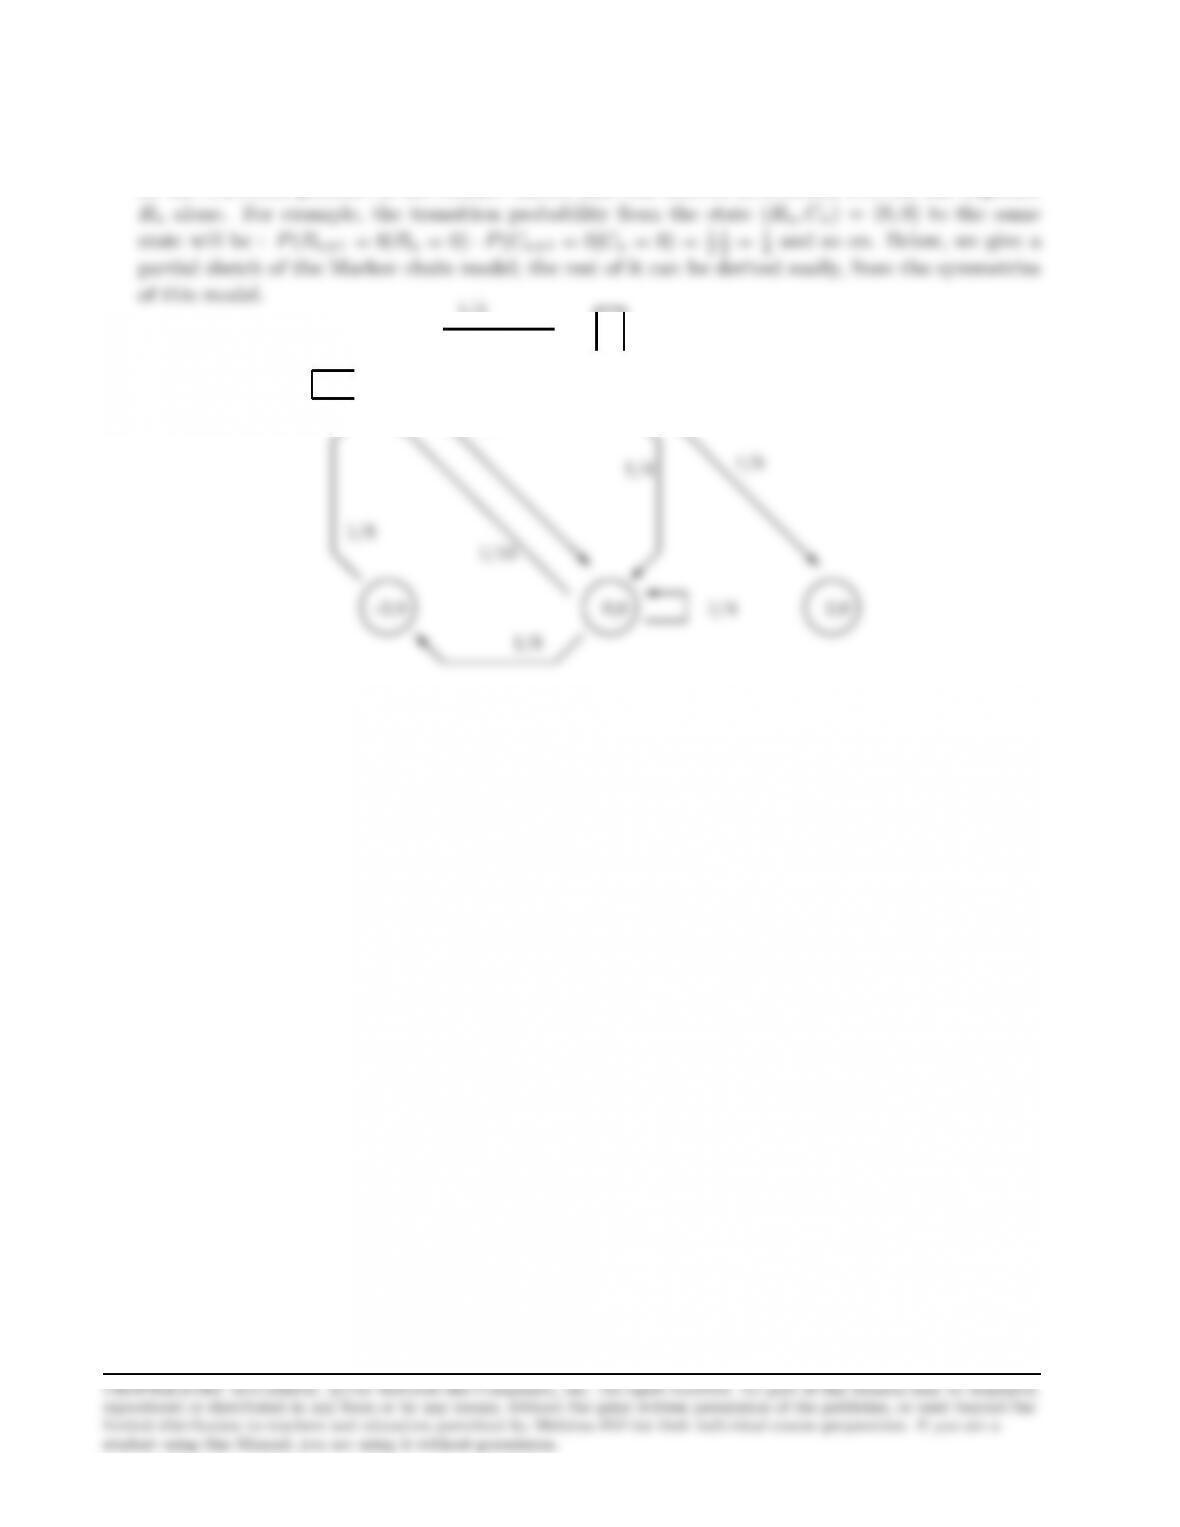
16
probabilities of the respective B-transition and C-transition. Hence, the Markov chain model will
be the Cartesian product of the Markov model that was derived in Problem 3.11 for the sequence
✚✙
✛✘ ✚✙
✛✘
✚✙
✛✘
✚✙
✛✘ ✚✙
✛✘ ✚✙
✛✘
❅
❅❘
✲
❄
❅❅❅❅❅❅❅❅
❅
❅
❅
❅
❅
❅
✒ ■❅❅❅❅❅❅❅❅
0,-2 2,-2
1/4
1/4
1/16
1/4
1/4
-2,-2
-2,2 0,2 2,2
Problem 3.19