23
CHAPTER 4
4.1
a1 =
RT
=
( . )(14 1716)(520)
Hence:
( . )(14 1718)(766)
24
2
2
2
2
2 2
4.2
Mn1
o o
2 1
4.3 From the –-M diagram, at M1 = 3, max = 34.1 and = 66. Hence, the wedge can be
no larger than a half-angle of 34.1.
Mn1
4.4
p
p
2
1
= 5. From Table A.2,
Mn1
= 2.2,
Mn1
= M1 sin . Thus,
4.5 From the –-M diagram, = 38
4.7
From the –-M diagram: For M1 = 2.8 and = 30, 1 = 11,
Mn1
= M1 sin 30 = 2.8 (0.5) – 1.4
From Table A.2:
Mn2
= 1.4: p2/p1 = 2.12, T2/T1= 1.255,
p p
o o
2 1
/
= 0.9582,
Mn2
= 0.7297
Mn2
Mn2
07397
.
Mn2
Mn2
/
From Table A.1 for M1 = 2.8,
po1
/p1 = 27.14
p
o
3
p
o
2
p
o1
p
o
2
p
28
From Table A.2, for M2 = 2.139,
p
p
o
o
3
2
= 0.6557
po3
=
p
p
o
o
3
2
p
p
o
o
2
1
p
p
o1
1
p1 = (0.6557)(0.4715)(151.8)(1)
po3
= 46.93 atm
Note that the total pressure in case (b) is higher than case (a), indicating a more efficient shock
compression to subsonic flow for case (b). The upstream total pressure is
po1
= (151.8)(1) =
151.8 atm.
For case (a) the loss is total pressure = 151.8 – 21.07 atm = 130.7 atm.
4.9 From the –-M diagram, and Figure 4.22: For 2 = 20 and M1 = 3, = 37.8.
Mn1
= M1 = sin = (3 ) sin (37.8) = 1.839;
p
p
2
1
= 3.783
M
Sin
n2
( )
−
06078
37 820
.
( . )Sin −
For 3 = 15 and M1 = 3, = 32.2
Mn1
p
3
29
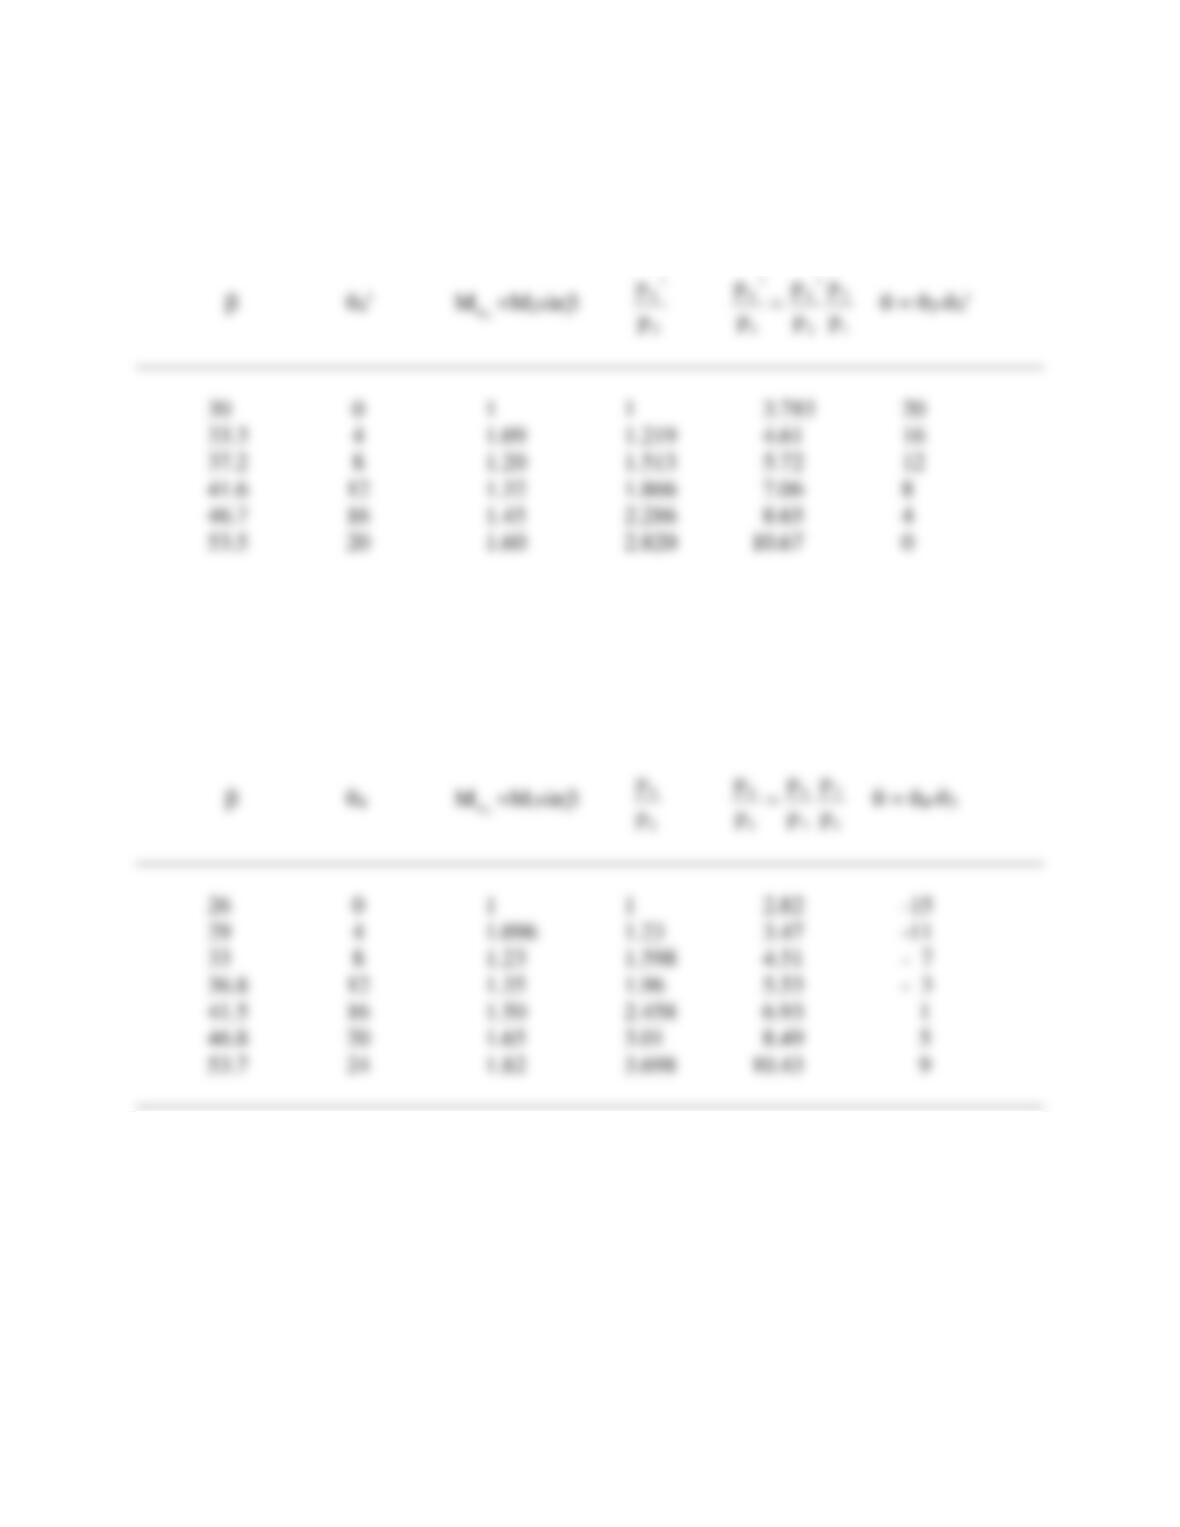
For the upstream flow represented by region 2, plot a pressure deflection diagram from the
following calculations:
p
4
‘
p
p
p
4
4
2
‘ ‘
For the upstream flow represented by region 3, plot a pressure deflection diagram from the
following calculations:
p
4
p
p
p
4
4
3
From the graph above,
p
p
4
1
= 4.5
4.10 From Table A.5, for M1 = 2, 1 = 26.38, 2 = 1 + = 26.38 + 30 = 56.38
From Table A.5: M2 = 3.37
To =
To1
=
To2
= const; po =
po1
=
po2
= const.
p2 =
p
poM
2
2
p
p
o
M
11
p1
Using Table A.1:
31
1
ToM
2
T
M
11
Again using Table A.1:
po2
po1
p
o1
1
p
1
4.11 From Table A.1, for M1 = 3,
p
p
o1
1
= 36.73. Since
po2
=
po1
, then
p
p
p
p
p
p
o o
2 1
2 1
1
2
=
= (36.73)
1
0 4.
= 91.83
p
o2
32
4.12 From Table A.5, for M1 = 4, 1 = 65.78
2 = 1 + = 65.78 + 15 = 80.78
From Table A.5, M2 = 5.44.
p
o1

33
Note that, although the flow directions in regions 1 and 3 are the same, the properties in region 3
are different than in region 1 due to the losses (entropy increase) across the shock wave.
4.13
4.14 From the –-M diagram, for M1 = 3 and = 20, = 37.5
Mn1
= M1 sin = (3) sin 37.5 = 1.83
p
p
o
o
2
1