
IB-1
Business Statistics: Part I: Exploring and Collecting Data – Test B
Name___________________________________________________
Chapter 1: Identify various aspects of studies and experiments and/or classify variables.
1. The U.S. Bureau of Labor Statistics (BLS) compiles data on a number of variables.
Which of the following BLS variables is categorical?
A. Consumer expenditures
B. Type of workplace injuries
C. Wages by occupation
D. Employment costs
E. Productivity by industry
Chapter 1: Identify various aspects of studies and experiments and/or classify variables.
2. What scale of measurement is type of workplace injuries (slip and fall, stress related,
etc.)?
A. Quantitative
B. Interval
C. Nominal
D. Ordinal
E. Numerical
Chapter 1: Determine whether data are a time series or are cross‐sectional.
3. The U.S. Bureau of Labor Statistics publishes the monthly CPI (consumer price
index). This index shows the change in prices paid by urban consumers for a market
basket of goods and services. These data are
A. Cross-sectional
B. Nominal
C. Categorical
D. Time Series
E. Ordinal
IB-2 Part I: Exploring and Collecting Data
Chapter 4: Make a scatterplot to display the relationship between two quantitative
variables.
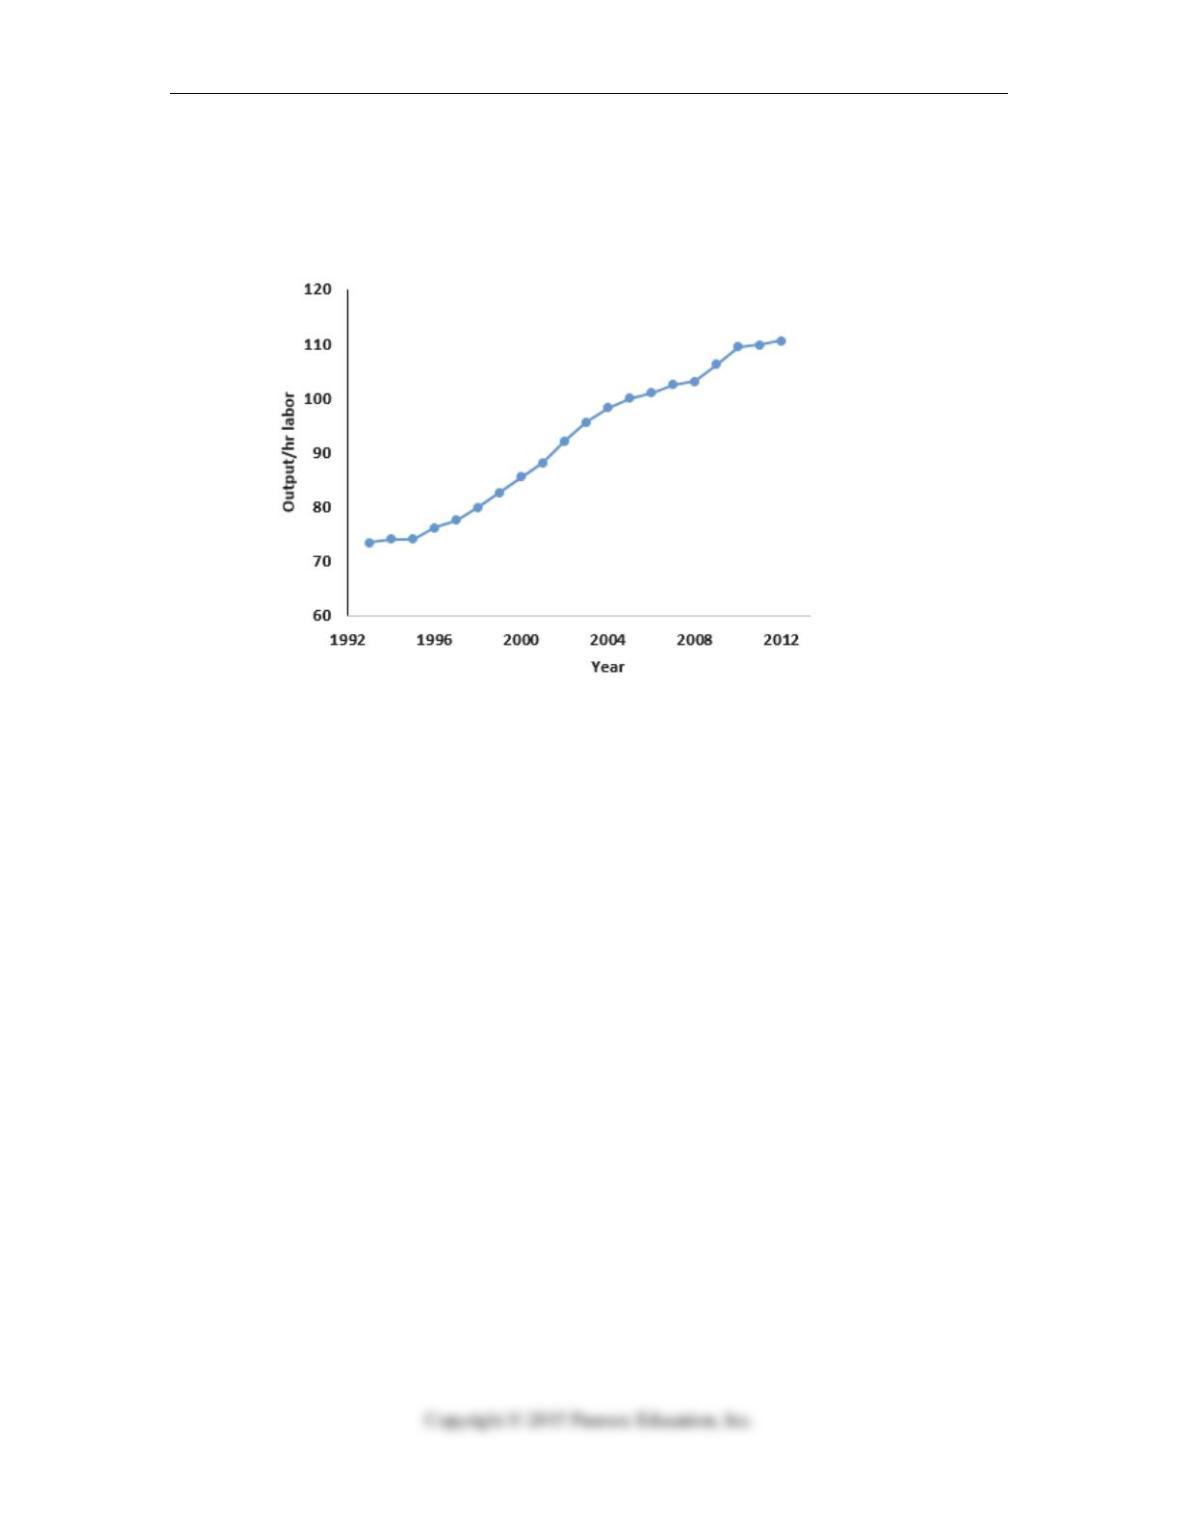
4. The following scatterplot shows output/hour labor and years. The graphical display is
an example of what type of data?
A. Cross-sectional
B. Nominal
C. Categorical
D. Time Series
E. Ordinal
Test B IB-3
Chapter 4: Examine the residuals from a linear model to assess the quality of the model.
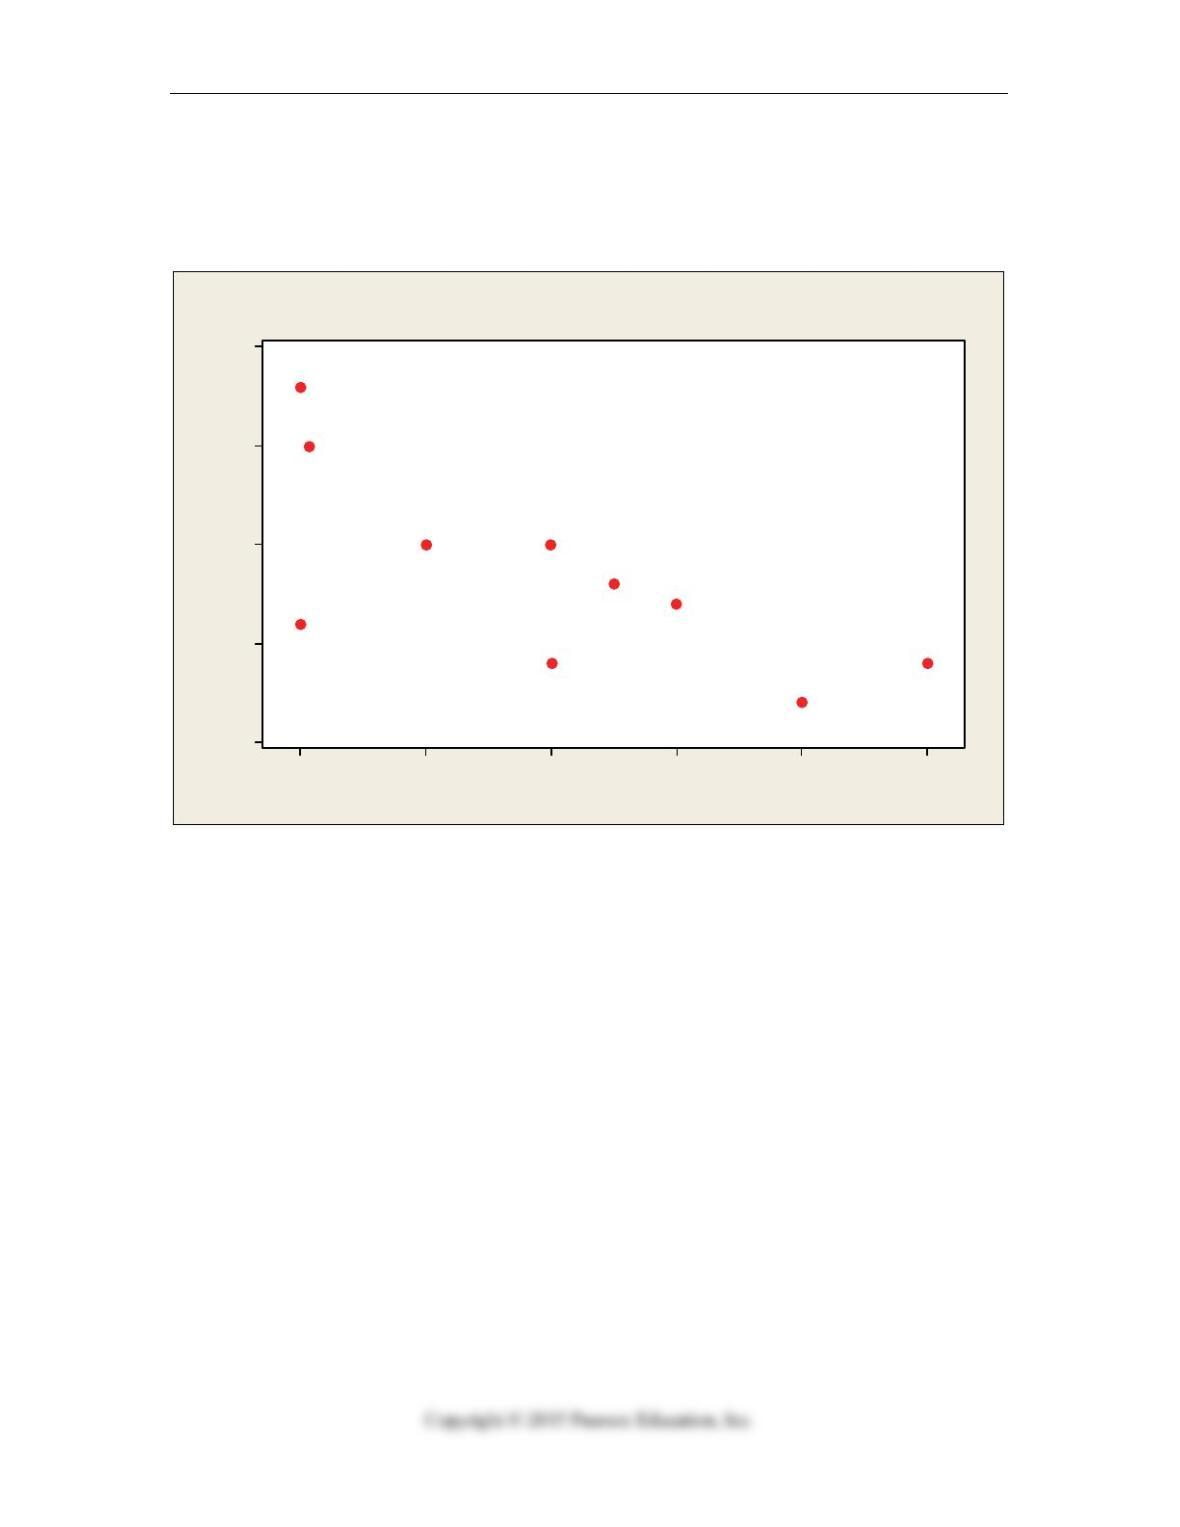
5. A consumer research group investigating the relationship between the price of meat
(per pound) and the fat content (grams) gathered data that produced the following
scatterplot. The residual of the point ($2.00 per pound, 6 grams of fat) is
12108642
20
15
10
5
0
Price/lb
Fa t Gr a ms
Scatterplot of Fat Grams vs Price/lb
A. A large positive value
B. A large negative value
C. Affecting the correlation of the variables
D. Both B and C
E. Both A and C
IB-4 Part I: Exploring and Collecting Data
Chapter 4: Make a scatterplot to display the relationship between two quantitative
variables.
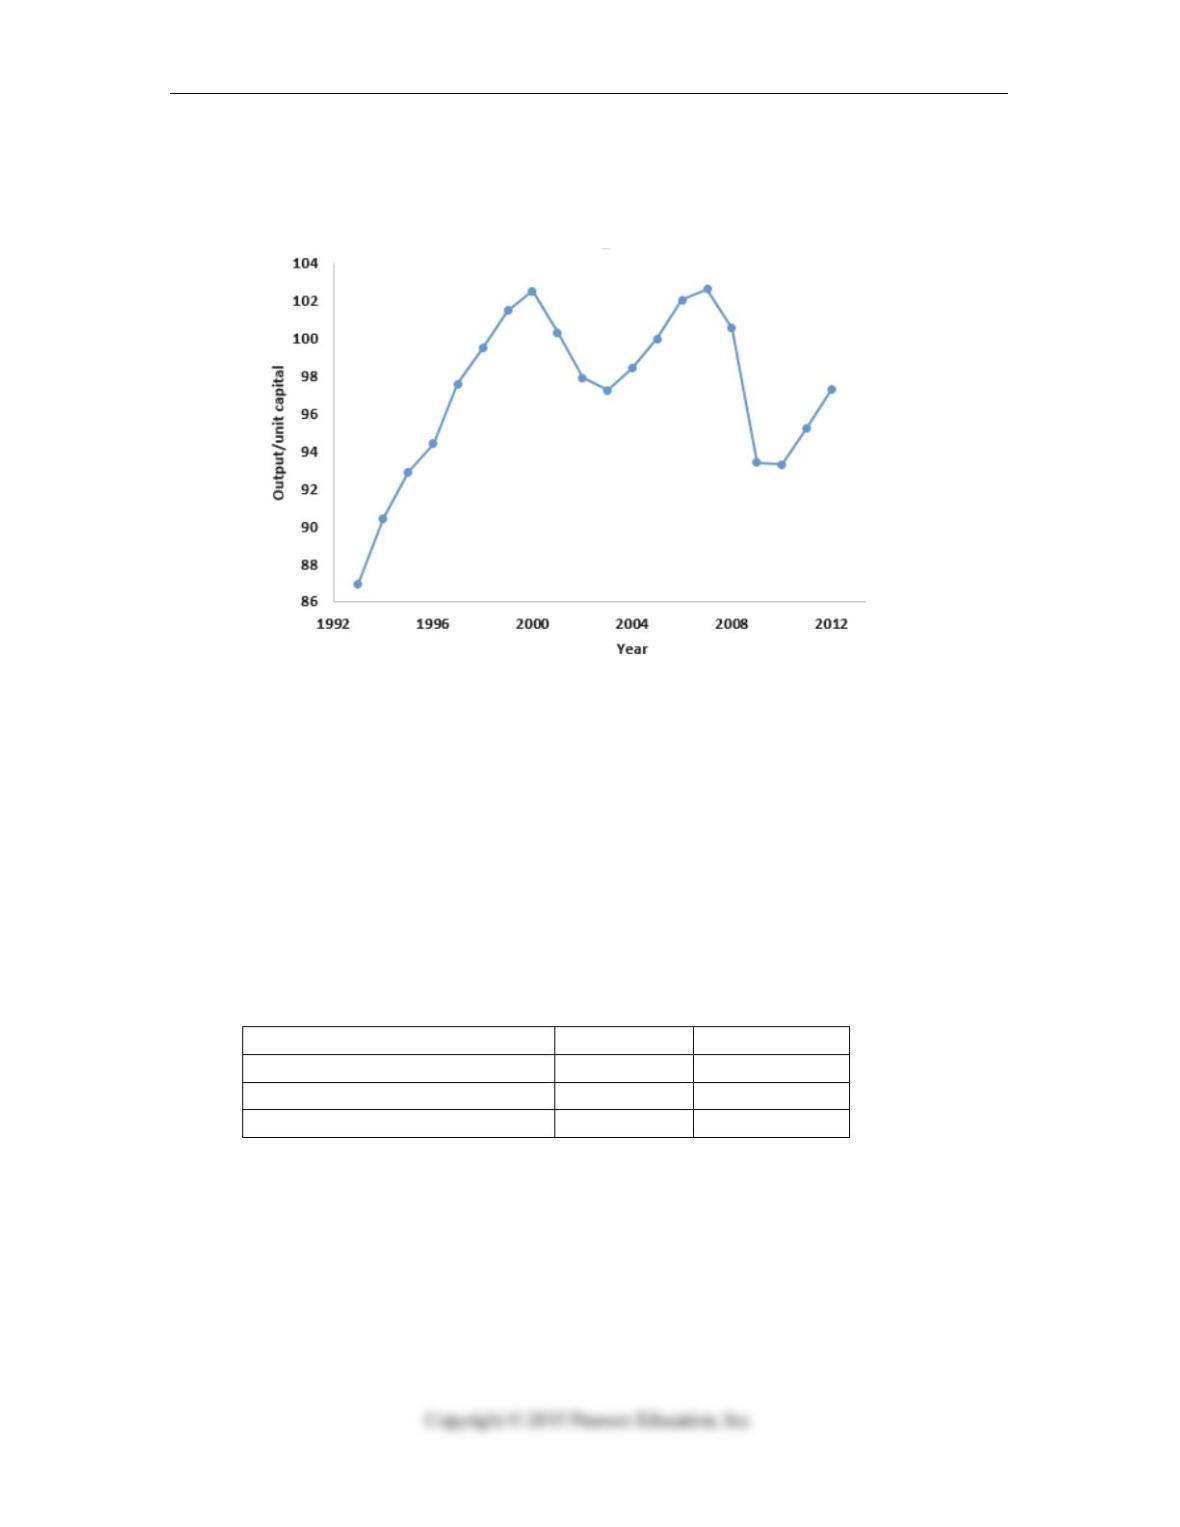
6. The following scatterplot shows output/unit capital and years. The data show
A. There is no consistent increasing or decreasing over time.
B. There is no evidence of a seasonal component.
C. There is some evidence of a cyclical component.
D. There is no linear trend over the time period.
E. All of the above.
Chapter 2: Find conditional and marginal distributions and make comparisons.
7. A recent survey of online shoppers asked them to indicate the primary reason they
shop via the Internet. The table summarizes responses by reason and gender. What
percent of respondents cite Convenience as the primary reason they shop online?
Reason for Shopping Online Male Female
Convenience 249 90
Better Prices 110 99
Greater Selection 41 211
A. 42%
B. 23%
C. 62%
D. 85%
E. 33%
Test B IB-5
Chapter 2: Find conditional and marginal distributions and make comparisons.
8. A recent survey of online shoppers asked them to indicate the primary reason they
shop via the Internet. The table summarizes responses by reason and gender. What
percent of males cite Convenience as the primary reason they shop online?
Reason for Shopping Online Male Female
Convenience 249 90
Better Prices 110 99
Greater Selection 41 211
A. 42%
B. 73%
C. 62%
D. 31%
E. 50%
Chapter 2: Find conditional and marginal distributions and make comparisons.
9. A recent survey of online shoppers asked them to indicate the primary reason they
shop via the Internet. The table summarizes responses by reason and gender. What
percent of respondents who cited Greater Selection as the primary reason they shop
online were females?
Reason for Shopping Online Male Female
Convenience 249 90
Better Prices 110 99
Greater Selection 41 211
A. 53%
B. 27%
C. 50%
D. 84%
E. 42%
IB-6 Part I: Exploring and Collecting Data
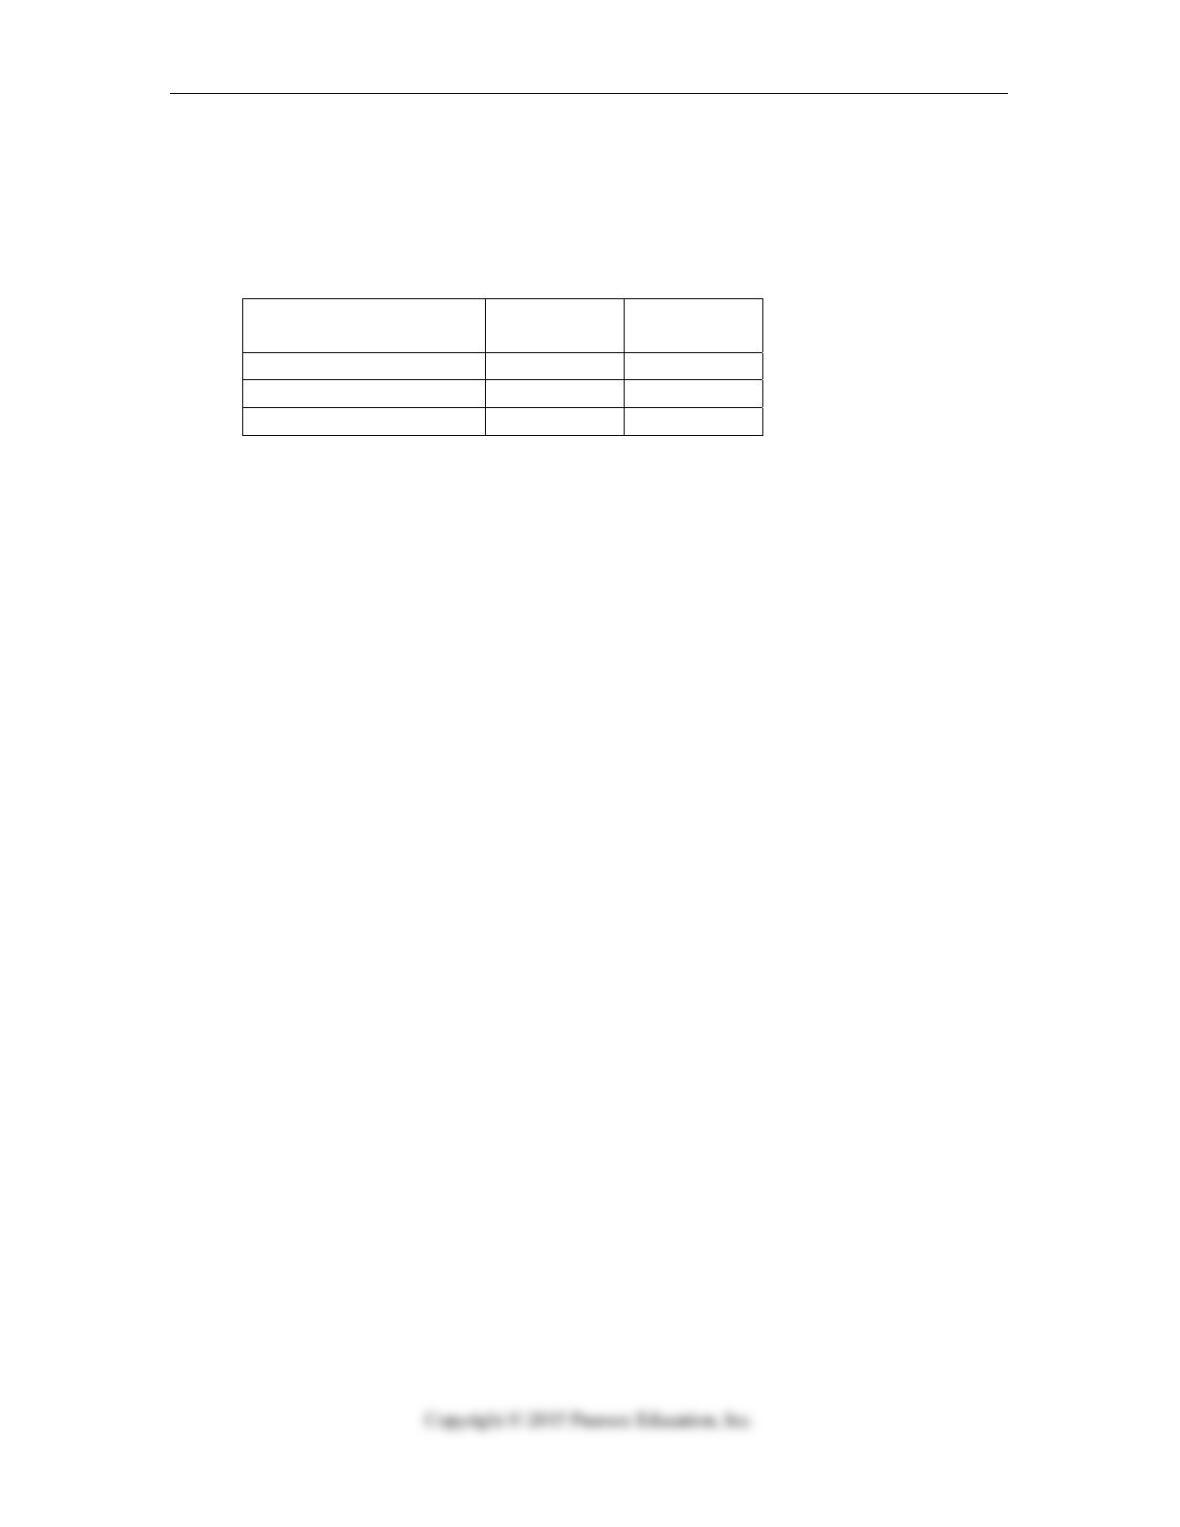
Chapter 2: Determine if a display of data is appropriate.
10. A government agency has 6000 employees. As an alternative to the traditional five
day work week, employees were asked whether they preferred a four day work week (10
hours per day) or flexible hours. The table below shows the results by age category.
The most appropriate display for these data is a
Age Category Prefers 4
Day Week
Prefers
Flex Hours
Under 30 600 300
30 – 45 1200 1500
Over 45 2100 300
A. histogram.
B. stem and leaf display.
C. boxplot.
D. segmented bar chart.
E. frequency table.
Test B IB-7
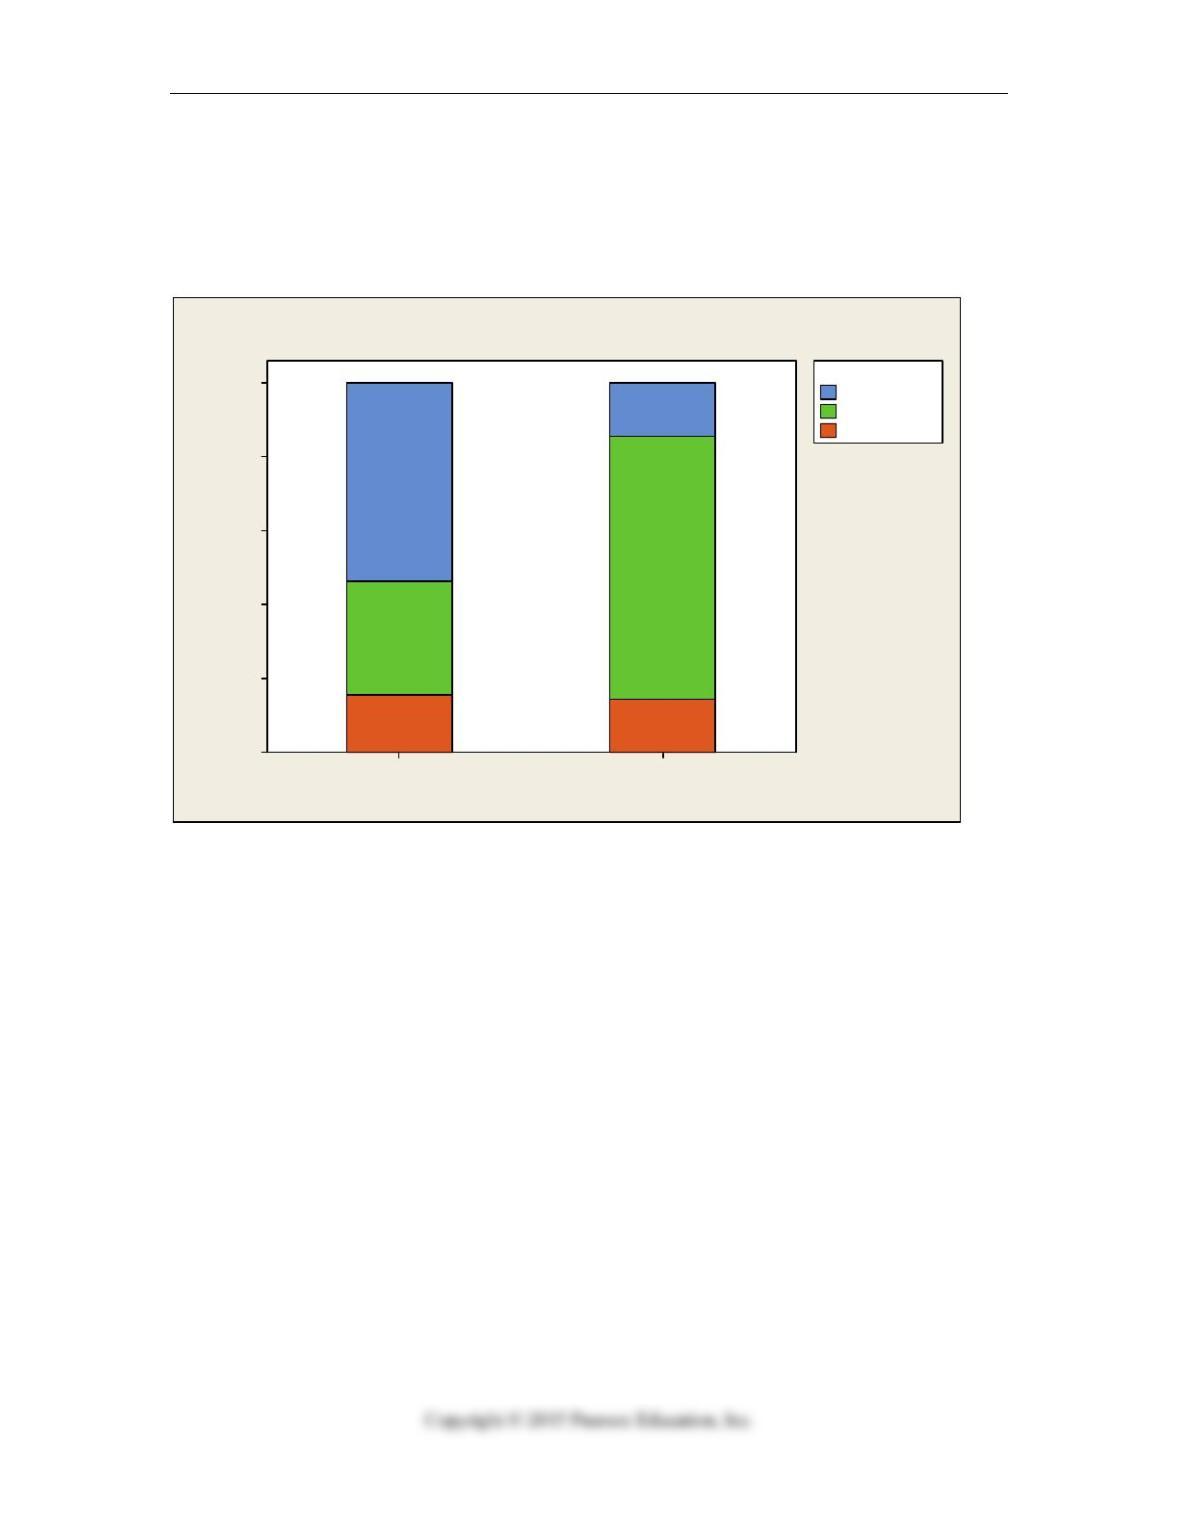
Chapter 2: Determine if a display of data is appropriate.
11. A government agency has 6000 employees. As an alternative to the traditional five
day work week, employees were asked whether they preferred a four day work week (10
hours per day) or flexible hours. The segmented bar chart below is based on the data
collected. Which of the following statements is true about work week preferences and
age category?
Prefers Flex HoursPrefers 4 Day Week
100
80
60
40
20
0
Data
Over 45
30 – 45
Under 30
Age Category
Preferences by Age Category
Percent within variables.
A. A greater percentage of employees who prefer a 4 day work week are in the over
45 age category compared to those who prefer flex hours.
B. A greater percentage of employees who prefer flex hours are in the over 45 age
category compared to those who prefer a 4 day work week.
C. Preferences appear to be independent of age.
D. The distribution of preferences are the same across different age groups.
E. The segmented bar chart is not appropriate for these data.
Chapter 3: Find summary statistics; create displays; describe distributions; determine
appropriate measures.
12. A customer service center keeps track of the number of complaints received each day
about one of their new products. The numbers of complaints received over the last 11
day period are 19, 18, 22, 21, 17, 18, 22, 19, 16, 23, and 25. The median for this sample
of data is
A. 22.
B. 20.
C. 19.
D. 17.
E. 16.

IB-8 Part I: Exploring and Collecting Data
Chapter 3: Find summary statistics; create displays; describe distributions; determine
appropriate measures.
13. A customer service center keeps track of the number of complaints received each day
about one of their new products. The numbers of complaints received over the last 11
day period are 19, 18, 22, 21, 17, 18, 22, 19, 16, 23, and 25. The IQR for this sample of
data is
A. 25.
B. 22.
C. 18.
D. 9.
E. 4.
Chapter 3: Find summary statistics; create displays; describe distributions; determine
appropriate measures.
14. A customer service center keeps track of the number of complaints received each day
about one of their new products. The numbers of complaints received over the last 11
day period are 19, 18, 22, 21, 17, 18, 22, 19, 16, 23, and 25. The standard deviation for
this sample of data is
A. 0.842.
B. 2.794.
C. 1.845.
D. 0.569.
E. None of the above.
Test B IB-9
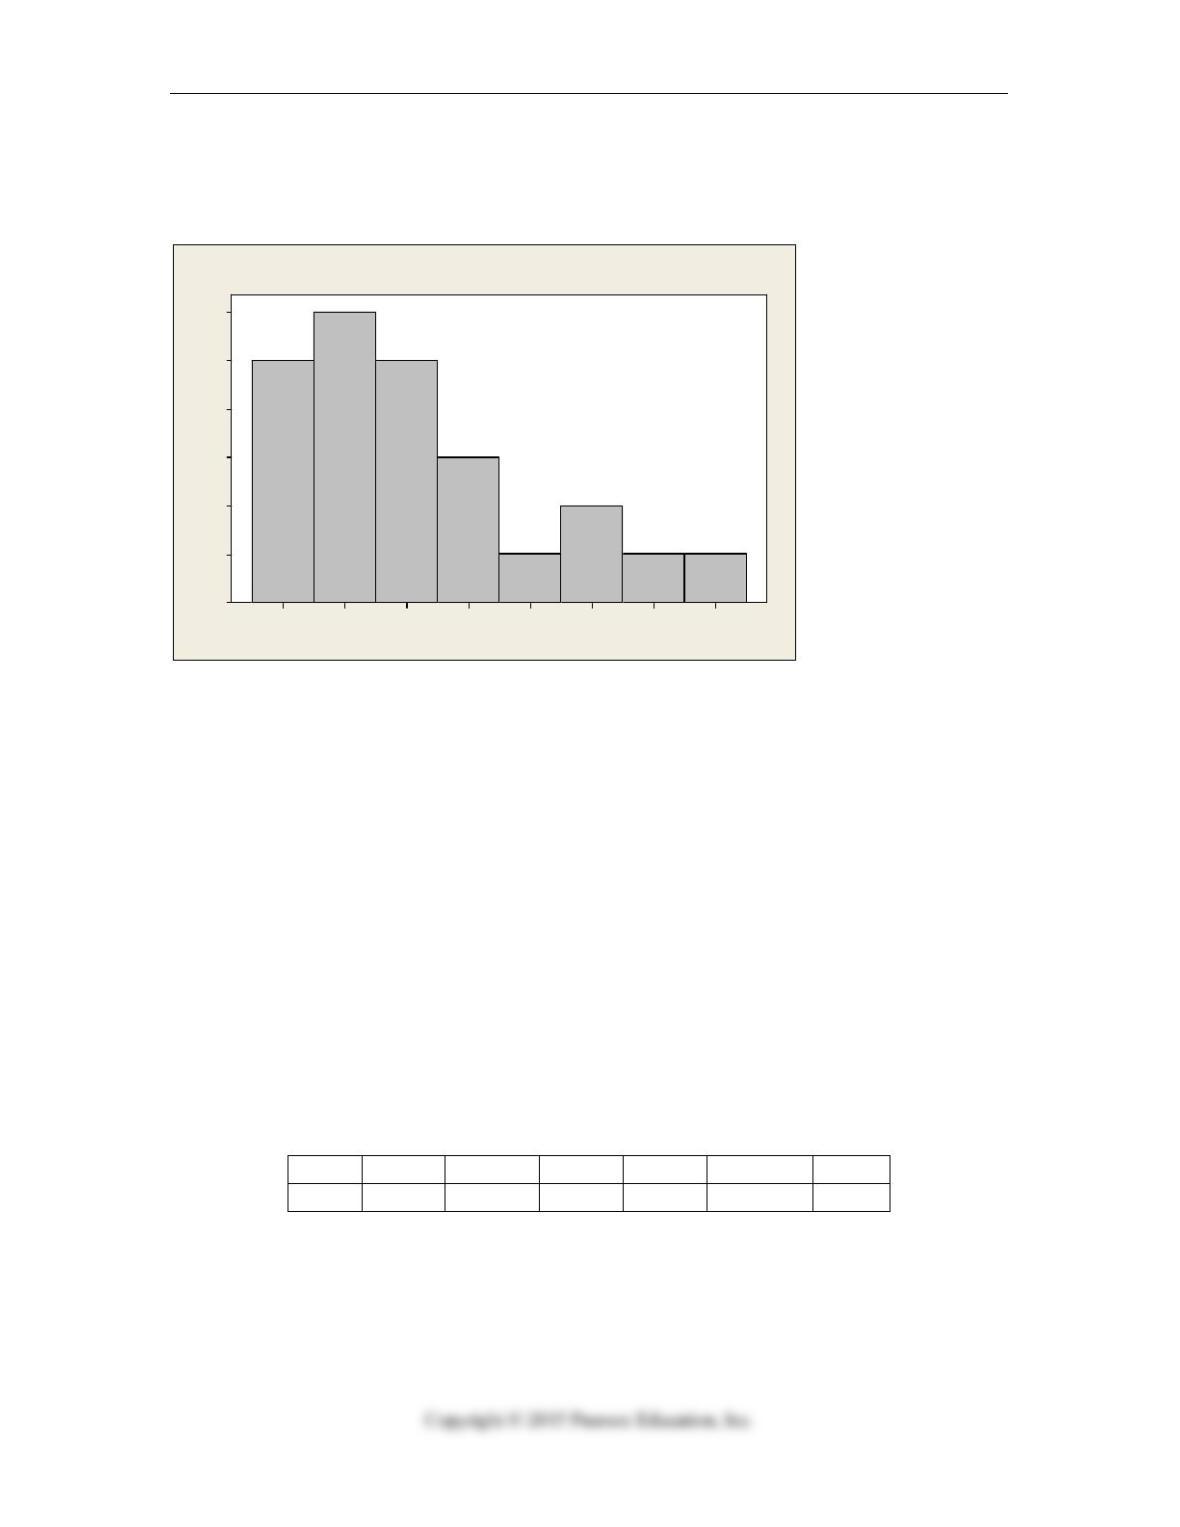
Chapter 3: Find summary statistics; create displays; describe distributions; determine
appropriate measures.
15. Which is true for the data shown in the histogram?
6055504540353025
6
5
4
3
2
1
0
Dat a
Frequency
Histogram of Data
I. The distribution is skewed to the right.
II. The mean is probably smaller than the median.
III. It is appropriate to summarize these data with the mean and standard
deviation.
A. I only
B. II only
C. I and II
D. I and III
E. I, II and III
Chapter 3: Find summary statistics; create displays; describe distributions; determine
appropriate measures.
16. A recent report evaluated the price and performance of 25 models of smartphones.
Computer output gives the summary statistics for the prices ($) shown in the table. Based
on these results, which of the following is true?
A. The distribution is symmetric.
B. The distribution is skewed to the right.
C. The distribution is skewed to the left.
D. The mean is a better measure of center for these data than the median.
E. The standard deviation is larger than the range.
Min Q1 Median Q3 Max Mean SD
50 85 108 227 550 120.75 42.08
IB-10 Part I: Exploring and Collecting Data
Chapter 3: Find summary statistics; create displays; describe distributions; determine
appropriate measures.
17. A recent report evaluated the price and performance of 25 models of smartphones.
Computer output gives the summary statistics for the prices ($) shown in the table.
The IQR for these data is
A. $ 142
B. $ 58
C. $ 323
D. $ 442
E. $ 500
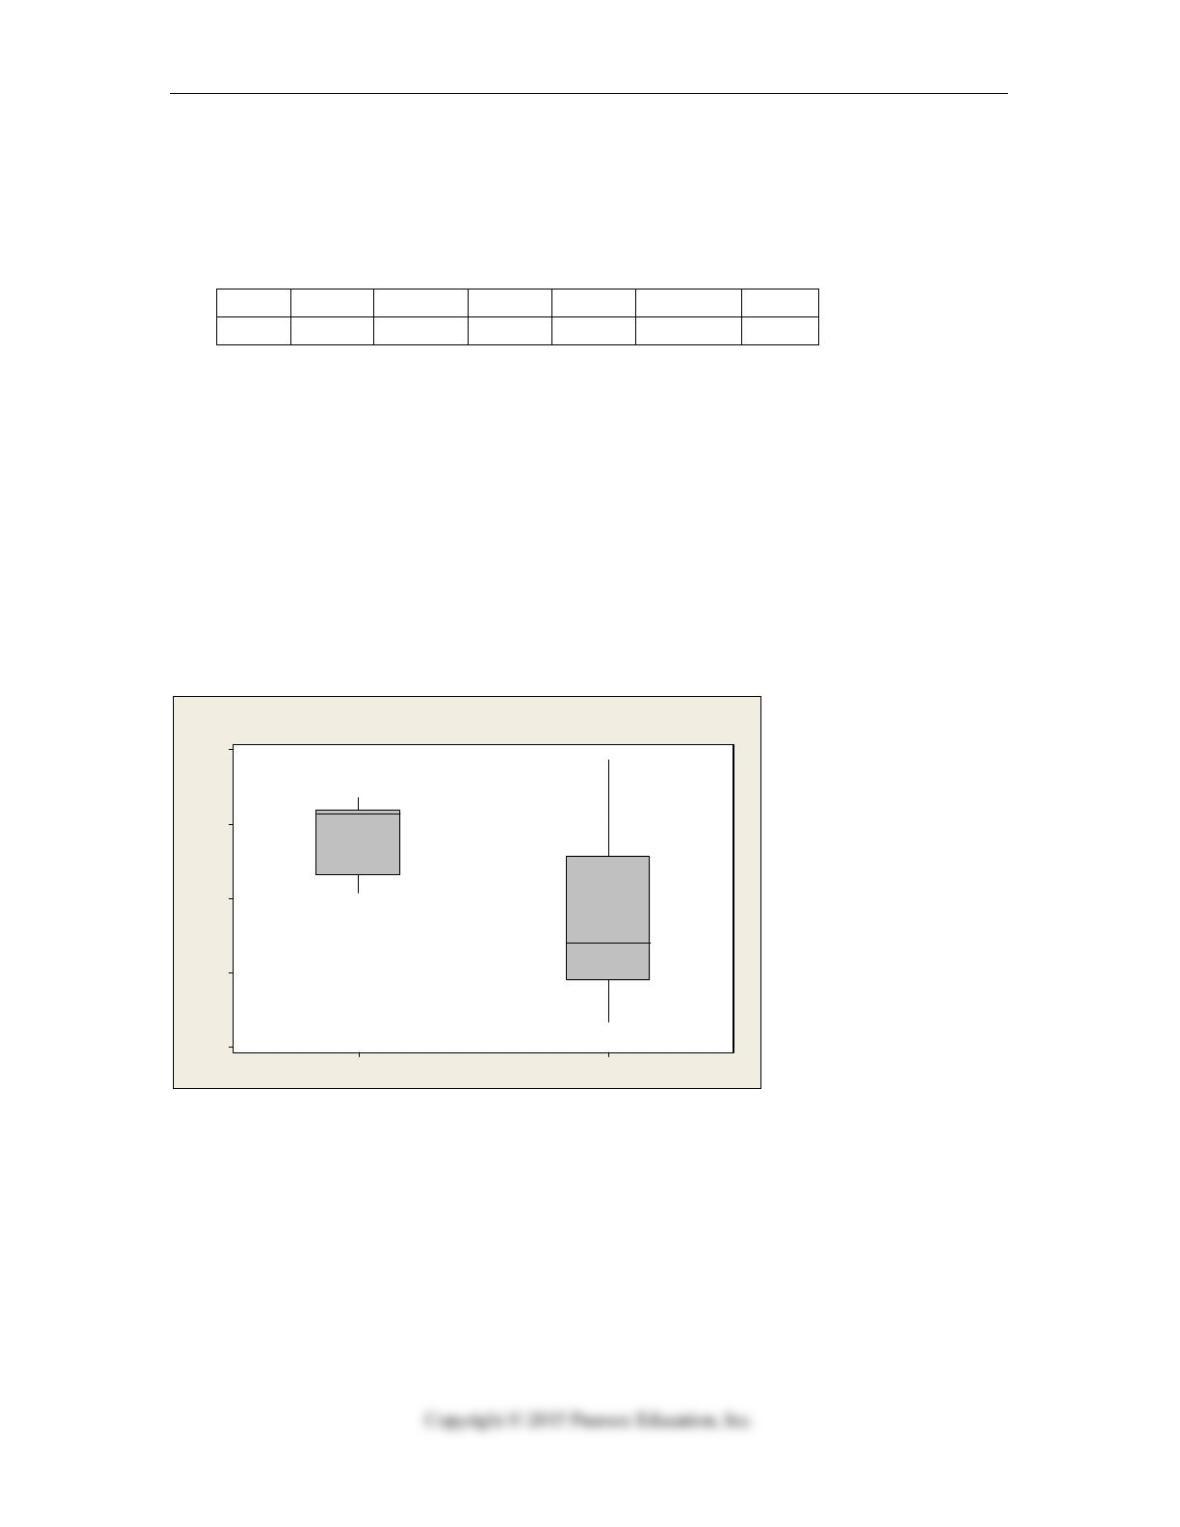
Chapter 3: Find summary statistics; create displays; describe distributions; determine
appropriate measures.
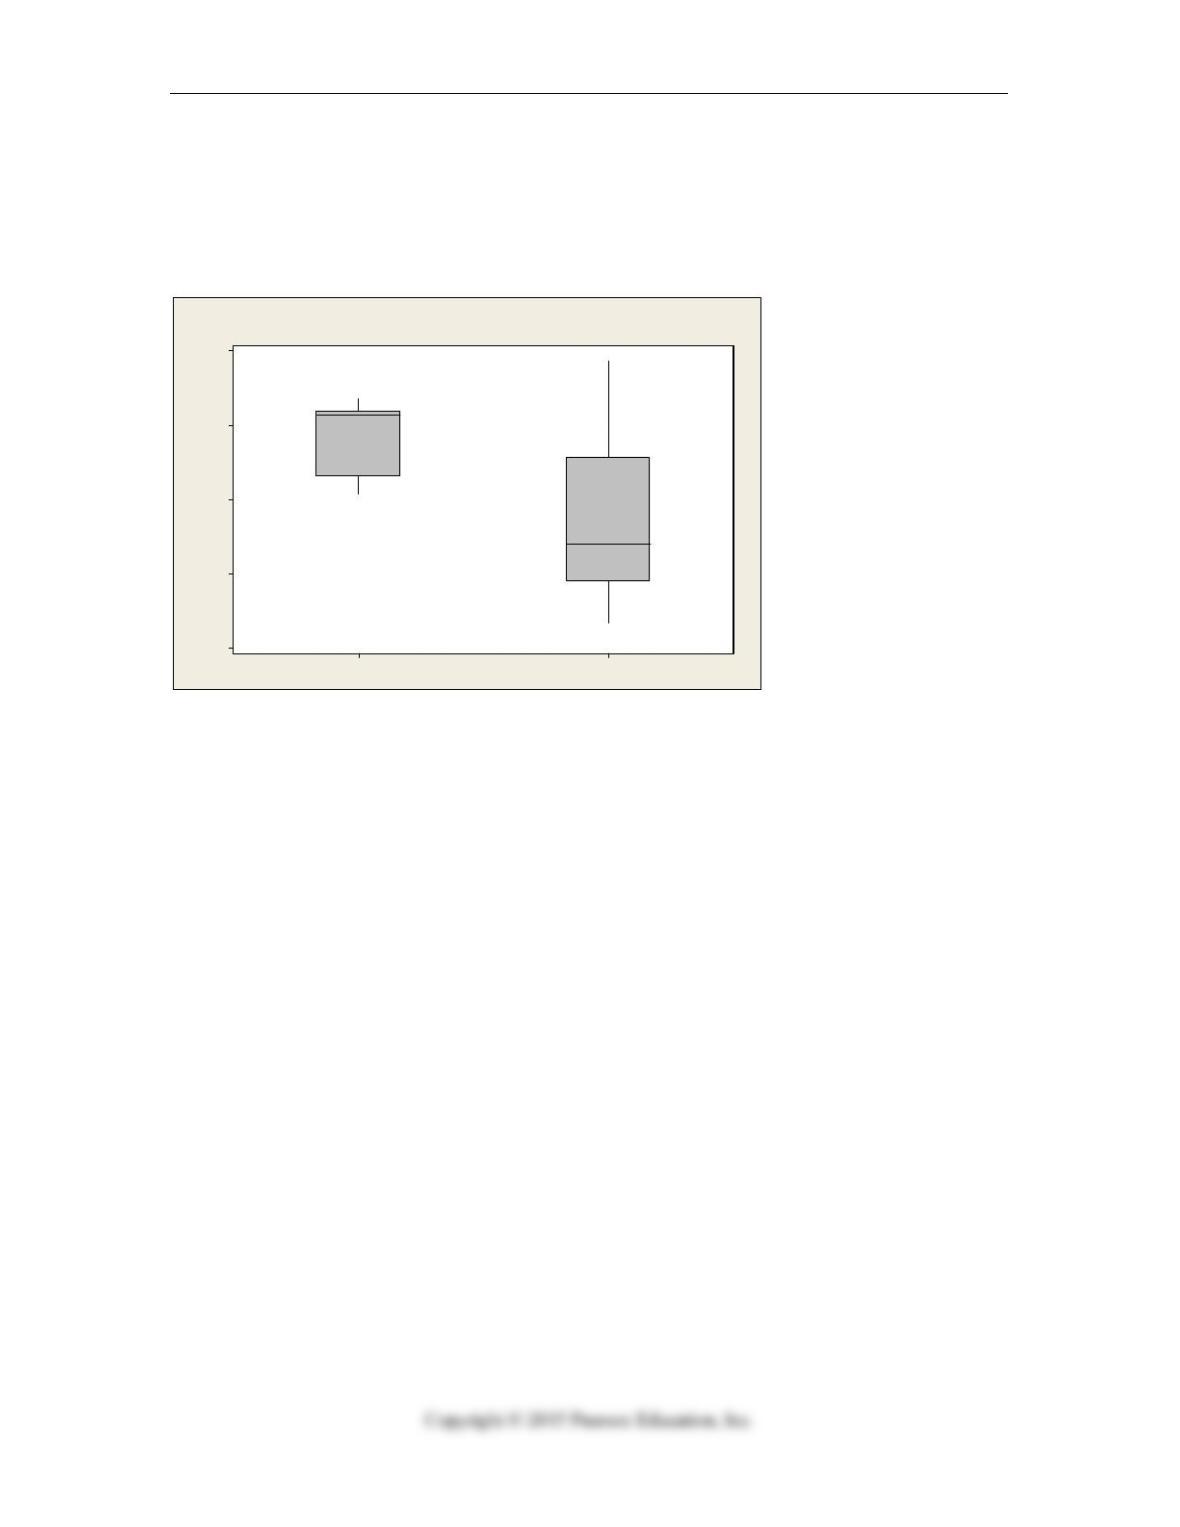
18. Boxplots of earnings per share (EPS) data for a sample of retail company stocks and
a sample of energy company stocks are shown below. Which of the following statements
is correct?
EnergyRetail
2
1
0
-1
-2
Dat a
Boxplot of Retail, Energy
A. The median EPS is higher for energy stocks compared to retail stocks.
B. The median EPS is higher for retail stocks compared to energy stocks.
C. The IQR for the EPS data is larger for retail stocks than for energy stocks.
D. The EPS data are more variable for retail stocks than for energy stocks.
E. The mean is higher for energy stocks compared to retail stocks.
Min Q1 Median Q3 Max Mean SD
50 85 108 227 550 120.75 42.08
Test B IB-11
Chapter 3: Find summary statistics; create displays; describe distributions; determine
appropriate measures.
19. Boxplots of earnings per share (EPS) data for a sample of retail company stocks and
a sample of energy company stocks are shown below. Which of the following statement
is true about the distributions of EPS for retail and energy stocks?
EnergyRetail
2
1
0
-1
-2
Dat a
Boxplot of Retail, Energy
A. The distribution of EPS for retail stocks is skewed to the right.
B. The distribution of EPS for energy stocks is symmetric.
C. Both distributions of EPS are symmetric.
D. The distribution of EPS for retail stocks is skewed to the left.
E. The distribution of EPS for energy stocks is skewed to the left.
Chapter 3: Standardize values and use them for comparisons of otherwise disparate
variables.
20. Suppose a sample of 60 cans of soda has a mean of 12.1 ounces and a standard
deviation of 0.05 ounces. If a can of soda has 12 ounces, what is its corresponding z
score?
A. 2.0
B. -2.0
C. 1.8
D. -3.0
E. -1.8
IB-12 Part I: Exploring and Collecting Data
Chapter 4: Summarize the strength of a linear relationship with a correlation, r.
21. For families who live in apartments the correlation between the family’s income and
the amount of rent they pay is r = 0.60. Which is true?
I. In general, families with higher incomes pay more in rent.
II. On average, families spend 60% of their income on rent.
III. The regression line passes through 60% of the (income$, rent$) data
points.
A. I only
B. II only
C. I and II
D. I and III
E. I, II and III
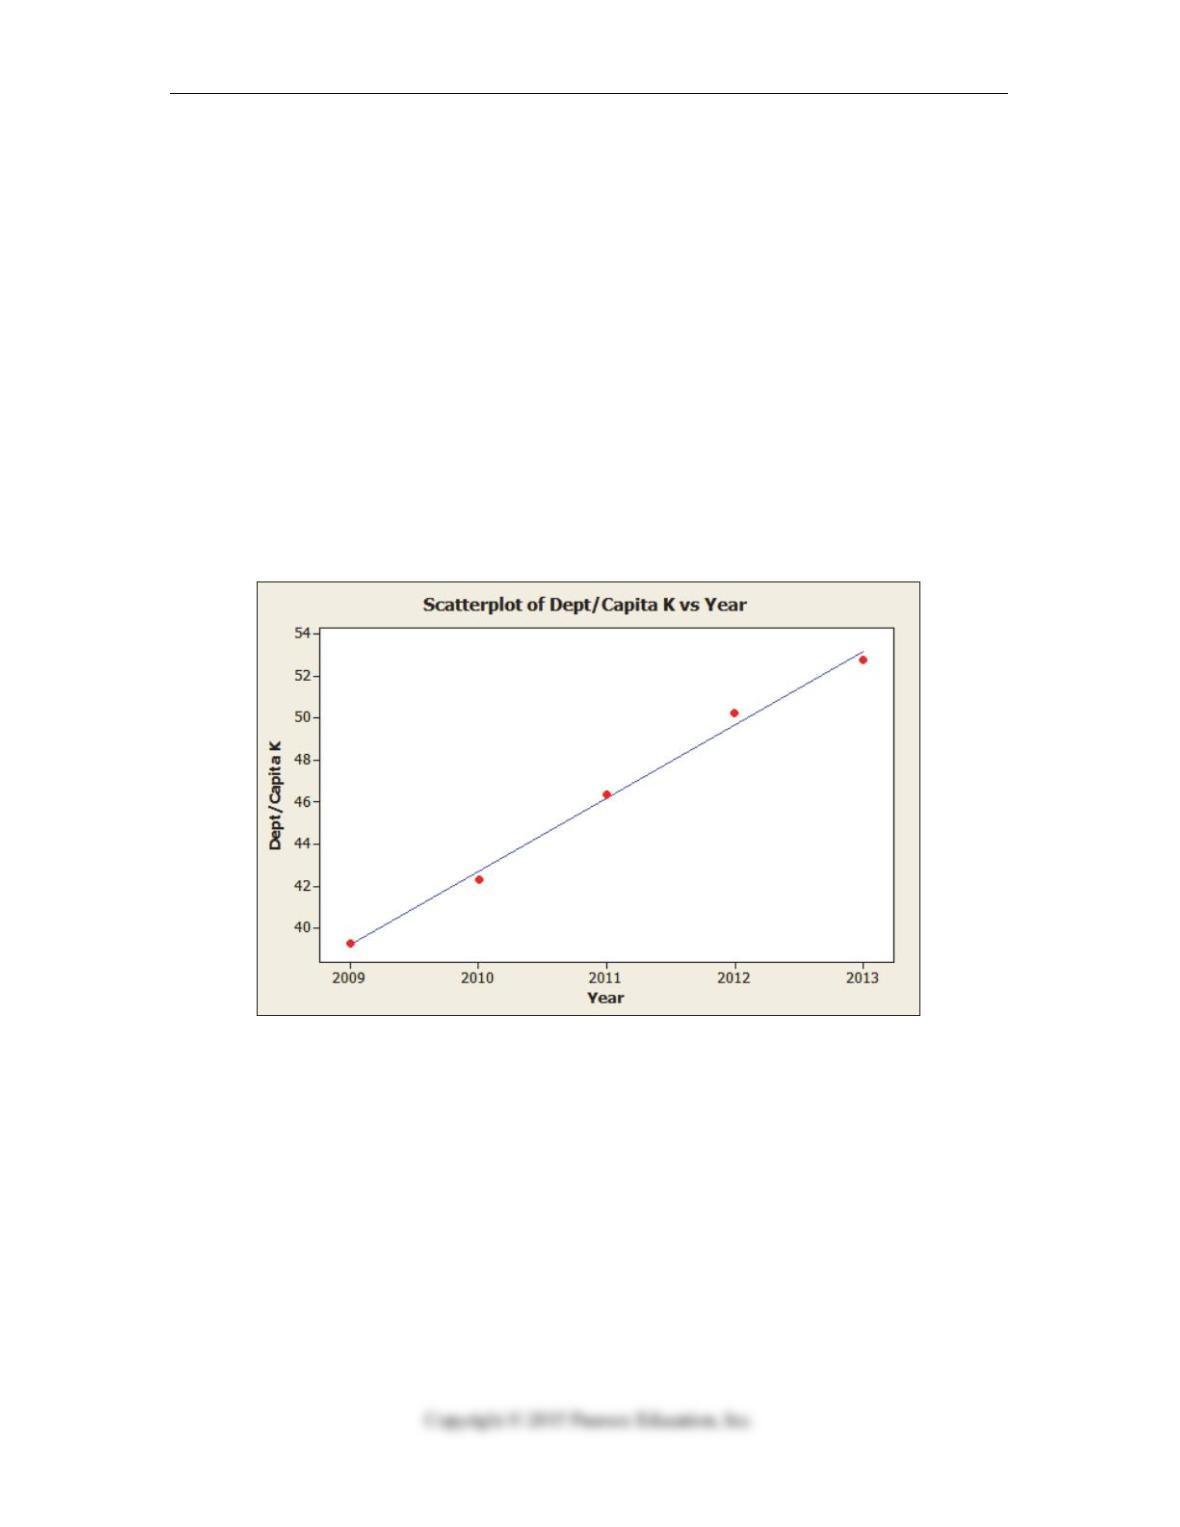
Chapter 4: Model a linear relationship with a least squares regression model.
22. US public debt per capita historical data for the years 2009-2013 yields the following
scatterplot:
The equation of the regression line is
()()
predicted Debt per capita $K 6,975 3.49 Debt Year=− + × with R2 = 99.5%.
Which of the following statements is true?
A. About 99.5% of the variability in debt per capita is explained by the model.
B. On average, debt per capita increases $3.49K per year.
C. The response variable is “year.”
D. Both A and B.
E. All of the above.
Test B IB-13
Business Statistics: Part I: Exploring and Collecting Data – Test B – Key