
VA-1
Business Statistics: Part V
Selected Topics in Decision Making – Test A Name___________________
Chapter 20: Write hypotheses for the one-way ANOVA.
1. Suppose a company collects data from random samples taken in three different
industries: (1 = Consumer Goods, 2 = Financial, 3 = Health Care) to determine if
salaries differ. The null hypothesis to be tested is
A. Mean quality professionals’ salaries are equal across the three different industries.
B. Mean salaries of quality professionals are not all equal across the three different
industries.
C. Type of industry does not affect the salaries of quality professionals.
D. Both A and C.
E. Both B and C.
Chapter 20: Analyze the one-way ANOVA.
2. Based on the partial ANOVA results shown below, the F statistic value is
One-way ANOVA: Salary versus Industry
Source DF SS MS F P
Industry 2 23343 11671
Error 27 16589 614
Total 29 39932
A. F = 19.01
B. F = 1.407
C. F = 48.7
D. F = 0.499
E. None of the above
Chapter 20: Analyze the one-way ANOVA.
3. An ANOVA was used to determine if professionals’ industry affects their salaries.
An F statistic is reported with an associated P-value of < .001. At α = .05 we
A. fail to reject the null hypothesis.
B. reject the null hypothesis.
C. conclude that mean salaries of quality professionals are all equal across the
different industries.
D. Both A and C.
E. Both B and C.

VA-2 Part V: Selected Topics in Decision Making
Chapter 20: Analyze multifactor designs.
4. Based on the partial ANOVA results shown below, the F-statistic for testing whether
the three brands of AAA batteries have equal mean lifetimes is
Two-way ANOVA: Time (min) versus Brand, Device
Source DF SS MS F P
Brand 2 2974 1487
Device 3 2496533 832178
Error 6 3017 503
Total 11 2502524
A. 2.96
B. 1654.89
C. 0.98
D. 827.49
E. 54.67
Chapter 20: Analyze multifactor designs.
5. Suppose the P-value associated with the F-statistic for testing whether brand affects
battery lifetime is 0.128. Based on this we can conclude that
A. we should reject the null hypothesis.
B. there is a difference in the mean lifetimes among the different brands.
C. there is a difference in the mean lifetimes among the different devices.
D. there is no significant interaction effect.
E. there is no difference in the mean lifetimes among the different brands.
Chapter 20: Recognize different types of studies.
6. The experiment is run once for each combination of brand of AAA batteries and
device (TV remote, hand-held game, flashlight and digital camera). The twelve runs
are ordered randomly. The time (in minutes) that each battery lasts under continuous
usage is recorded. Which of the following statements is true about this design?
A. This is a completely randomized design in one factor.
B. The devices serve as blocks to account for the variability between the lengths of
time batteries last in different devices.
C. The interaction effect between brand of battery and type of device is significant.
D. This is an observational study.
E. This is a retrospective study.
Test A VA-3
Chapter 20: Determine if conditions for ANOVA are met.
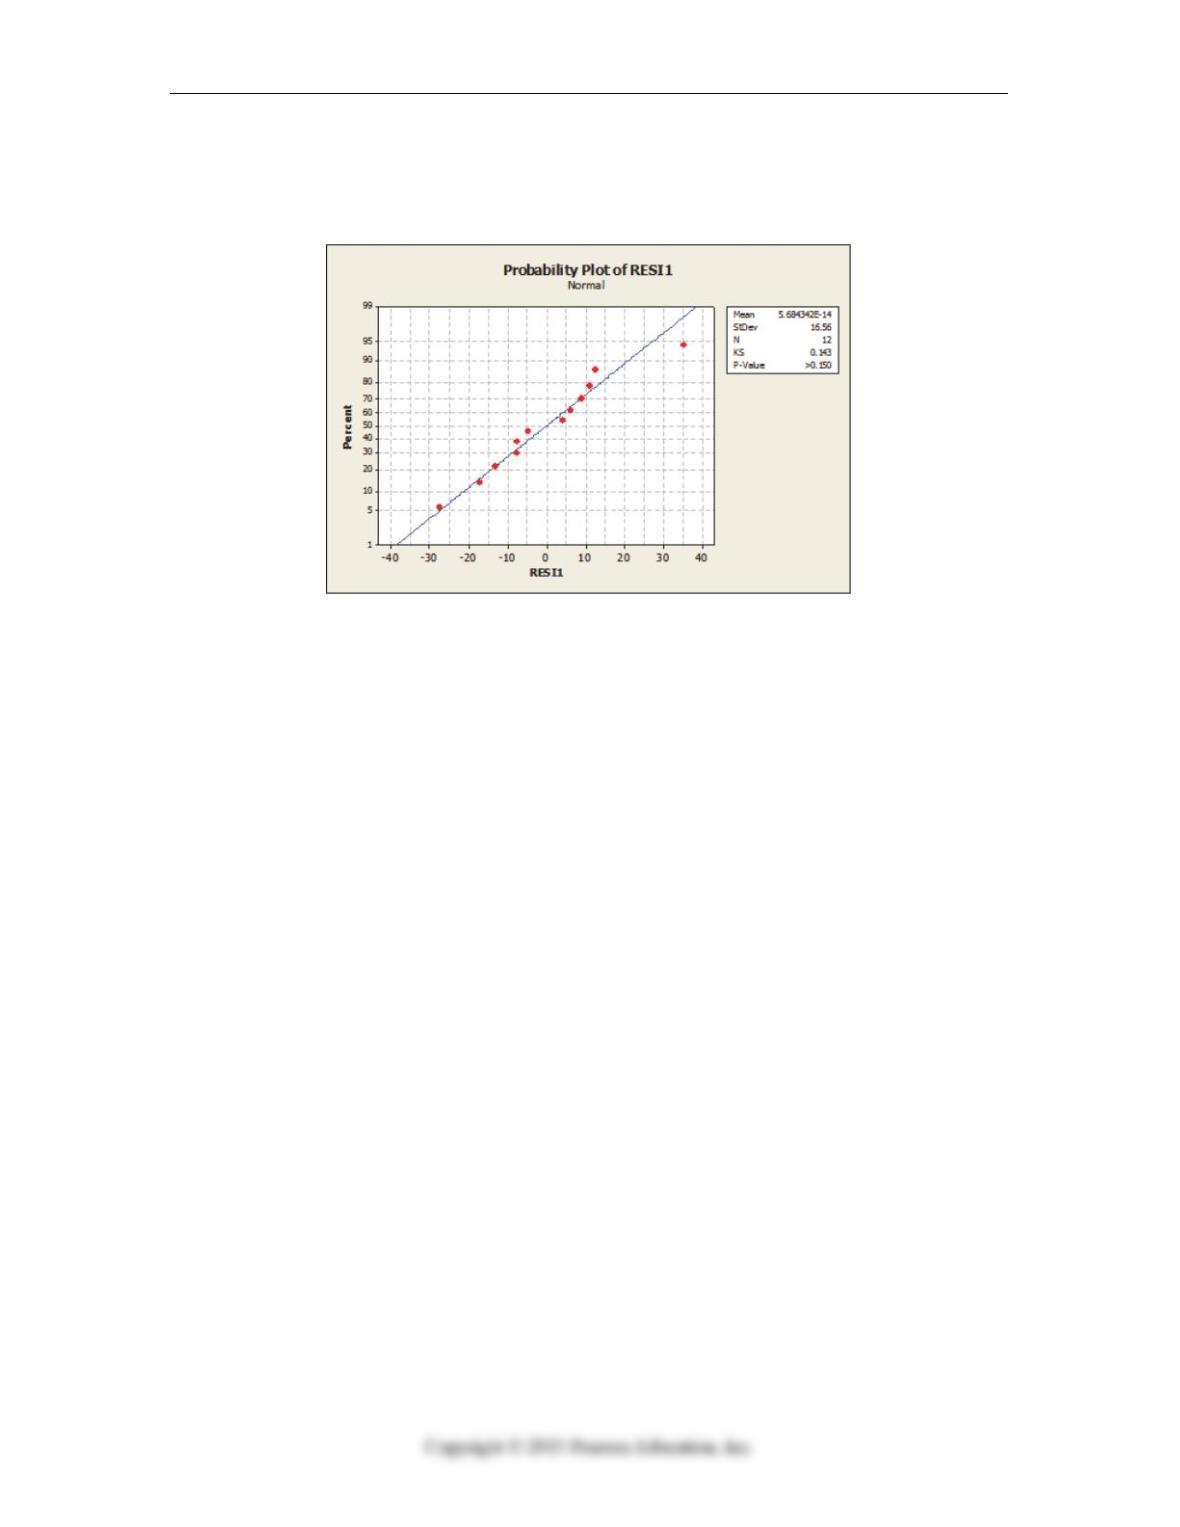
7. Based on the following plot of residuals, what can you say about the conditions for
ANOVA?
A. The equal variance assumption is satisfied.
B. The linearity assumption is satisfied.
C. The nearly normal assumption is satisfied.
D. The nearly normal assumption is not satisfied.
E. The additive assumption is satisfied.
Chapter 21: Identify the appropriate control chart for measured data.
8. To initiate control charting, twenty-five samples of size five are periodically taken
and the resistance (in ohms) of each copper wire is measured. An appropriate control
chart to use for these data is the
A. p chart
B. c chart
C. x-bar and r chart
D. Pareto chart
E. ARL chart
Chapter 21: Identify the appropriate control chart for attributes data.
9. A company counts and records the number of data entry errors made on the first order
form completed each day for a month (control charting). An appropriate control chart
to use for these data is the
A. p chart
B. c chart
C. x-bar and r chart
D. Pareto chart
E. ARL chart

VA-4 Part V: Selected Topics in Decision Making
Chapter 21: Create X-bar and R charts.
10. A major customer for a vendor of plastic containers requires that its containers have a
volume of 10,000 cubic inches with a tolerance of 50 cubic inches. Forty subgroups
of five containers each were selected periodically from the production process. The
average of the means across all subgroups was found to be 10,012 cubic inches and
the average range was 48 cubic inches. The lower and upper control limits for the R
chart are
A. 0 and 111.65 cubic inches
B. 9984.30 and 10,039.70 cubic inches
C. 9910.53 and 10,113.47 cubic inches
D. 0 and 101.47 cubic inches
E. 0 to 98 cubic inches
Chapter 21: Create X-bar and R charts.
11. A major customer for a vendor of plastic containers requires that its containers have a
volume of 10,000 cubic inches with a tolerance of 50 cubic inches. Forty subgroups
of five containers each were selected periodically from the production process. The
average of the means across all subgroups was found to be 10,012 cubic inches and
the average range was 48 cubic inches. The lower and upper control limits for the X-
bar chart are
A. 0 and 111.65 cubic inches
B. 9984.30 and 10,039.70 cubic inches
C. 9910.53 and 10,113.47 cubic inches
D. 0 and 101.47 cubic inches
E. 9950 and 10,050 cubic inches
Chapter 21: Estimate the process standard deviation.
12. A major customer for a vendor of plastic containers requires that its containers have a
volume of 10,000 cubic inches with a tolerance of 50 cubic inches. Forty subgroups
of five containers each were selected periodically from the production process. The
average of the means across all subgroups was found to be 10,012 cubic inches and
the average range was 48 cubic inches. The estimated process standard deviation (
ˆ)
is
A. 48 cubic inches
B. 22.69 cubic inches
C. 20.64 cubic inches
D. 50 inches
E. 32.99 cubic inches

Test A VA-5
Chapter 21: Compute process capability indices.
13. A major customer for a vendor of plastic containers requires that its containers have a
volume of 10,000 cubic inches with a tolerance of 50 cubic inches. Forty subgroups
of five containers each were selected periodically from the production process. The
average of the means across all subgroups was found to be 10,012 cubic inches and
the average range was 48 cubic inches. What is the Cp index?
A. 0.203
B. 0.807
C. 1.615
D. 2.667
E. 4.845
Chapter 22: Apply and interpret Spearman’s Rho.
14. Suppose that six different e-readers were evaluated by two senior citizen consumer
groups using rankings from 1 (best) to 6 (worst). What nonparametric method should
be used to determine the association between these rankings?
A. Spearman’s rho
B. Pearson’s rho
C. Wilcoxon Signed-Rank test
D. Mann-Whitney test
E. Wilcoxon’s rho
Chapter 22: Apply the Wilcoxon Signed-Rank test.
15. Suppose that six different e-readers were evaluated by two senior citizen consumer
groups using rankings from 1 (best) to 6 (worst). To determine if there is a difference
in the rankings between the two magazines, the appropriate nonparametric method is
the
A. Wilcoxon Rank-Sum test.
B. Wilcoxon Signed-Rank test.
C. Spearman’s rho.
D. Kruskal Wallis test.
E. Kendall’s tau.
VA-6 Part V: Selected Topics in Decision Making
Chapter 22: Apply the Wilcoxon Signed-Rank test.
16. Suppose that six different e-readers were evaluated by two senior citizen groups with
respect to their suitability for use among the older segment of the population. The
rankings from 1 (best) to 6 (worst) are shown below. Using the appropriate
nonparametric method, the value of the calculated test statistic to determine if there is
a difference in the rankings between the two magazines is
A. 2.5
B. 3
C. 5.5
D. 7.5
E. 10
Chapter 22: Understand nonparametric methods.
17. The nonparametric alternative to the two sample t-test is the
A. Kruskal-Wallis test.
B. Kendall’s tau.
C. Wilcoxon Rank Sum test.
D. Friedman test.
E. Wilcoxon Signed Rank test.
Chapter 22: Apply the Kruskal-Wallis test.
18. Three wines (California, Australian and Italian) were tasted by a different group of
judges as part of an annual food and wine festival. The judges graded the wines on
overall quality (A = excellent to F = poor). The appropriate nonparametric procedure
to determine differences in perceived quality is
A. Wilcoxon Signed-Rank test.
B. Wilcoxon Rank Sum test.
C. Kruskal Wallis test.
D. Spearman’s rho.
E. Mann-Whitney test.
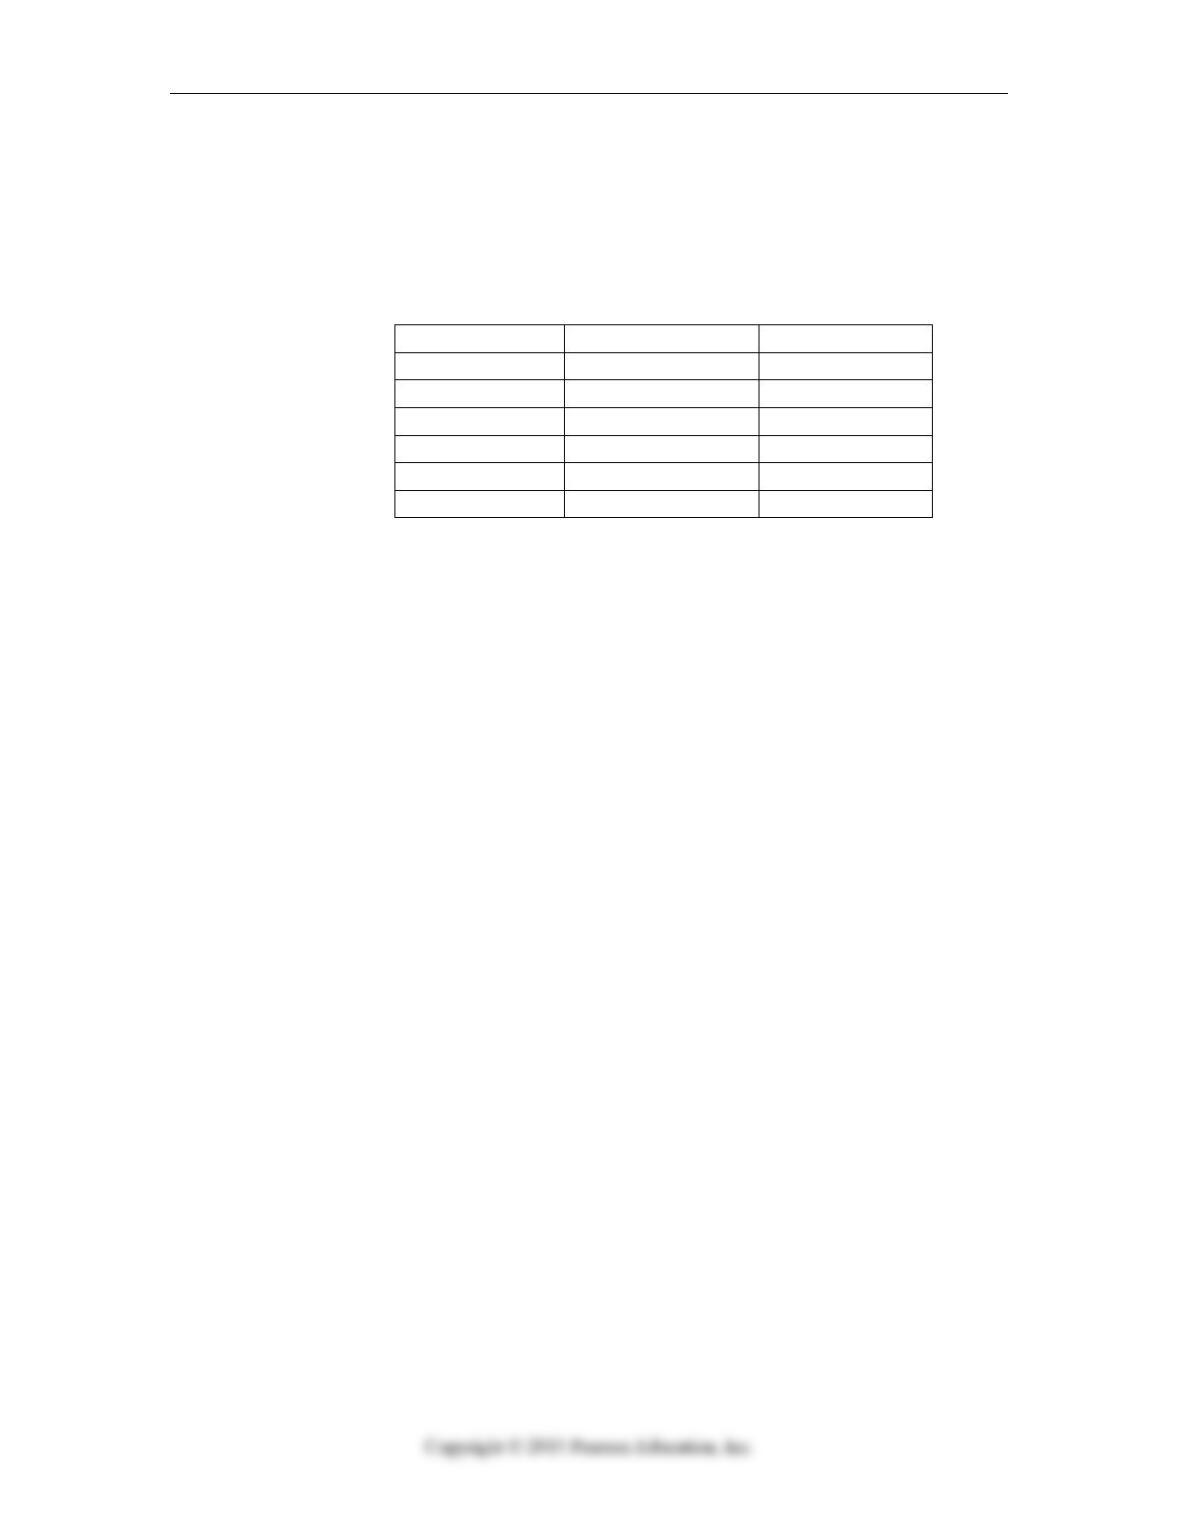
Model Group 1 Group 2
Kindle 3 1 1
Sony Reader 2 3
Kindle DX 3 2
Alex 4 6
Kobo eReader 5 4
COOL-ER 6 5
Test A VA-7
Chapter 22: Apply the Kruskal-Wallis test.
19. Three wines (California, Australian and Italian) were tasted by a different group of
judges as part of an annual food and wine festival. The judges graded the wines on
overall quality (A = excellent to F = poor). The calculated value of the statistic for
the appropriate nonparametric test to determine differences in perceived quality is
A. 1.25
B. 10.78
C. 9.45
D. 4.34
E. 3.45
Chapter 22: Apply the Kruskal-Wallis test.
20. Judges graded three wines (California, Australian and Italian) on overall quality (A =
excellent to F = poor). Suppose the calculated test statistic if the appropriate
nonparametric method to determine differences in perceived quality is has a P-value
of 0.114. At α = 0.05, we should
A. reject the null hypothesis.
B. not reject the null hypothesis.
C. conclude that the groups are all the same.
D. both A and C.
E. both B and C.
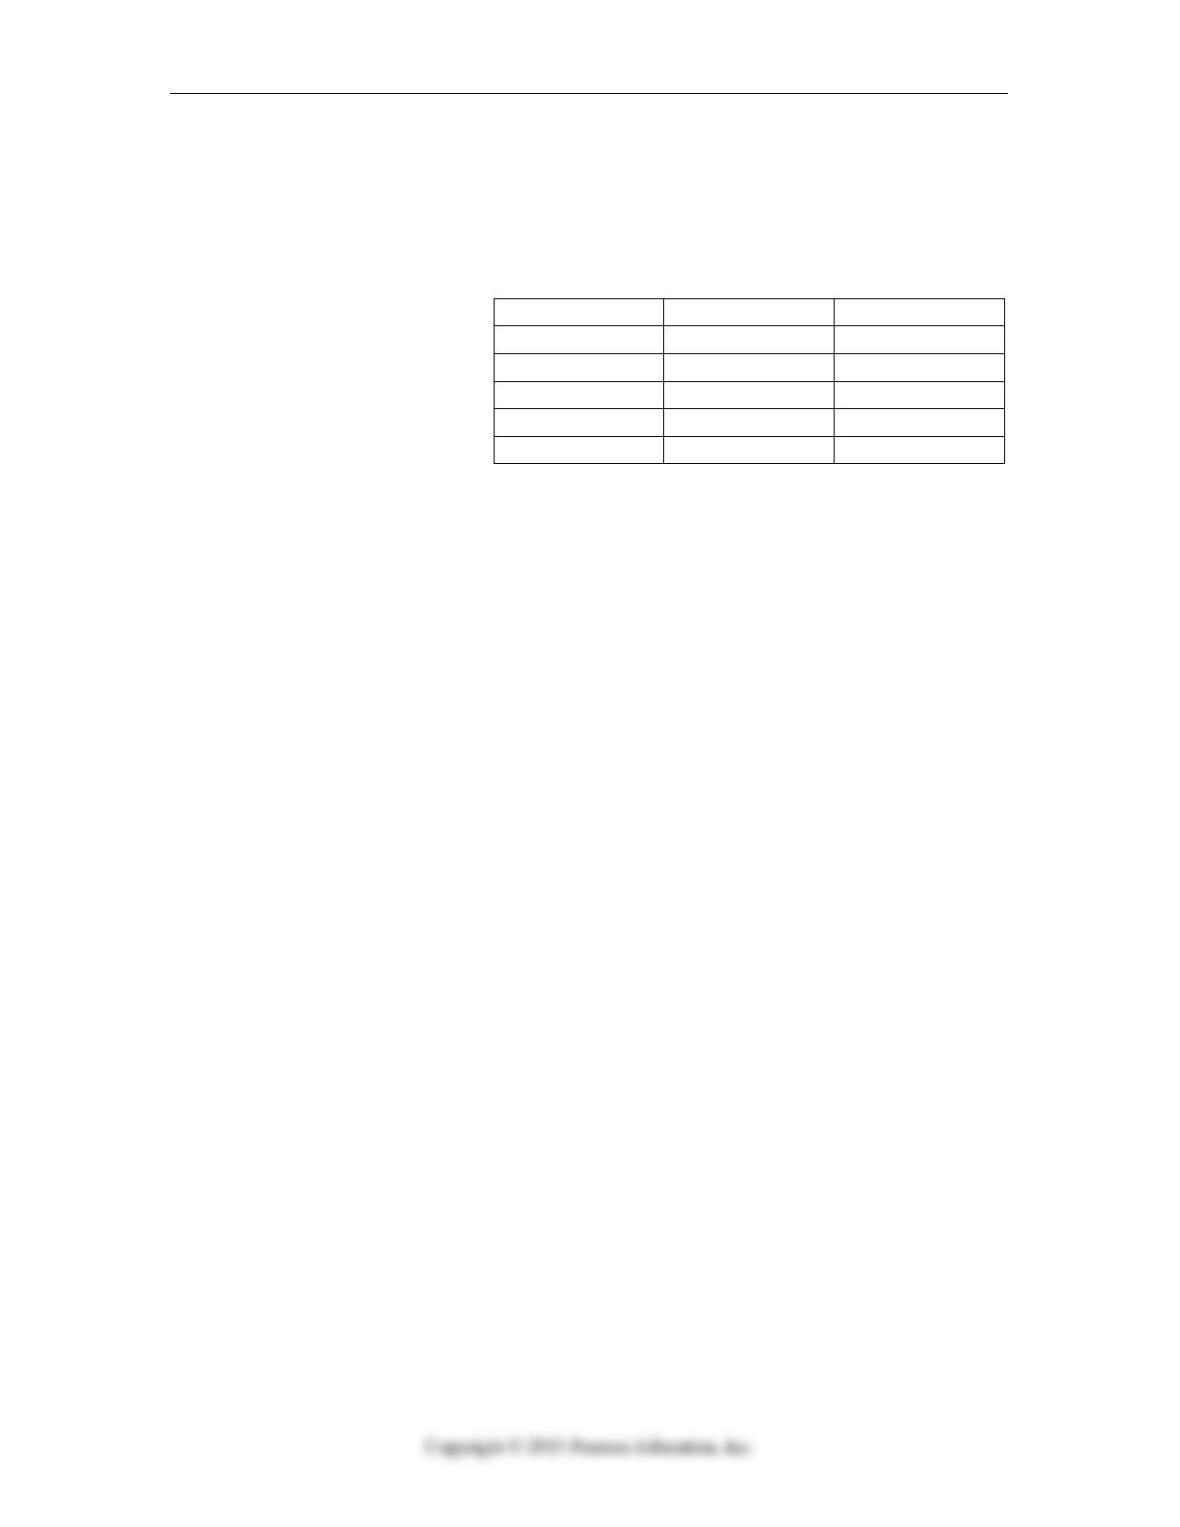
California Australian Italian
A- A A
B- A- A-
A- B+ A-
C A B+
B A- A
VA-8 Part V: Selected Topics in Decision Making
Chapter 23: Use a payoff table or decision tree.
21. The following payoff table (in thousands of dollars) considers three possible levels of
demand in a housing complex. Using the maximax approach, the action taken should
be to
A. Build a small complex
B. Build a large complex
C. Build a large complex with high demand
D. Build a small complex with low demand
E. Do not build any size complex
Chapter 23: Find the expected value of an action.
22. The following payoff table (in thousands of dollars) considers three possible levels of
demand in a housing complex. If there is a 45% chance that the demand level will be
low, 30% that it will be medium and 25% chance that it will be high, the expected
value (in thousands of dollars) associated with the best action is
A. $208.75
B. $225
C. $310
D. $326.25
E. $535
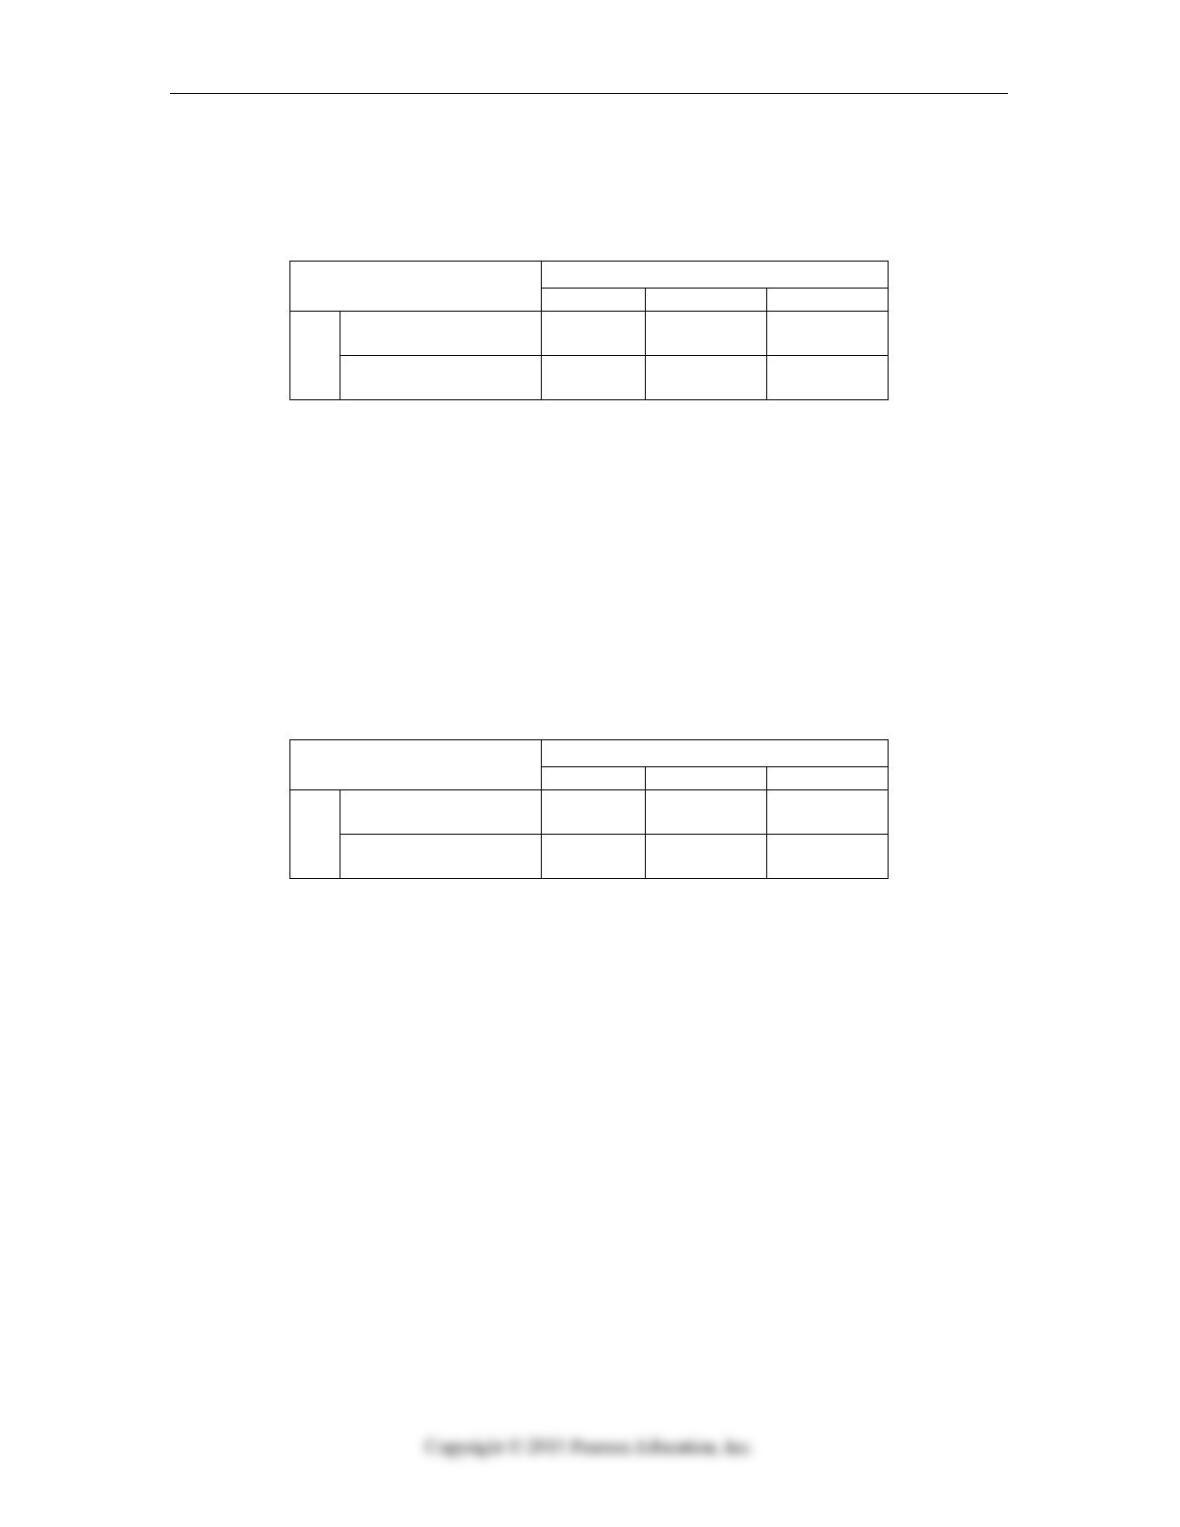
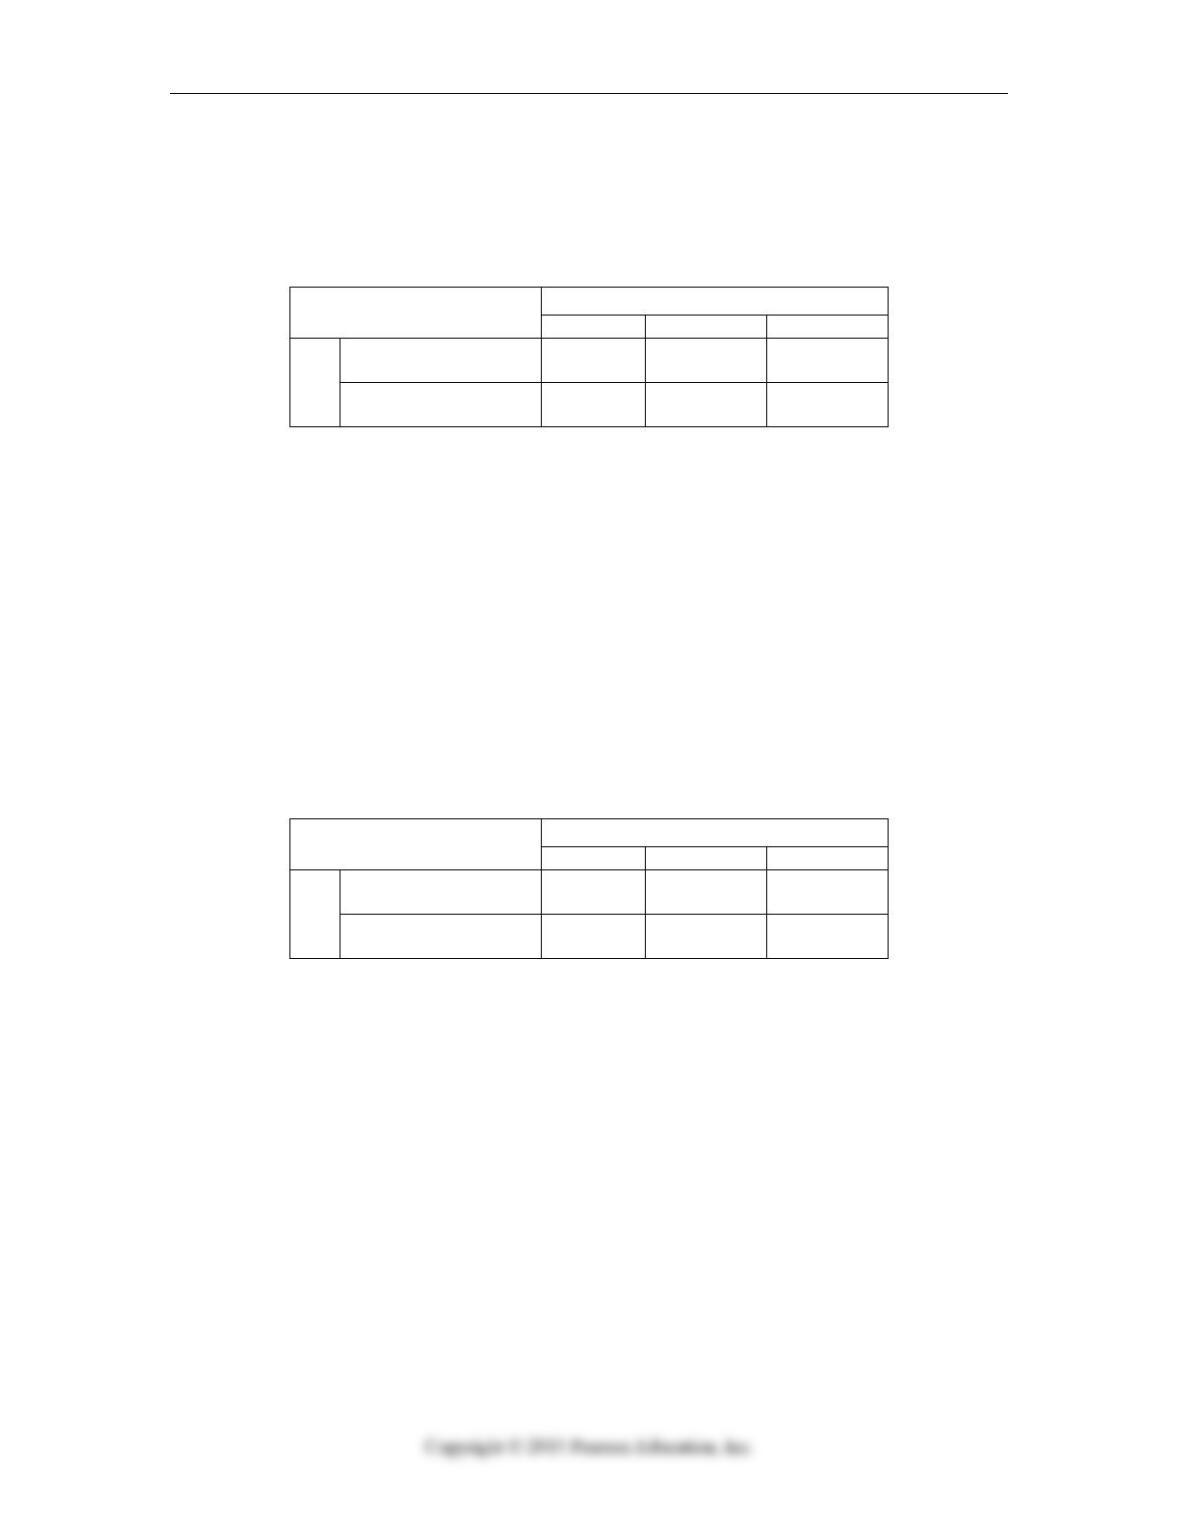
Demand Level
Low Medium High
Action
Build Small Complex -$250 $650 $975
Build Large Complex -$750 $950 $1,450
Demand Level
Low Medium High
Action
Build Small Complex -$250 $650 $975
Build Large Complex -$750 $950 $1,450
Test A VA-9
Chapter 23: Find the expected value with perfect information.
23. The following payoff table (in thousands of dollars) considers three possible levels of
demand in a housing complex. If there is a 45% chance that the demand level will be
low, 30% that it will be medium and 25% chance that it will be high, what is the
expected value of perfect information?
A. $208.75
B. $225
C. $310
D. $326.25
E. $535
Chapter 23: Find expected values, standard deviations and return to risk ratios.
24. The following payoff table (in thousands of dollars) considers three possible levels of
demand in a housing complex. If there is a 45% chance that the demand level will be
low, 30% that it will be medium and 25% chance that it will be high. Moreover, the
standard deviations (in thousands of dollars) for building a small and large complex
are 535 and 976, respectively. Based on the resulting coefficients of variation (CV),
which of the following statements would be true?
A. The CV of building a large complex is less than that of building a small complex.
B. The CV of building a small complex is less than that of building a large complex.
C. The risk averse action would be to build a large complex.
D. Both A and C
E. Both B and C
Demand Level
Low Medium High
Action
Build Small Complex -$250 $650 $975
Build Large Complex -$750 $950 $1,450
Demand Level
Low Medium High
Action
Build Small Complex -$250 $650 $975
Build Large Complex -$750 $950 $1,450

VA-10 Part V: Selected Topics in Decision Making
Chapter 24: Understand the data mining process.
25. Disparate databases that include demographic and transactional variables merged
together are referred to as
A. Data storage bins
B. Data mines
C. OLAP
D. CRISP
E. Data warehouses
Test A VA-11
Business Statistics: Part V: Selected Topics in Decision Making – Test A – Key