
Business Statistics: Part I: Exploring and Collecting Data – Test A
Name___________________________________________________
Chapter 1: Identify various aspects of studies and experiments and/or classify variables.
1. In listing a property, real estate agencies provides information on a number of
variables. Which of the following variables related to property listings is categorical?
A. Real Estate Tax
B. Number of Bedrooms
C. Style of Home
D. Asking Price
E. Number of Bathrooms
Chapter 1: Identify cases, variables and any units.
2. What scale of measurement is the type of a car (sedan, SUV, convertible, etc)?
A. Nominal
B. Interval
C. Quantitative
D. Ordinal
E. Numerical
Chapter 1: Determine whether data are a time series or are cross‐sectional.
3. Real estate agencies keep track of housing prices in a given area. Suppose they also
provide their clients with quarterly median selling prices for homes in a given area for the
past three year period. These data are
A. Cross-sectional
B. Time Series
C. Categorical
D. Nominal
E. Ordinal
IA-2 Part I: Exploring and Collecting Data
Chapter 2: Determine if displays of data are appropriate.
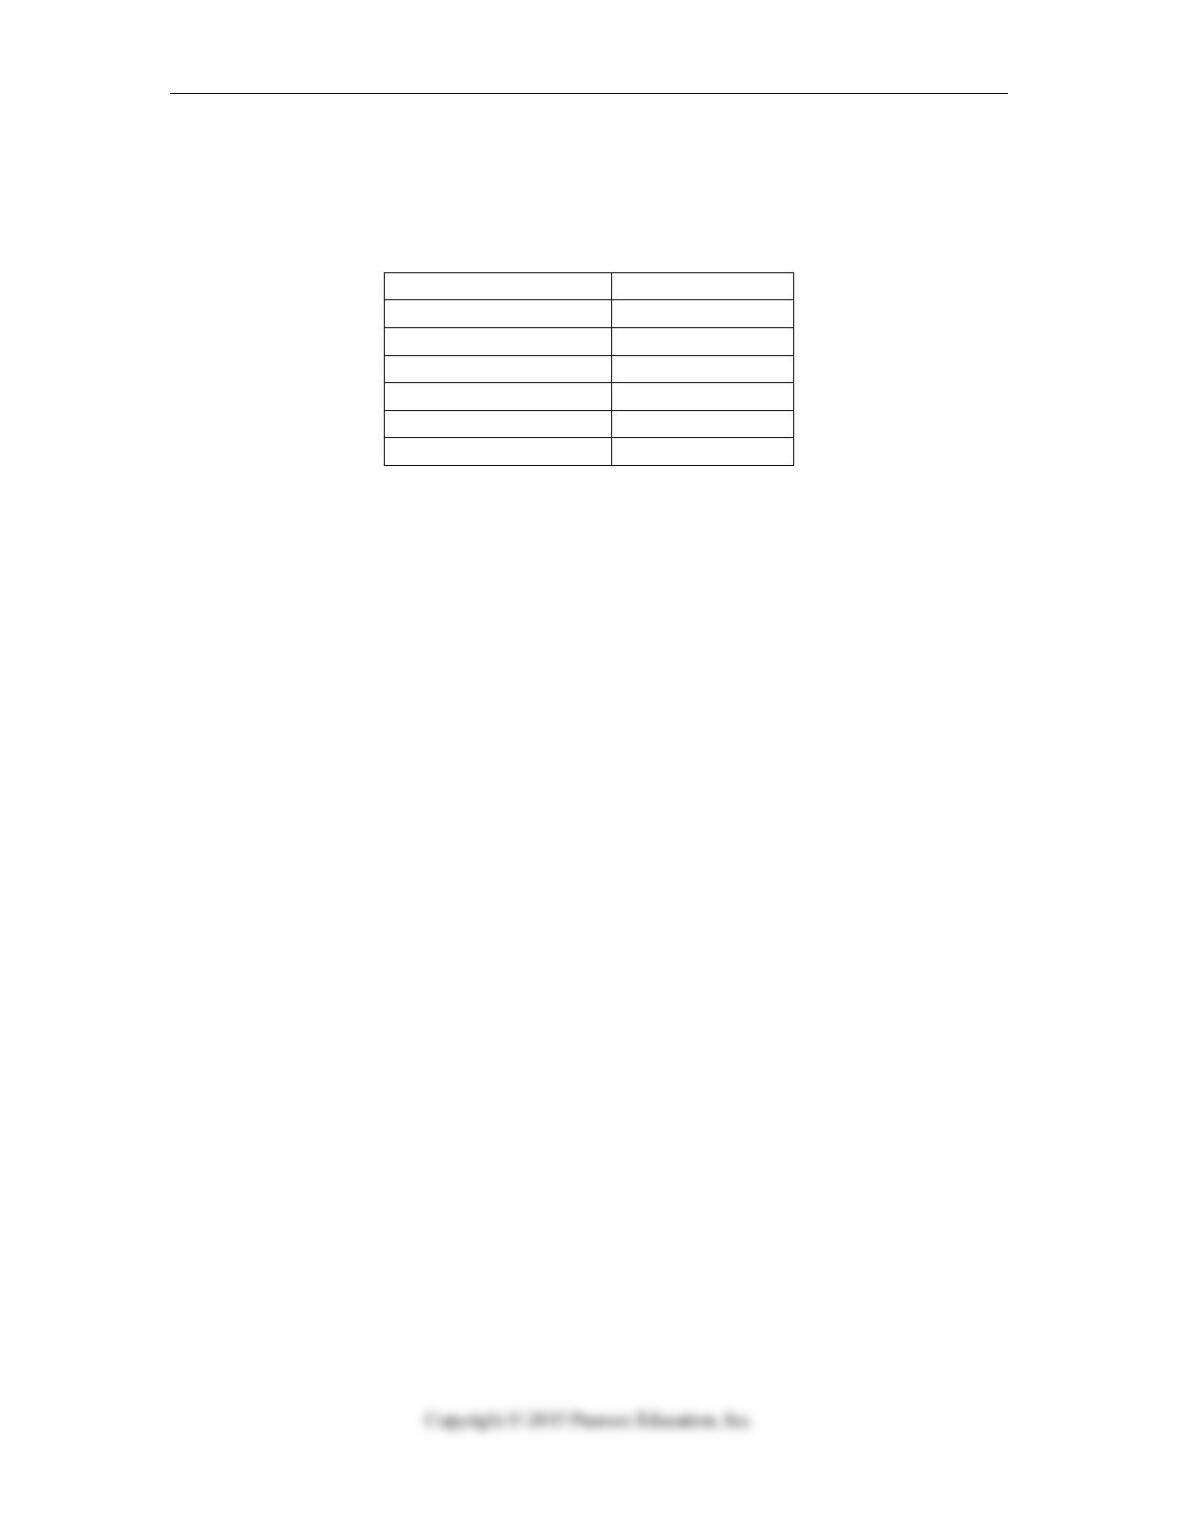
4. A business researcher conducted a survey of 500 women to determine preferences for
types of automobiles. The types are shown below along with the number of women who
prefer that type. Which of the following charts would be appropriate for displaying these
data?
A. Histogram
B. Boxplot
C. Pie Chart
D. Line Graph
E. Stem and Leaf Display
Type of Automobile No. of Female
Sedan 155
SUV 112
Van 125
Sports cars 55
Convertible 28
Other 25
Test A IA-3
Chapter 4: Make a scatterplot to display the relationship between two quantitative
variables.
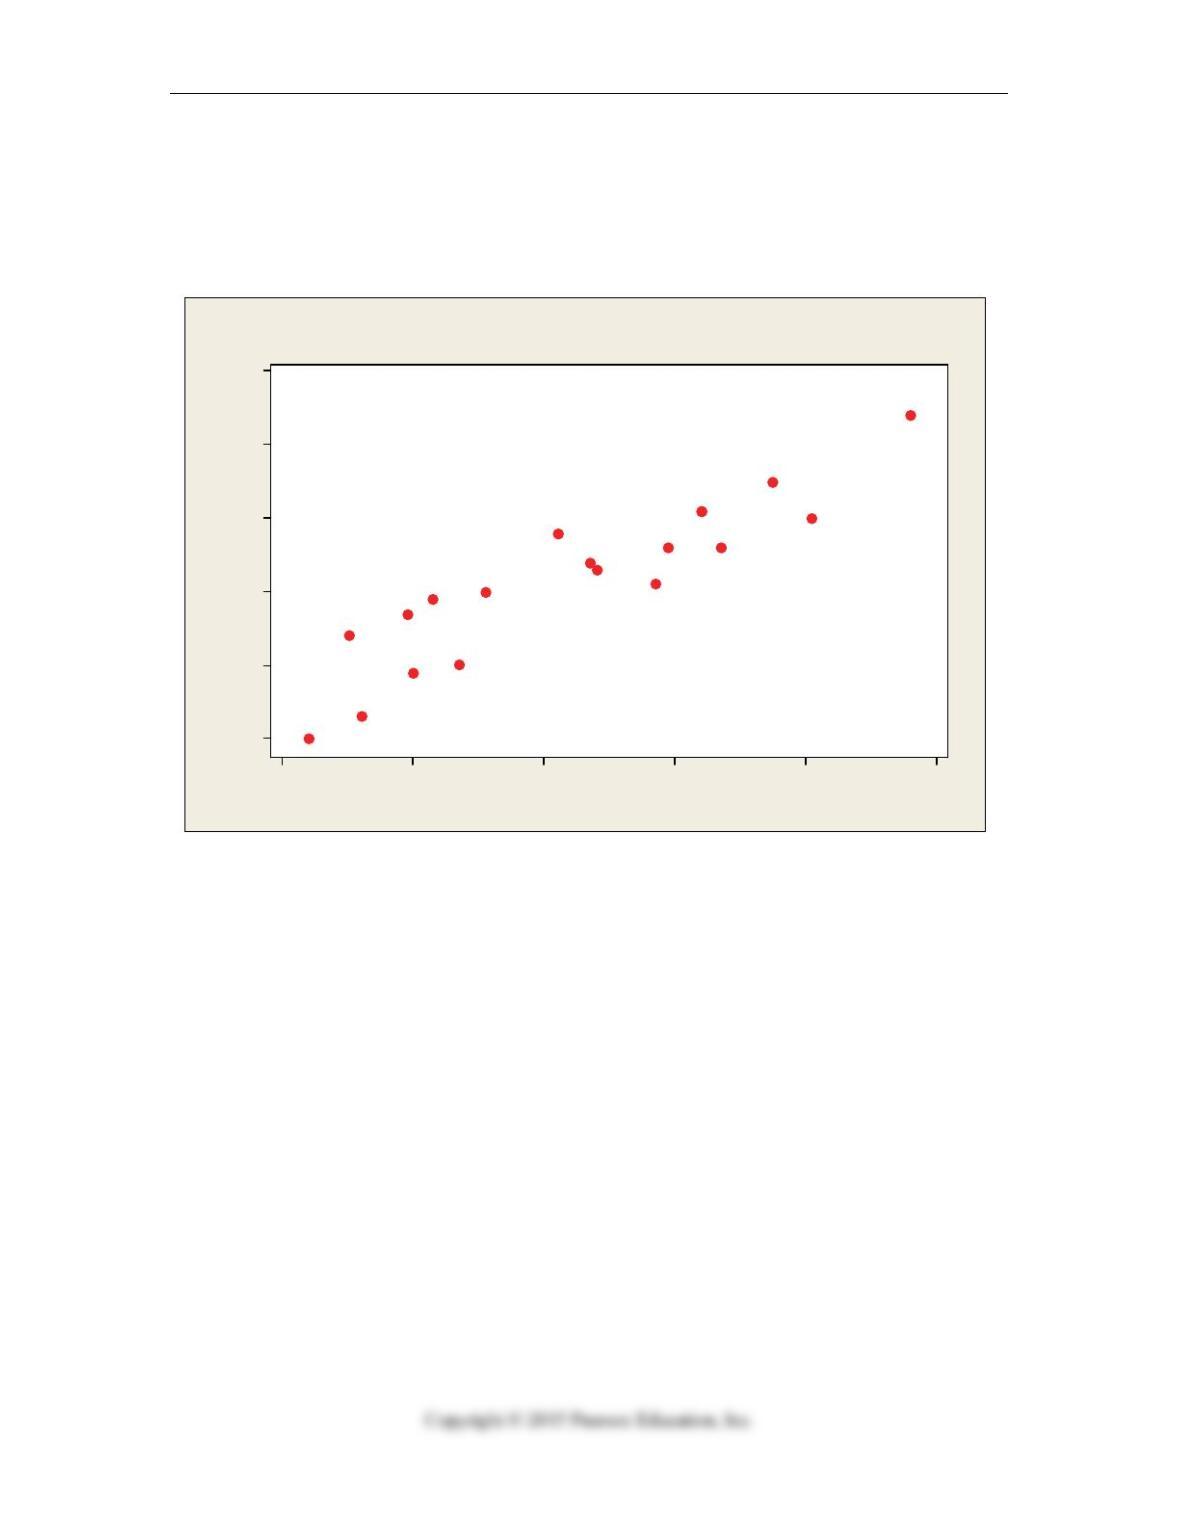
5. The following scatterplot shows monthly sales figures (in units) and number of
months of experience on the job for a sample of 19 salespeople. Describe the association
between monthly sales and level of experience.
100806040200
80
70
60
50
40
30
Exper ience
Sales
Scatterplot of Sales vs Experience
A. Wear negative linear association
B. Moderate positive linear association
C. Moderate negative linear association
D. Weak positive linear association
E. Non-linear
IA-4 Part I: Exploring and Collecting Data
Chapter 4: Summarize the strength of a linear relationship with a correlation, r.
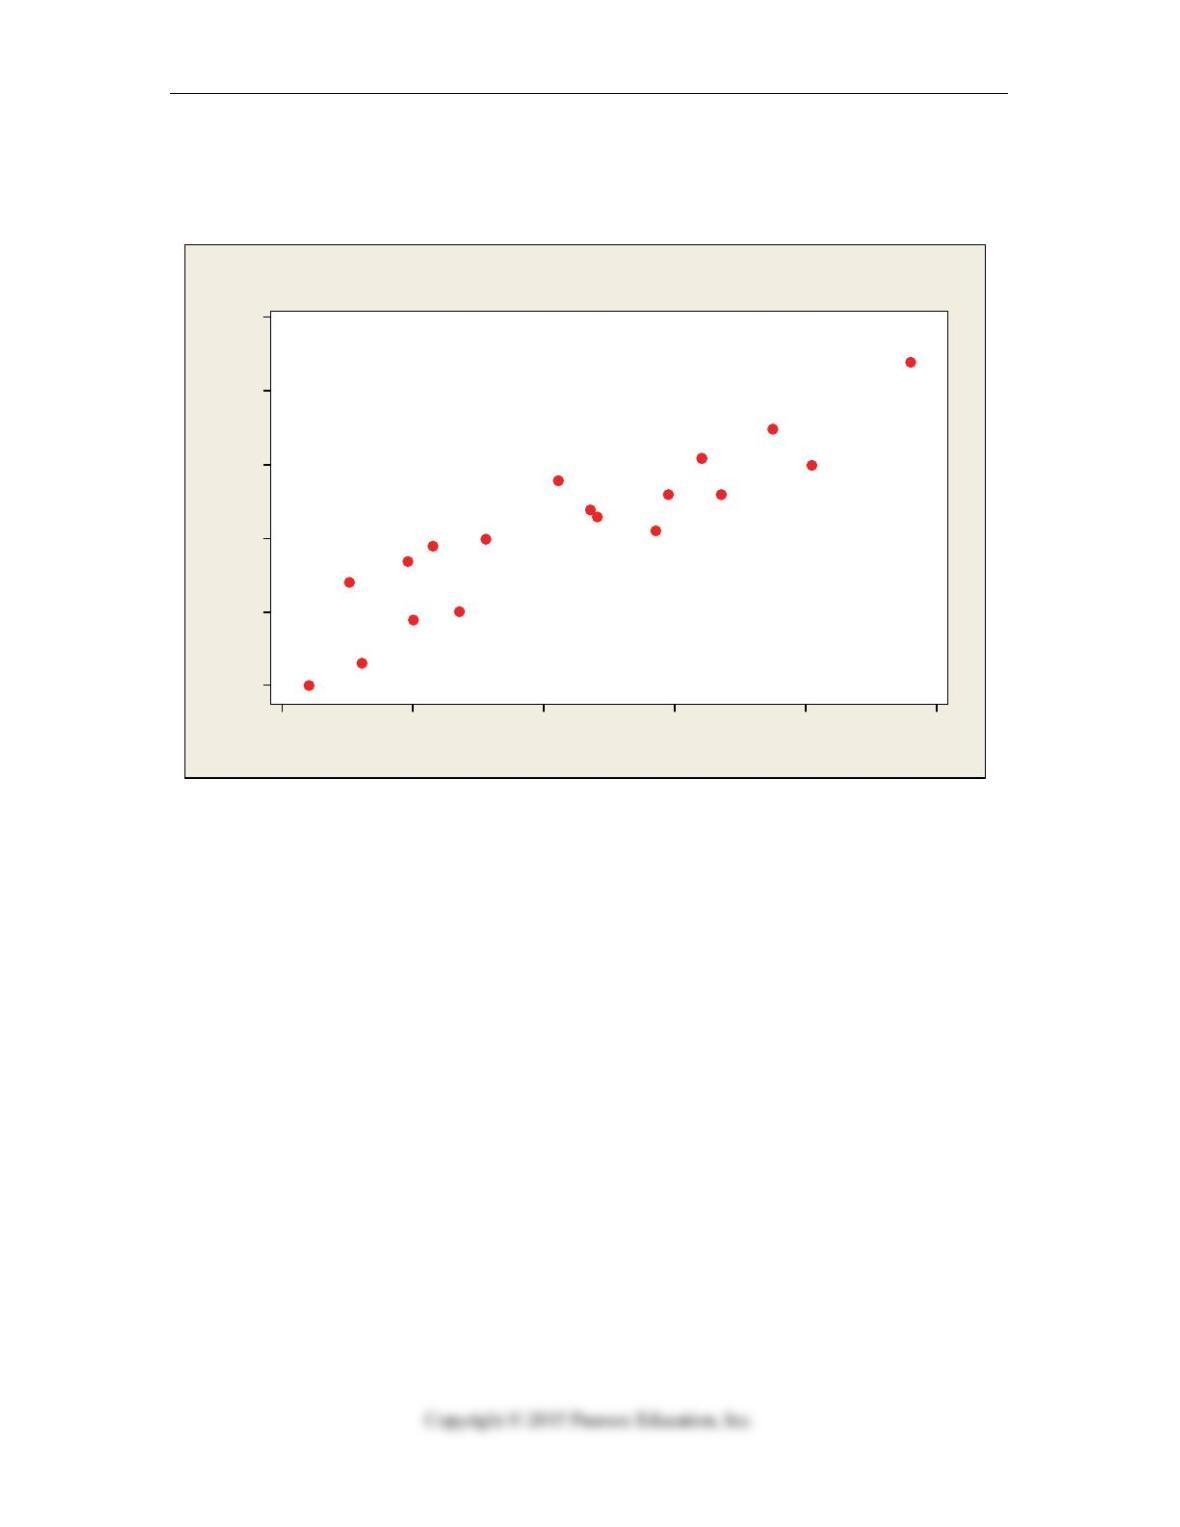
6. The following scatterplot shows monthly sales figures (in units) and number of
months of experience on the job for a sample of 19 salespeople. Estimate the correlation.
100806040200
80
70
60
50
40
30
Exper ience
Sales
Scatterplot of Sales vs Experience
A. -0.3
B. +0.7
C. -0.7
D. +0.3
E. 0.0
Test A IA-5
Chapter 4: Make a scatterplot to display the relationship between two quantitative
variables.
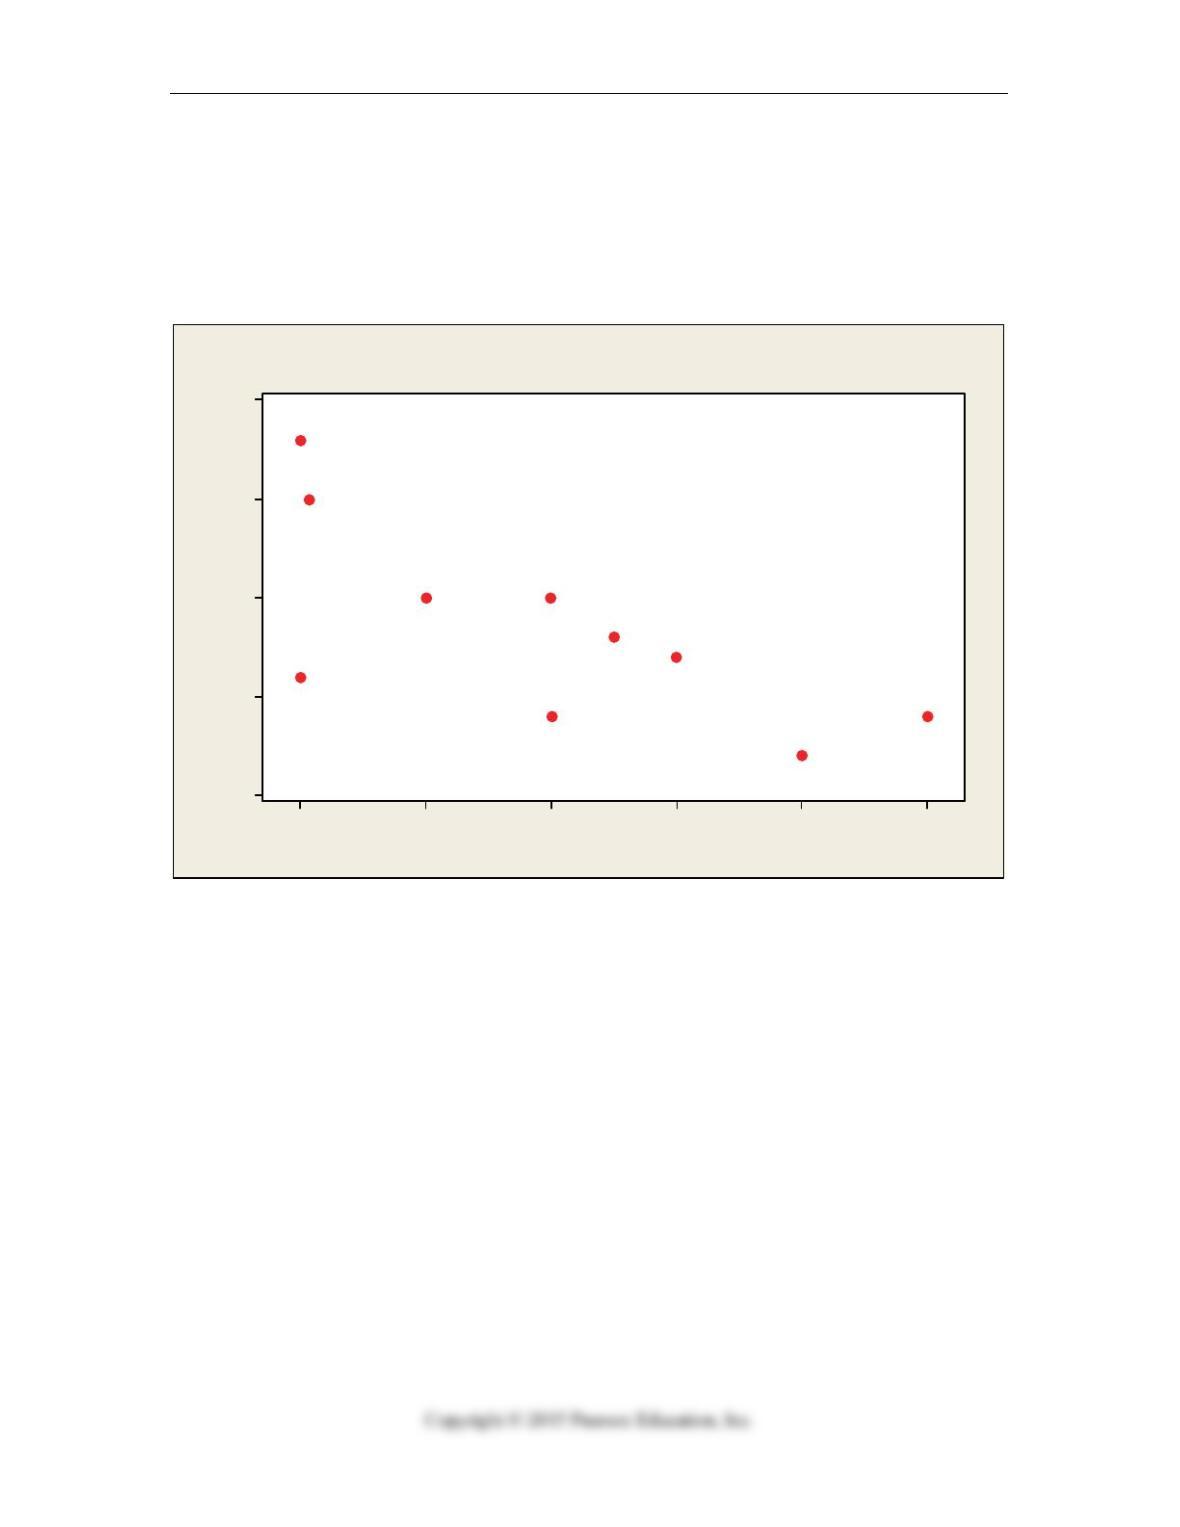
7. A consumer research group investigating the relationship between the price of meat
(per pound) and the fat content (grams) gathered data that produced the following
scatterplot. Which description of the association between fat content and price is more
accurate?
12108642
20
15
10
5
0
Price/lb
Fa t Gr a ms
Scatterplot of Fat Grams vs Price/lb
A. If the point ($2.00 per pound, 6 grams of fat) is removed, the correlation will be
higher.
B. If the point ($2.00 per pound, 6 grams of fat) is removed, the correlation will be
lower.
C. Increased fat content generally results in decreased price/lb.
D. Both B and C
E. Both A and C
IA-6 Part I: Exploring and Collecting Data
Chapter 1: Examine and use contingency tables.
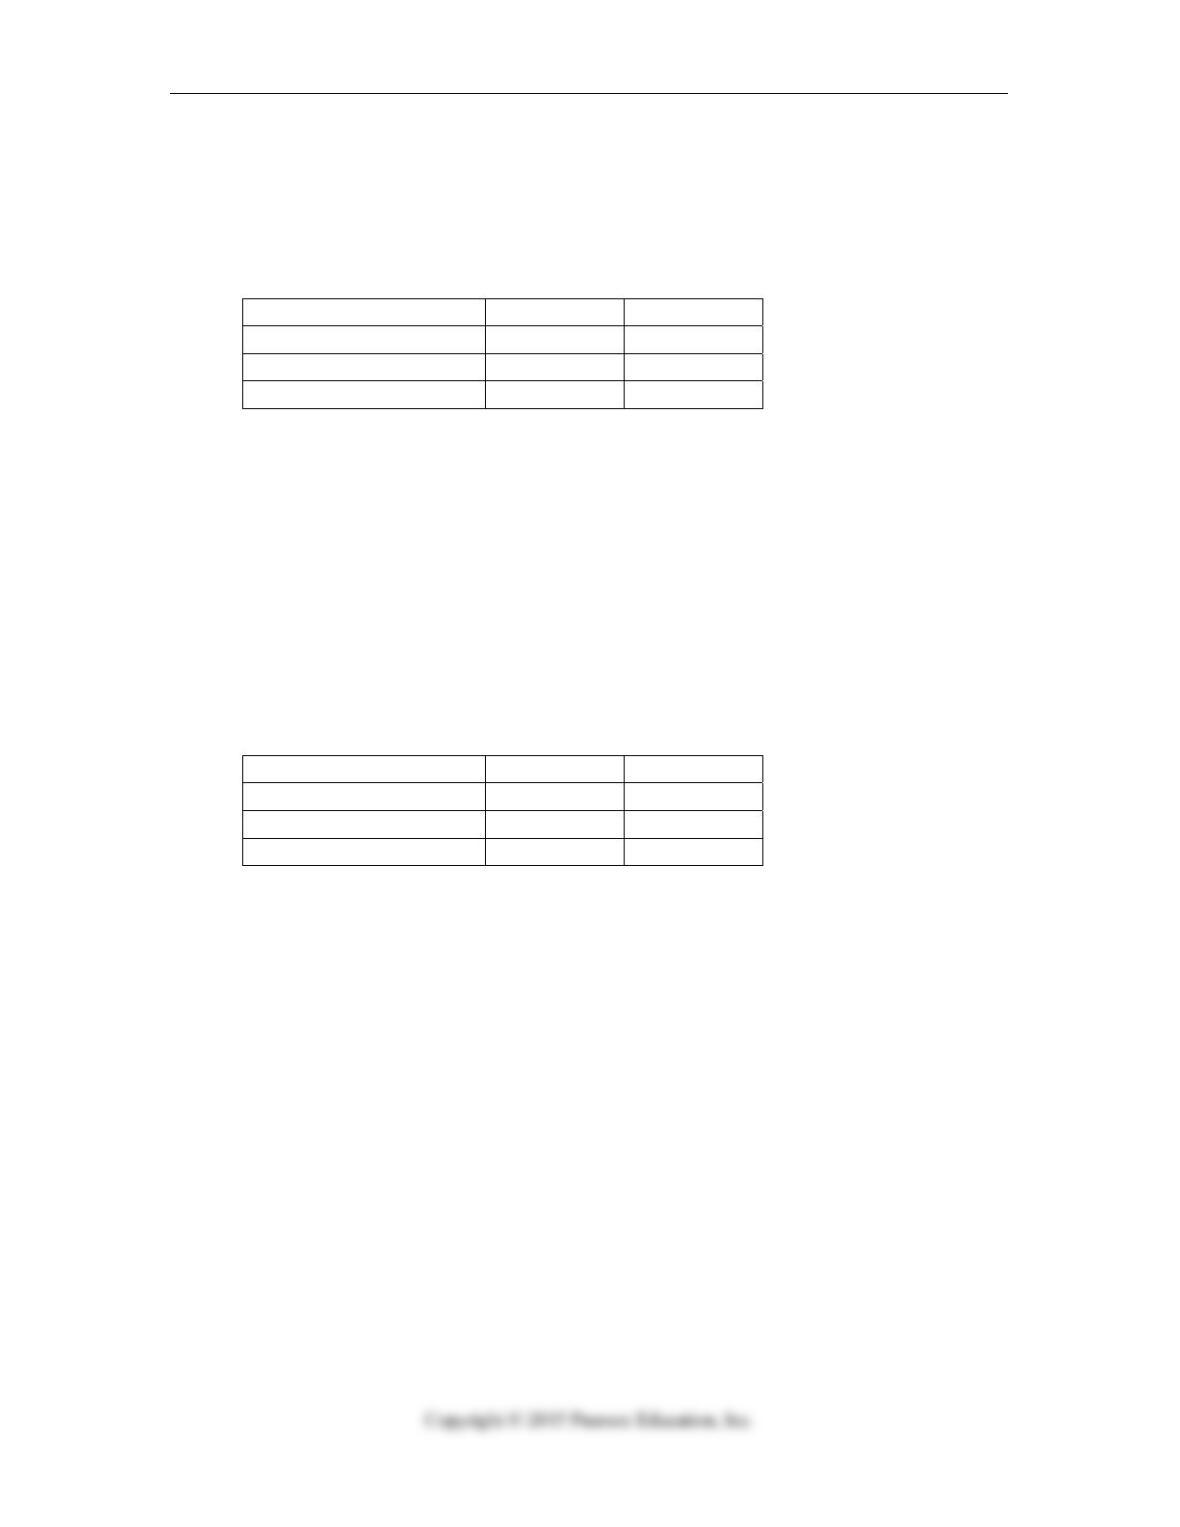
8. A magazine that publishes product reviews conducted a survey of teenagers’
preferences for cell phones. Three brands of cell phone designed specifically with teens
in mind were the focus of the study. The table summarizes responses by brand and
gender. What percent of teenagers preferred LG Rumor?
Cell Phone Male Female
LG Rumor 55 87
Sidekick LX 99 150
BlackJack II 196 113
A. 50%
B. 41%
C. 25%
D. 16%
E. 20%
Chapter 1: Examine and use contingency tables.
9. A magazine that publishes product reviews conducted a survey of teenagers’
preferences for cell phones. Three brands of cell phone designed specifically with teens
in mind were the focus of the study. The table summarizes responses by brand and
gender. What percent of female teenagers preferred the Sidekick LX?
Cell Phone Male Female
LG Rumor 55 87
Sidekick LX 99 150
BlackJack II 196 113
A. 43%
B. 60%
C. 21%
D. 50%
E. 16%
Test A IA-7
Chapter 2: Find conditional and marginal distributions and make comparisons.
10. A magazine that publishes product reviews conducted a survey of teenagers’
preferences for cell phones. Three brands of cell phone designed specifically with teens
in mind were the focus of the study. The table summarizes responses by brand and
gender. What percent of teenagers who preferred the BlackJack II were males?
Cell Phone Male Female
LG Rumor 55 87
Sidekick LX 99 150
BlackJack II 196 113
A. 63%
B. 32%
C. 16%
D. 50%
E. 41%
Chapter 2: Determine if displays of data are appropriate.
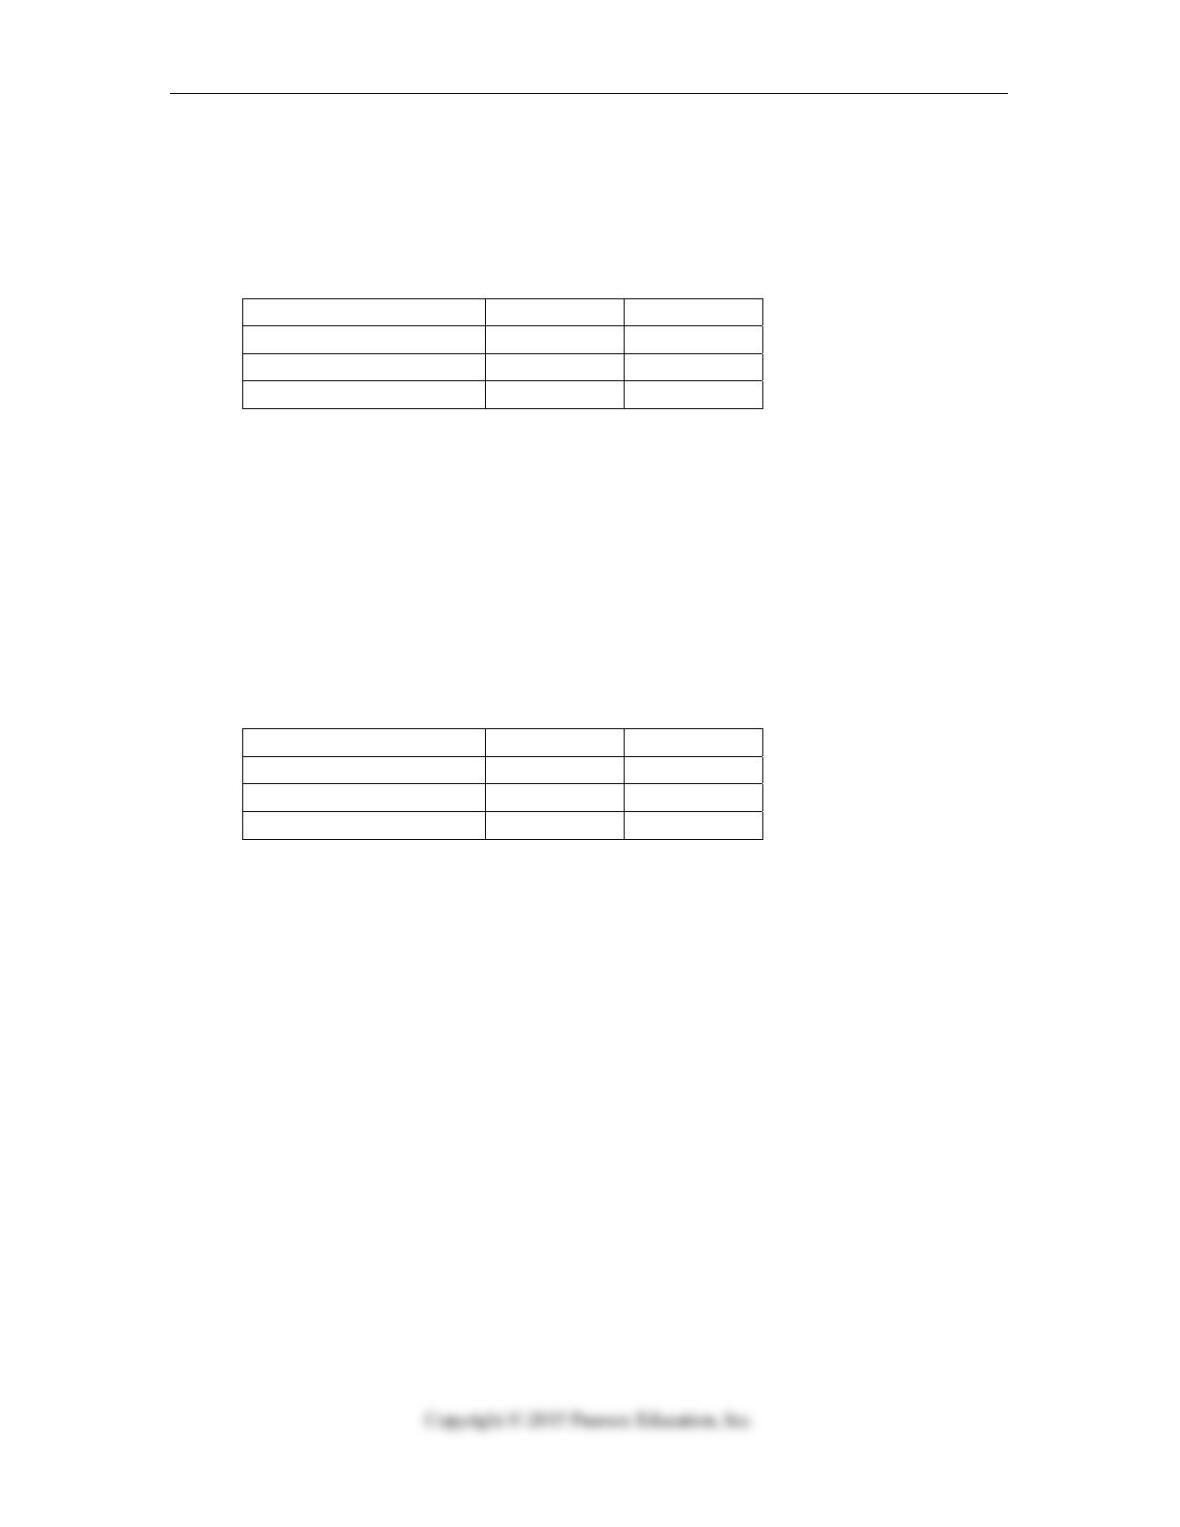
11. An advocacy group is investigating whether gender has an effect on job category
in large investment firms. She surveyed a sample of firms with the results shown below.
The most appropriate display for these data is a
Job Category Male Female
Clerical / Technical 85 215
Professional Staff 720 480
Executive / Managerial 400 100
A. histogram.
B. stem and leaf display.
C. boxplot.
D. segmented bar chart.
E. frequency table.
IA-8 Part I: Exploring and Collecting Data
Chapter 2: Determine if displays of data are appropriate.
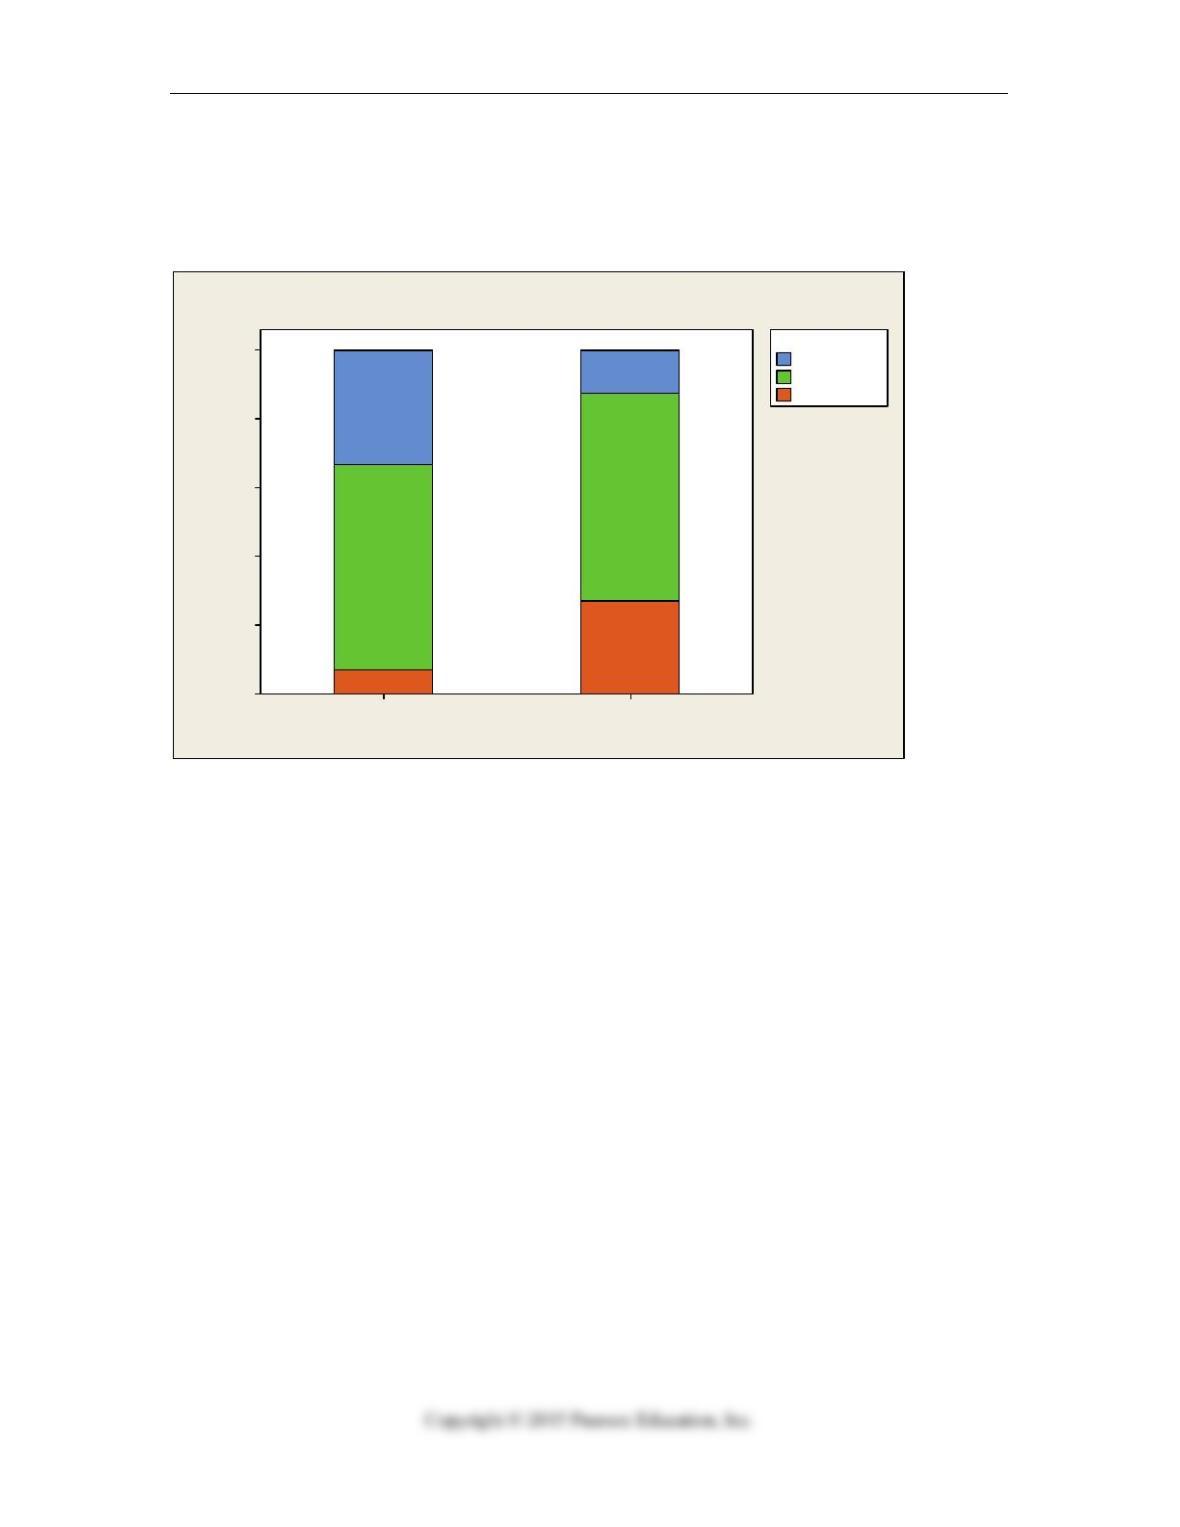
12. An advocacy group is investigating whether gender has an effect on job category in
large investment firms. She surveyed a sample of firms with the results shown below.
Which of the following statements is true about gender and job category?
FemaleMale
100
80
60
40
20
0
Data
Executiv e
Professional
Clerical
Job Category
Job Category by Gender
Percent within variables.
A. A greater percentage of males are executives compared to females.
B. A greater percentage of females are executives compared to males.
C. Job category appears to be independent of gender.
D. A smaller percentage of females are clerical compared to males.
E. The segmented bar chart is not appropriate for these data.
Chapter 3: Find summary statistics; create displays; describe distributions; determine
appropriate measures.
13. A manufacturer of cable wire periodically selects samples to monitor the process. A
sample of ten wires is selected and the diameters (in cm.) are 0.493, 0.534, 0.527, 0.511,
0.565, 0.559, 0.519, 0.562, 0.551, and 0.530. The mean diameter is
A. 0.455 cm.
B. 0.535 cm.
C. 0.511 cm.
D. 0.565 cm.
E. 0.499 cm.
Test A IA-9
Chapter 3: Find summary statistics; create displays; describe distributions; determine
appropriate measures.
14. A manufacturer of cable wire periodically selects samples to monitor the process. A
sample of ten wires is selected and the diameters (in cm.) are 0.493, 0.534, 0.527, 0.511,
0.565, 0.559, 0.519, 0.562, 0.551, and 0.530. The standard deviation is
A. 0.455 cm.
B. 0.005 cm.
C. 0.045 cm.
D. 0.024 cm.
E. 0.099 cm.
Chapter 2: Create and use frequency and relative frequency distributions and their
displays.
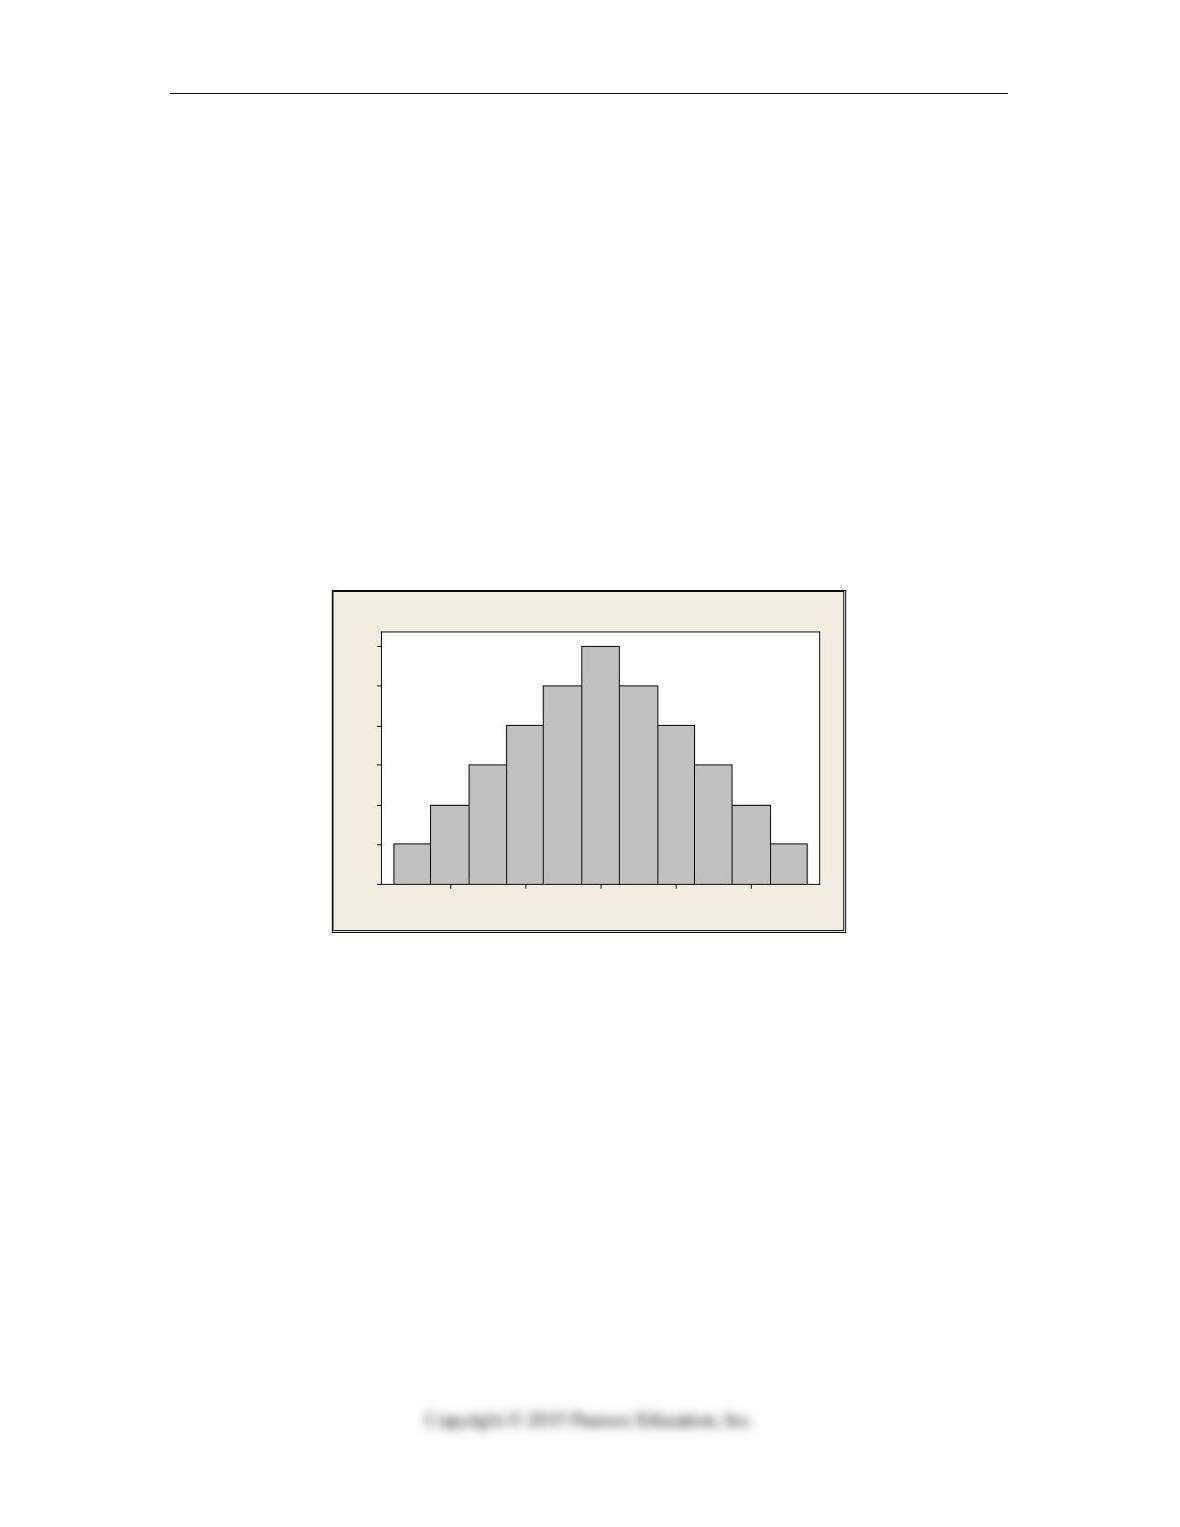
15. Which is true of the data shown in the histogram?
Dat a
Fr e q u e nc y
420-2-4
6
5
4
3
2
1
0
Histogram of Data
I. The distribution is approximately symmetric.
II. The mean and median are approximately equal.
III. The median and IQR summarize the data better than the mean and standard
deviation.
A. I only
B. III only
C. I and II
D. I and III
E. I, II and III
IA-10 Part I: Exploring and Collecting Data
Chapter 3: Find summary statistics; create displays; describe distributions; determine
appropriate measures.
16. Prices per share of the 20 most actively traded stocks on the New York Stock
Exchange in October, 2012. Summary statistics for these data are shown below. The
IQR for this set of dataset is
Min Q1 Median Q3 Max Mean SD
2.0 7.5 15.5 34.5 85.0 4.67 20.9
A. 83
B. 27
C. 13.5
D. 69.5
E. None of the above
Chapter 2: Create and use frequency and relative frequency distributions and their
displays.
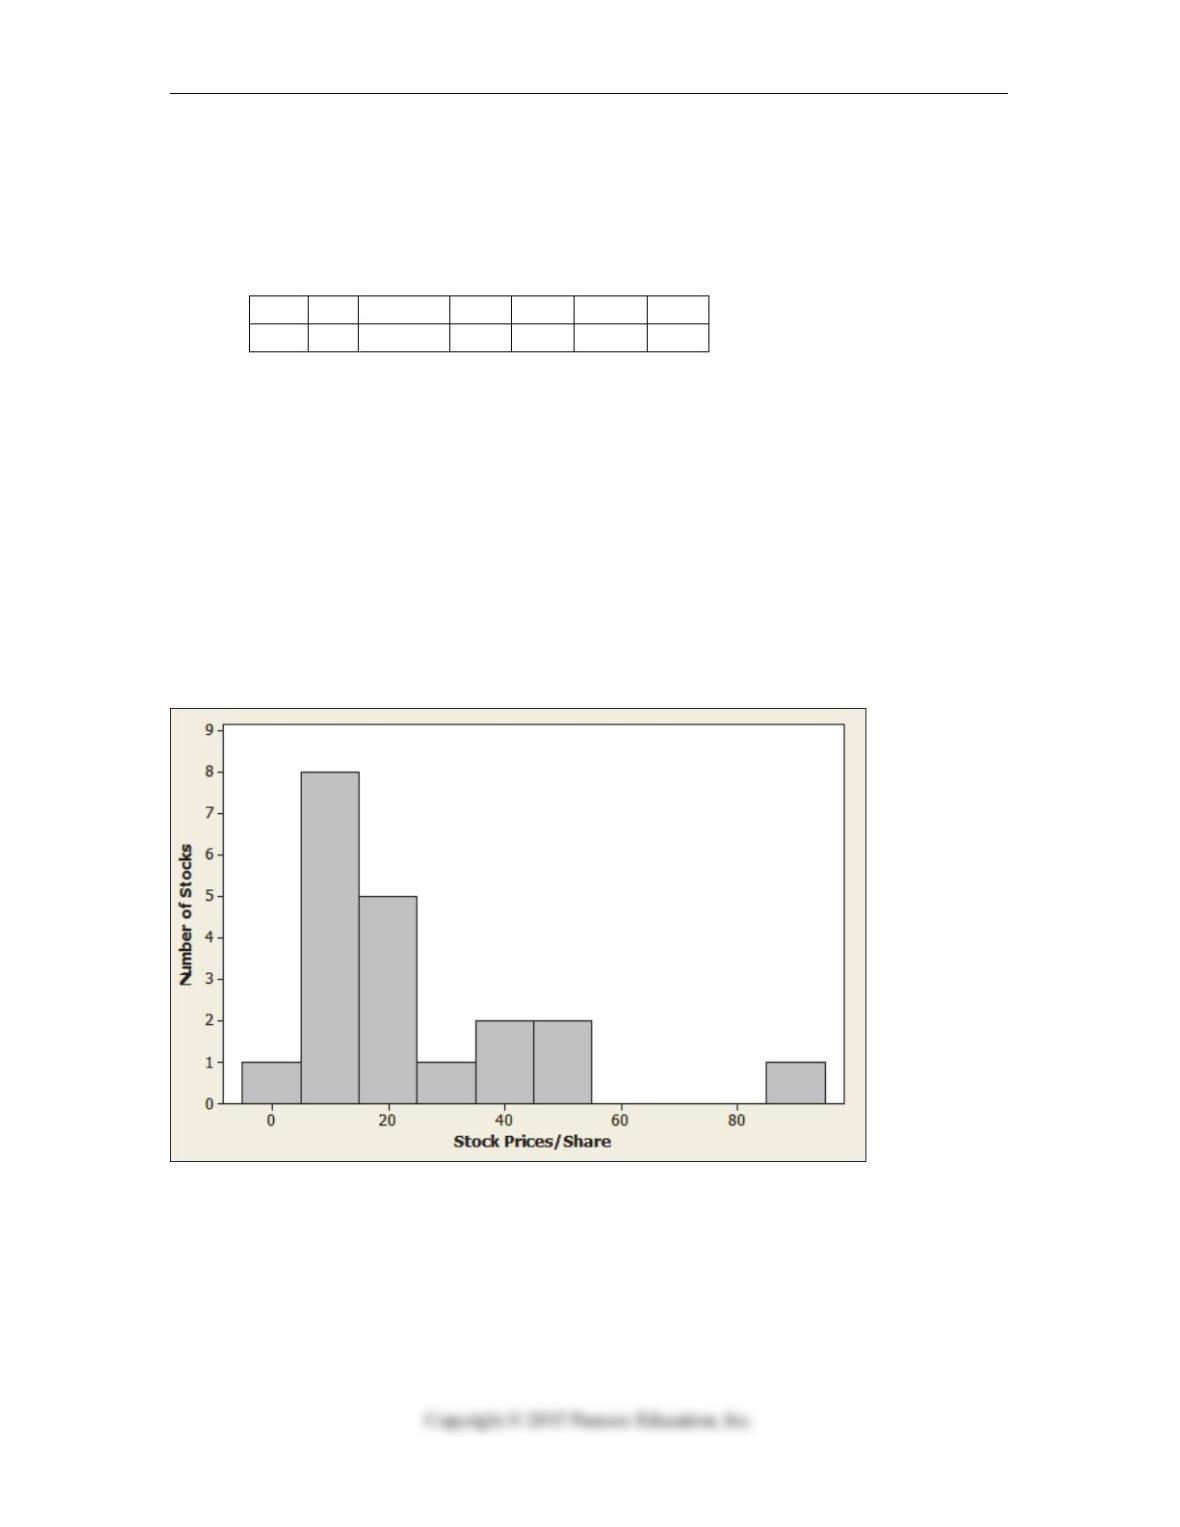
17. Prices per share of the 20 most actively traded stocks on the New York Stock
Exchange in October, 2012. A histogram for these data are shown below.
The data can be described as
A. The data are skewed to the left with a large positive outlier.
B. 5.9 %
C. 17.9 %
D. The data are skewed to the right with a large positive outlier.
E. 13.4 %
Test A IA-11
Chapter 2: Create and use frequency and relative frequency distributions and their
displays.
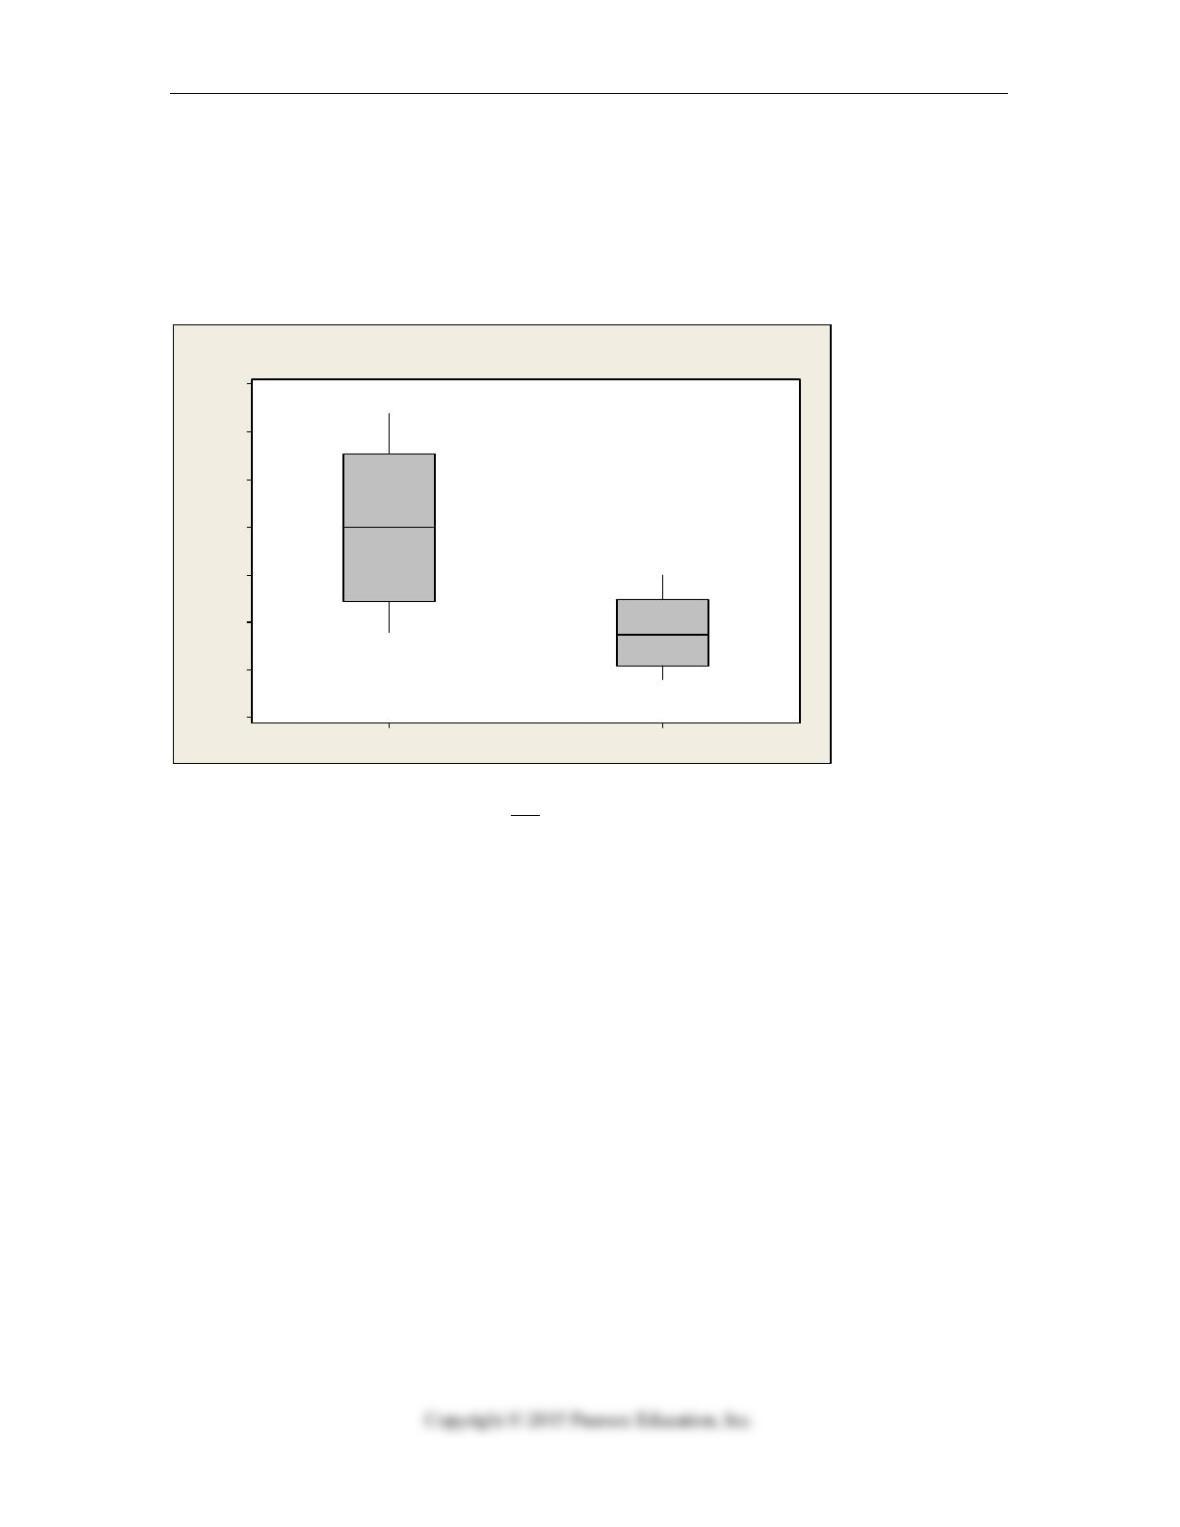
18. An office supply chain has stores in two locations, Dayton and Scranton. One of
these stores is to be closed within the coming year, and to help make the decision,
management reviews sales data. Below are boxplots for monthly unit sales for both
locations.
ScrantonDayton
225
200
175
150
125
100
75
50
Data
Boxplot of Dayton, Scranton
Which of the following statement is not correct?
A. Monthly sales are higher in Dayton compared to Scranton.
B. The IQR for sales in Dayton is larger than that for Scranton.
C. Monthly sales are less variable in Scranton compared to Dayton.
D. Both distributions are fairly symmetric.
E. Monthly sales are more variable in Scranton compared to Dayton.

IA-12 Part I: Exploring and Collecting Data
Chapter 2: Create and use frequency and relative frequency distributions and their
displays.
19. Below is a stem and leaf display of prices for a sample homes recently sold in a
metropolitan area in the southeastern region of the U.S.
Stem-and-Leaf Display: Home Prices
Stem-and-leaf of Home Prices N = 13
Leaf Unit = 10000
4 1 5788
(4) 2 0123
5 2 89
3 3 0
2 3 5
1 4 0
Which of the following statements is true?
A. The mean would be more appropriate than the median to describe the center of
this distribution.
B. This distribution is fairly symmetric.
C. This distribution is right skewed.
D. This distribution is left skewed.
E. Both A and C
Chapter 3: Standardize values and use them for comparisons of otherwise disparate
variables.
20. Suppose a sample of 60 business majors revealed that the average time spent
studying per week is 22 hours with a standard deviation of 4 hours. For one student
reporting that he studies 16 hours per week, the corresponding z score is
A. -1.5
B. 1.5
C. 2.2
D. -2.2
E. -3.0
Chapter 4: Summarize the strength of a linear relationship with a correlation, r.
21. A correlation of zero between two quantitative variables means that
A. We have done something wrong in our calculation of r.
B. There is no association between the two variables.
C. There is no linear association between the two variables.
D. Re-expressing the data will guarantee a linear association between the two
variables.
E. None of the above

Test A IA-13
Chapter 4: Model a linear relationship with a least squares regression model.
22. A regression analysis of company profits and the amount of money the company
spent on advertising produced a R2 = 0.72. Which of these is true?
I. This model can correctly predict the profit for 72% of companies.
II. 72% of the variance in company profit can be accounted for by the model.
III. On average, companies spend about 72% of their profits on advertising.
A. None
B. I only
C. II only
D. III only
E. I and III

IA-14 Part I: Exploring and Collecting Data
Business Statistics: Part I: Exploring and Collecting Data – Test A – Key