1) the point during an action potential when the inside of the cell has become more
positive than the outside is known as the
a) depolarization.
b) rising phase.
c) falling phase.
d) overshoot.
e) peak.
2) the ion necessary to initiate the release of acetylcholine into the synaptic cleft is
a) sodium.
b) potassium.
c) calcium.
d) chloride.
e) zinc.
3) if a cell lacked lysosomes, it would not be able to
a) synthesize lipids.
b) produce enzymes.
c) digest cellular wastes and bacteria.
d) destroy h2o2.
e) transport water-soluble molecules.
4) during the synthesis of proteins, amino acids are assembled in the proper sequence
because the trna molecules that bring them to the ribosome have a(n) ________ that is
complementary to a specific codon in the mrna.
5) an enzyme that transfers phosphates from atp to a substrate molecule is a
a) hydrolase.
b) lipase.
c) transferase.
d) ligase.
e) kinase.
6) nutrients undergo the last stages of digestion by enzymes located on the cells of the
small intestine; then the nutrients are absorbed by these same cells by way of various
membrane transport processes. adipose cells absorb and store excess food energy in the
form of fat. you and the other students in the physiology lab you are taking are doing an
analysis of cell membrane composition, on unknown animal tissue samples labeled a
and b. all lab groups determined that sample a contained, on average, 81% protein, 18%
lipid, and 1% carbohydrate. sample b contained 85% lipid, 10% protein, and 5%
carbohydrate. sketch a graph of the class data. you now have to make a logical
conclusion as to which sample is more likely to be intestine and which is adipose tissue.
what do you conclude, and why?
7) which of these will increase the heart rate?
a) only sympathetic stimulation to the sa node
b) only the application of epinephrine to the sa node
c) only the application of acetylcholine to the sa node
d) both sympathetic stimulation and application of epinephrine to the sa node
e) both sympathetic stimulation and application of acetylcholine to the sa node
8) the volume of blood ejected from each ventricle during a contraction is called the
a) end-diastolic volume.
b) end-systolic volume.
c) stroke volume.
d) cardiac output.
e) cardiac reserve.

9) contents in the peritubular capillaries are actively transported into proximal and
distal convoluted tubules in a process known as:
a) excretion
b) filtration
c) reabsorption
d) secretion
10) match the ploidy with a cell stage.
a. haploid
b. diploid
primary spermatocyte or oocyte
11) an enzyme that adds or subtracts water molecules is a
a) hydrolase.
b) lipase.
c) transferase.
d) ligase.
e) kinase.
12) match the name of the pathological condition with its description.
a. hereditary spherocytosis
b. polycythemia vera
c. iron-deficiency anemia
d. sickle cell disease
e. anemia
general term for the condition of low hemoglobin in the blood
13) when an enzyme reaches its saturation point,
a) the amount of substrate for the enzyme to act upon is very high.
b) the amount of substrate for the enzyme to act upon is very low.
c) the amount of product produced continues to increase.
d) the amount of product produced by the enzyme decreases.
e) the amount of substrate for the enzyme to act upon is very low and the amount of
product produced by the enzyme decreases.
14)
following is a table of data collected from one section of an 8 a.m. physiology lab. there
were 20 students present, 10 men and 10 women. information collected from the
students included their height, weight, age, and resting pulse rate. in addition, the
students were surveyed to see if they smoked cigarettes, considered themselves “regular
exercisers,” if they had consumed caffeine the morning of the lab, and if they had eaten
breakfast that day. a “y” or “n” (yes or no) was recorded to indicate their answers. each
student did “jumping jacks” for 5 minutes and recorded the time required to regain their
resting heart rate, which is listed on the table as “recovery time.” finally, each student
participated in an exercise designed to measure their reaction time (in milliseconds) in
catching an object dropped by a lab partner according to specified criteria. use this table
to answer the following questions. ignore statistical problems caused by small sample
size, and so on.
table 1.3
refer to table 1.3 and the bar graph.
a. write a hypothesis regarding gender and weight.
b. what is the dependent variable? what is the independent variable?
c. based on the data in the graph above, what is your conclusion?
d. why is a bar graph a good choice for presentation of these data? would another type
of chart be as effective?
15) the embryo forms from the
a) placenta.
b) morula.
c) inner cell mass of the blastocyst.
d) outer layer of the blastocyst.
e) zona pellucida.

16) apoptosis and necrosis are described as the two ways cells die. which one is
“messy”? which is “tidy”? explain. why do these forms of cell death exist? what are
some advantages and/or disadvantages of each? use the lining cells of the digestive tract
in an example of an advantageous process.
17) two hormones that have opposing effects are called ________.
18) in order to contract and relax, muscle cells require energy in the form of ________.
the immediate backup energy source is ________ that requires the enzyme ________.
19) you and your lab partners in a human anatomy course have just removed the
intestines from an adult cadaver, and cut away connective tissues as necessary to uncoil
the intestines into a straight line that could be measured. your professor told you that
the intestinal tract of an adult of this size and gender is typically about 13 ft. your
measurement is 22 ft. one of the lab partners insists that everything is smaller in
preserved cadavers due to dehydration. address this suggestion, and propose some other
explanations for the difference.
20) define and describe the role of up-regulation and down-regulation of proteins.
21) compare and contrast inflammation and infection.
22) greater visual acuity results from convergence of ________ numbers of
photoreceptors onto retinal ganglion cells.
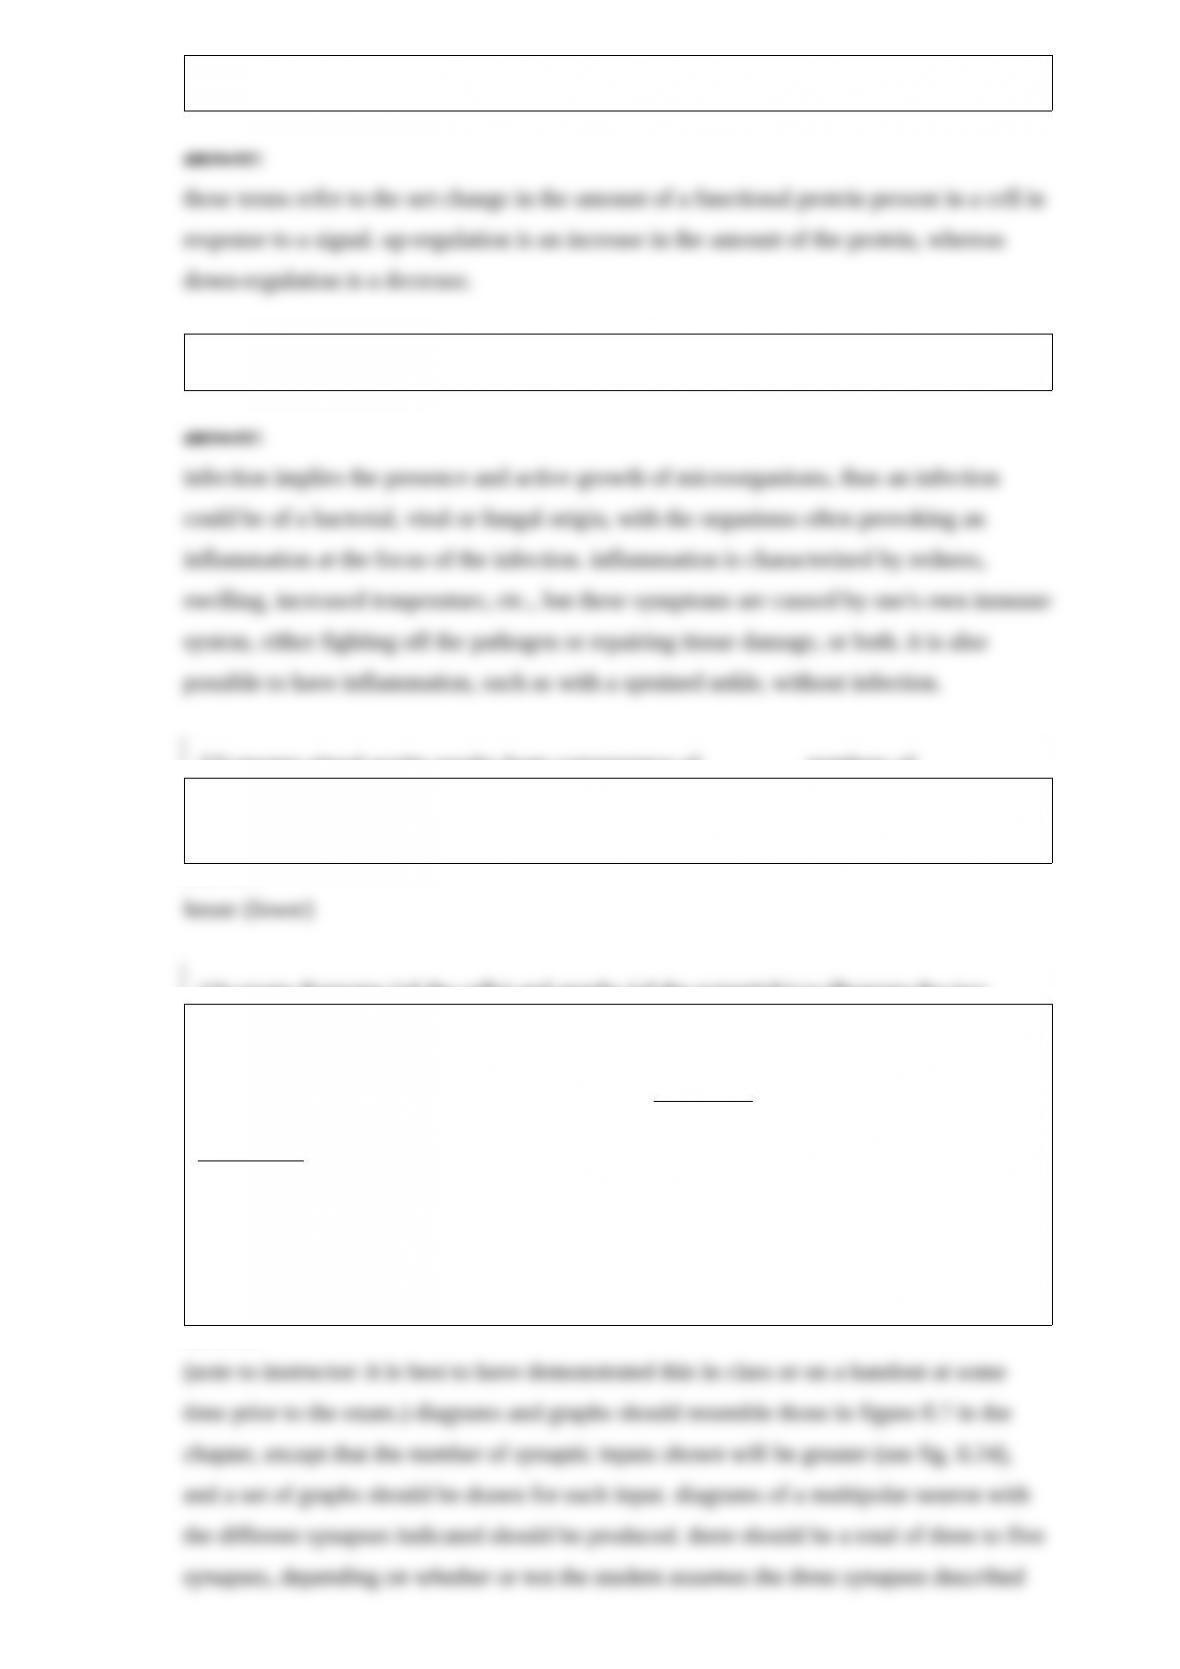
23) create diagrams (of the cells) and graphs (of the potentials) to illustrate the two
different situations described below in a multipolar neuron with a threshold voltage of
15 mv above resting potential. in each, indicate decrement of graded potentials (by
drawing the same gp at different points as it spreads along the neuron), as well as
summation.
situation 1: there are three simultaneously active synapses on the multipolar neuron,
two producing epsps and one an ipsp. at least one of the epsps is larger than 15 mv at
the synapse. the neuron does not generate an action potential.
situation 2: there are two simultaneously active synapses, one producing an epsp and
the other an ipsp. the neuron generates an action potential.