Section 6.3
Use Practice Data Set 1 in Appendix B to solve this problem. We believe that young
individuals have lower mathematics skills than older individuals. We would test this
hypothesis by comparing participants 25 or younger (the “young” group) with participants
26 or older (the “old” group). Hint: You may need to create a new variable that represents
each age group. See Chapter 2 for help.
Section 6.4
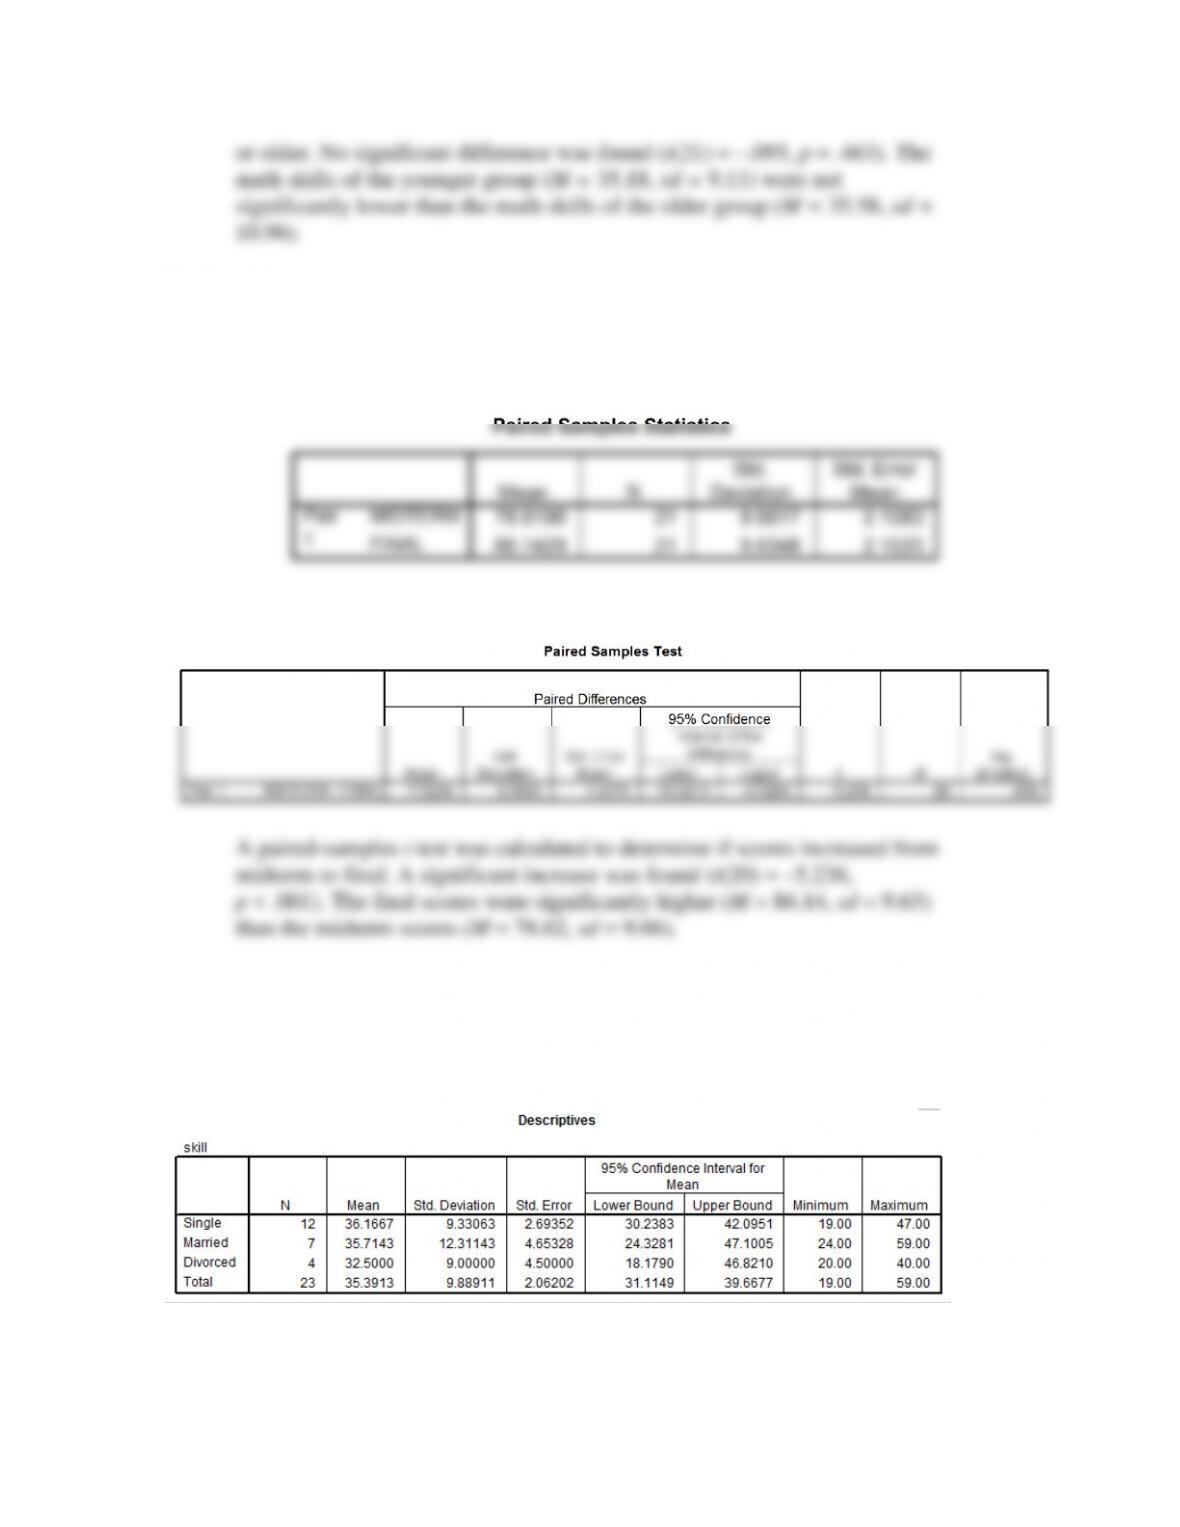
Use the same GRADES.sav data file, and compute a paired-samples t test to determine if
scores increased from midterm to final.
Section 7.2
Use Practice Data Set 1 in Appendix B. Determine if the average math scores of single,
married, and divorced participants are significantly different. Write a statement of results.
Section 7.3
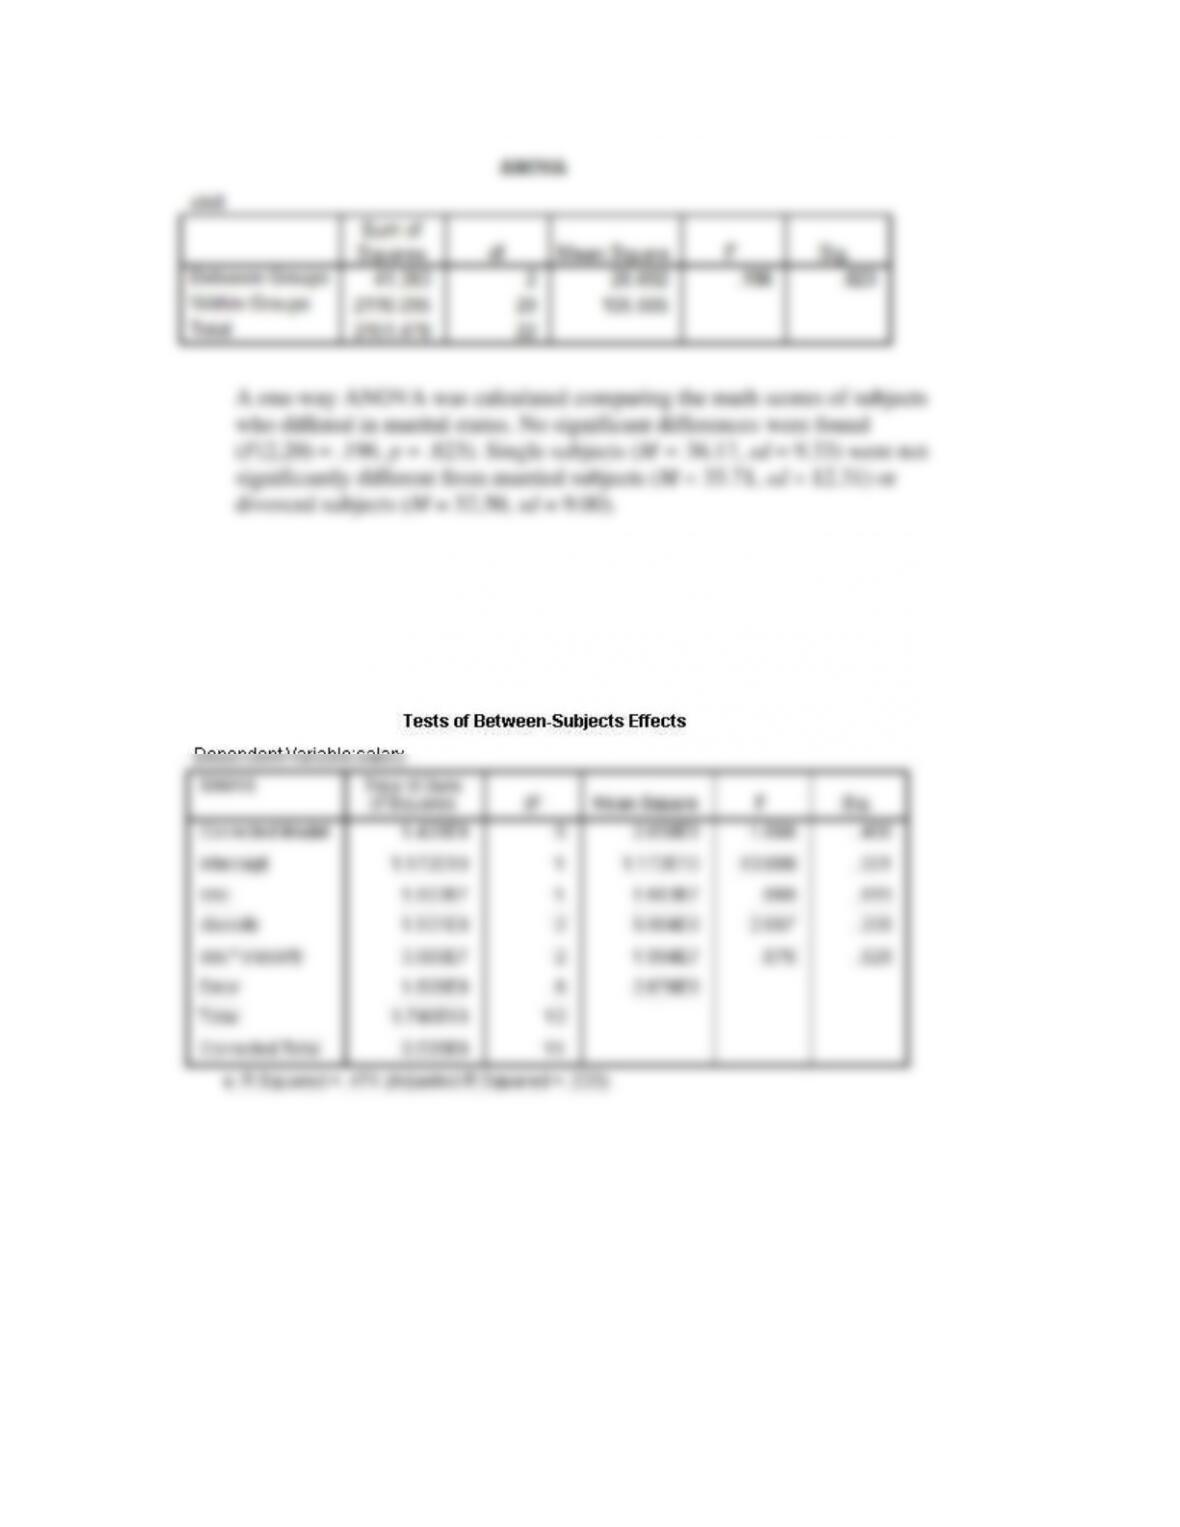
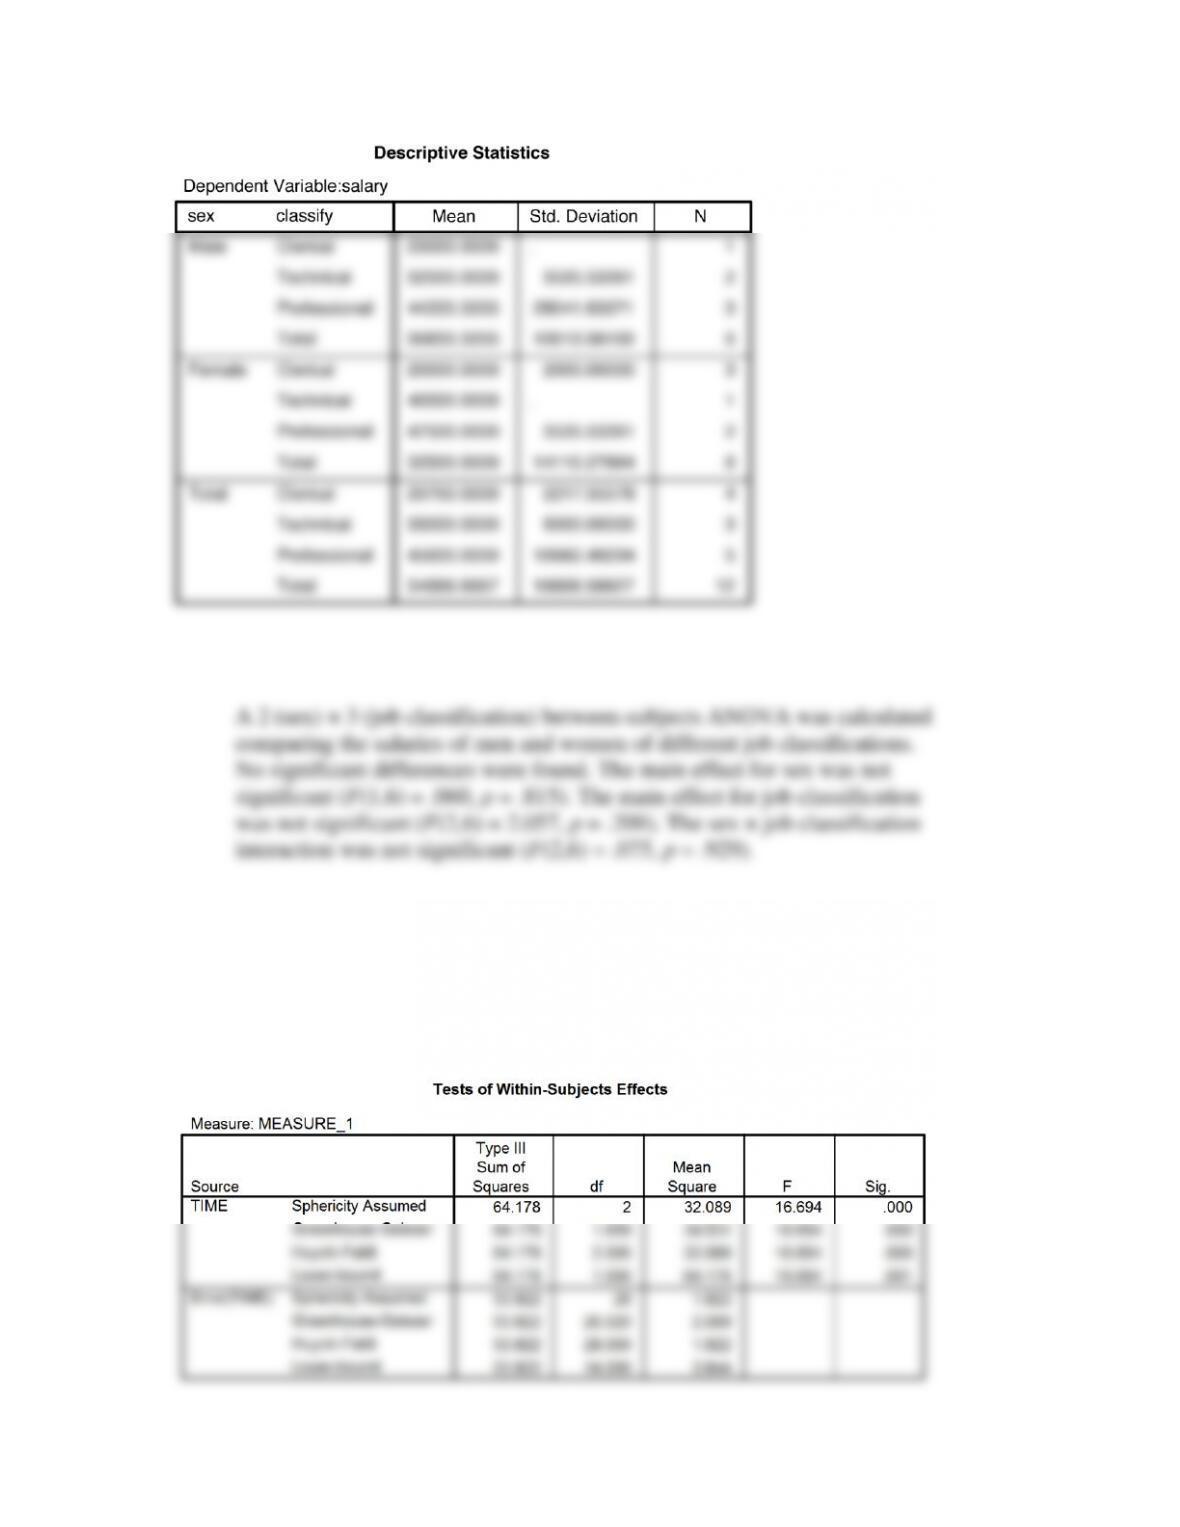
Use Practice Data Set 2 in Appendix B. Determine if salaries are influenced by sex, job
classification, or an interaction between sex and job classification. Write a statement of
results.
Section 7.4
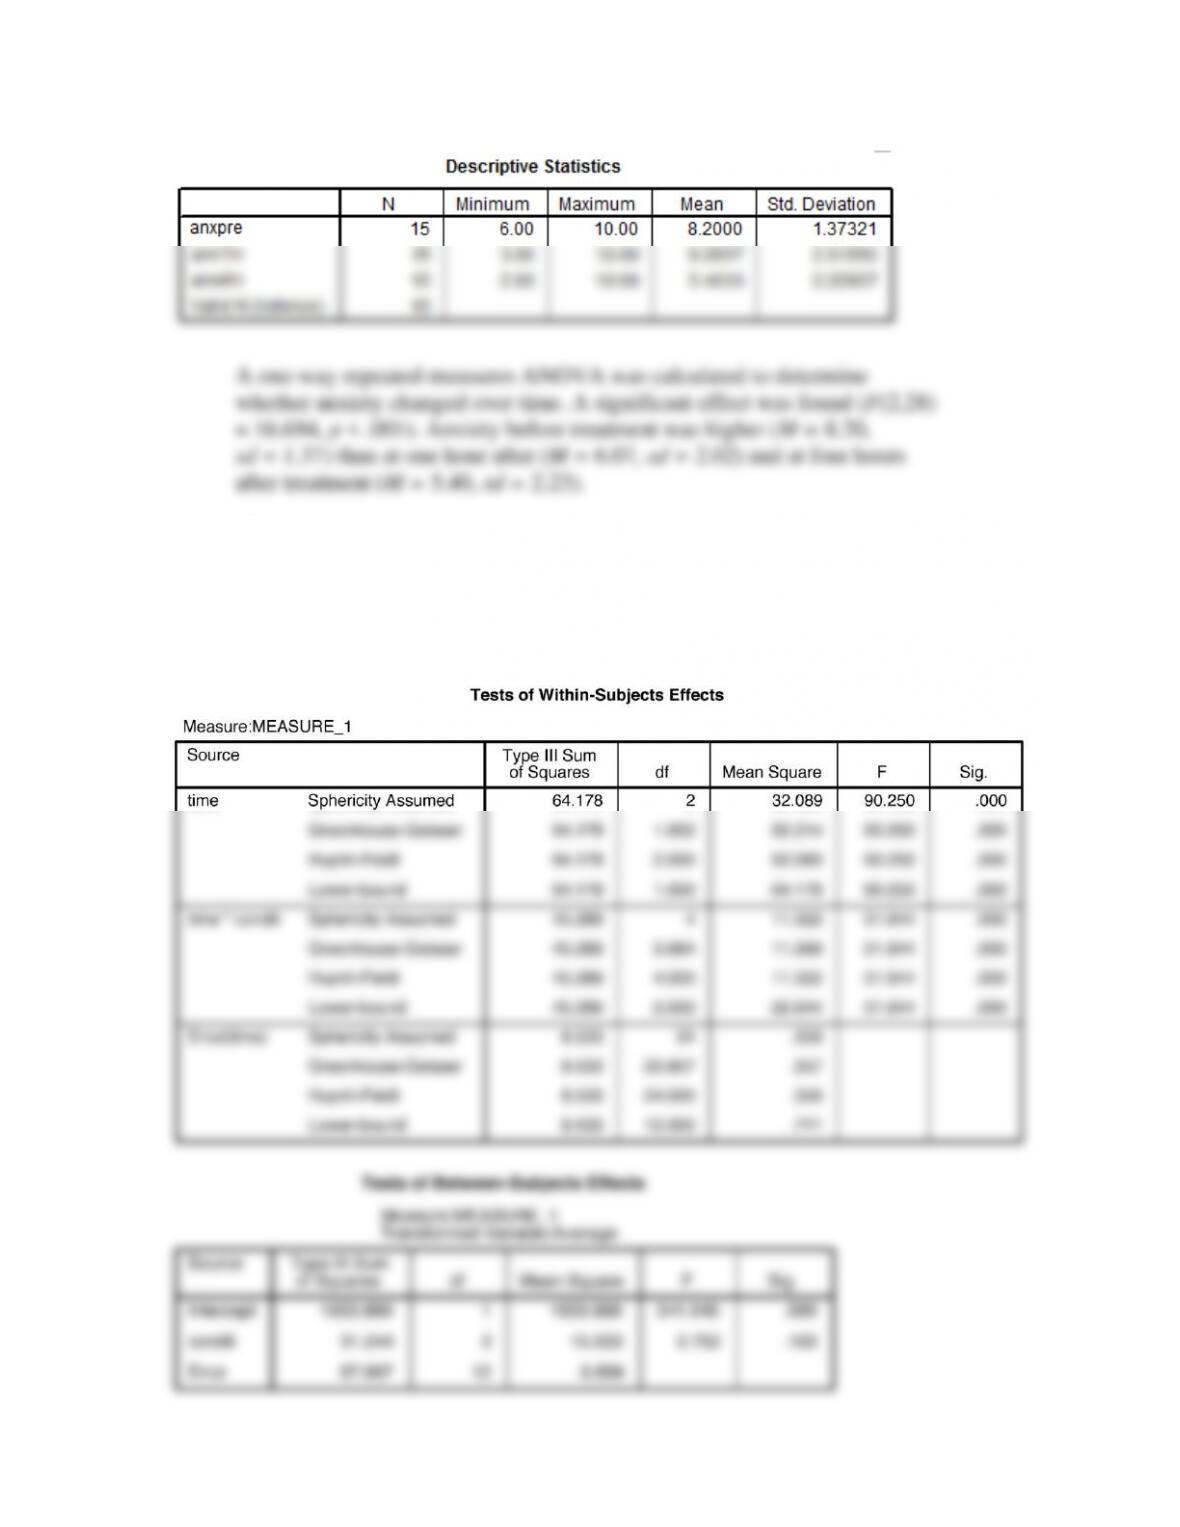
Use Practice Data Set 3 in Appendix B. Determine if the anxiety level of participants
changed over time (regardless of which treatment they received) using a one-way repeated-
measures ANOVA and protected dependent t tests. Write a statement of results.
Section 7.5
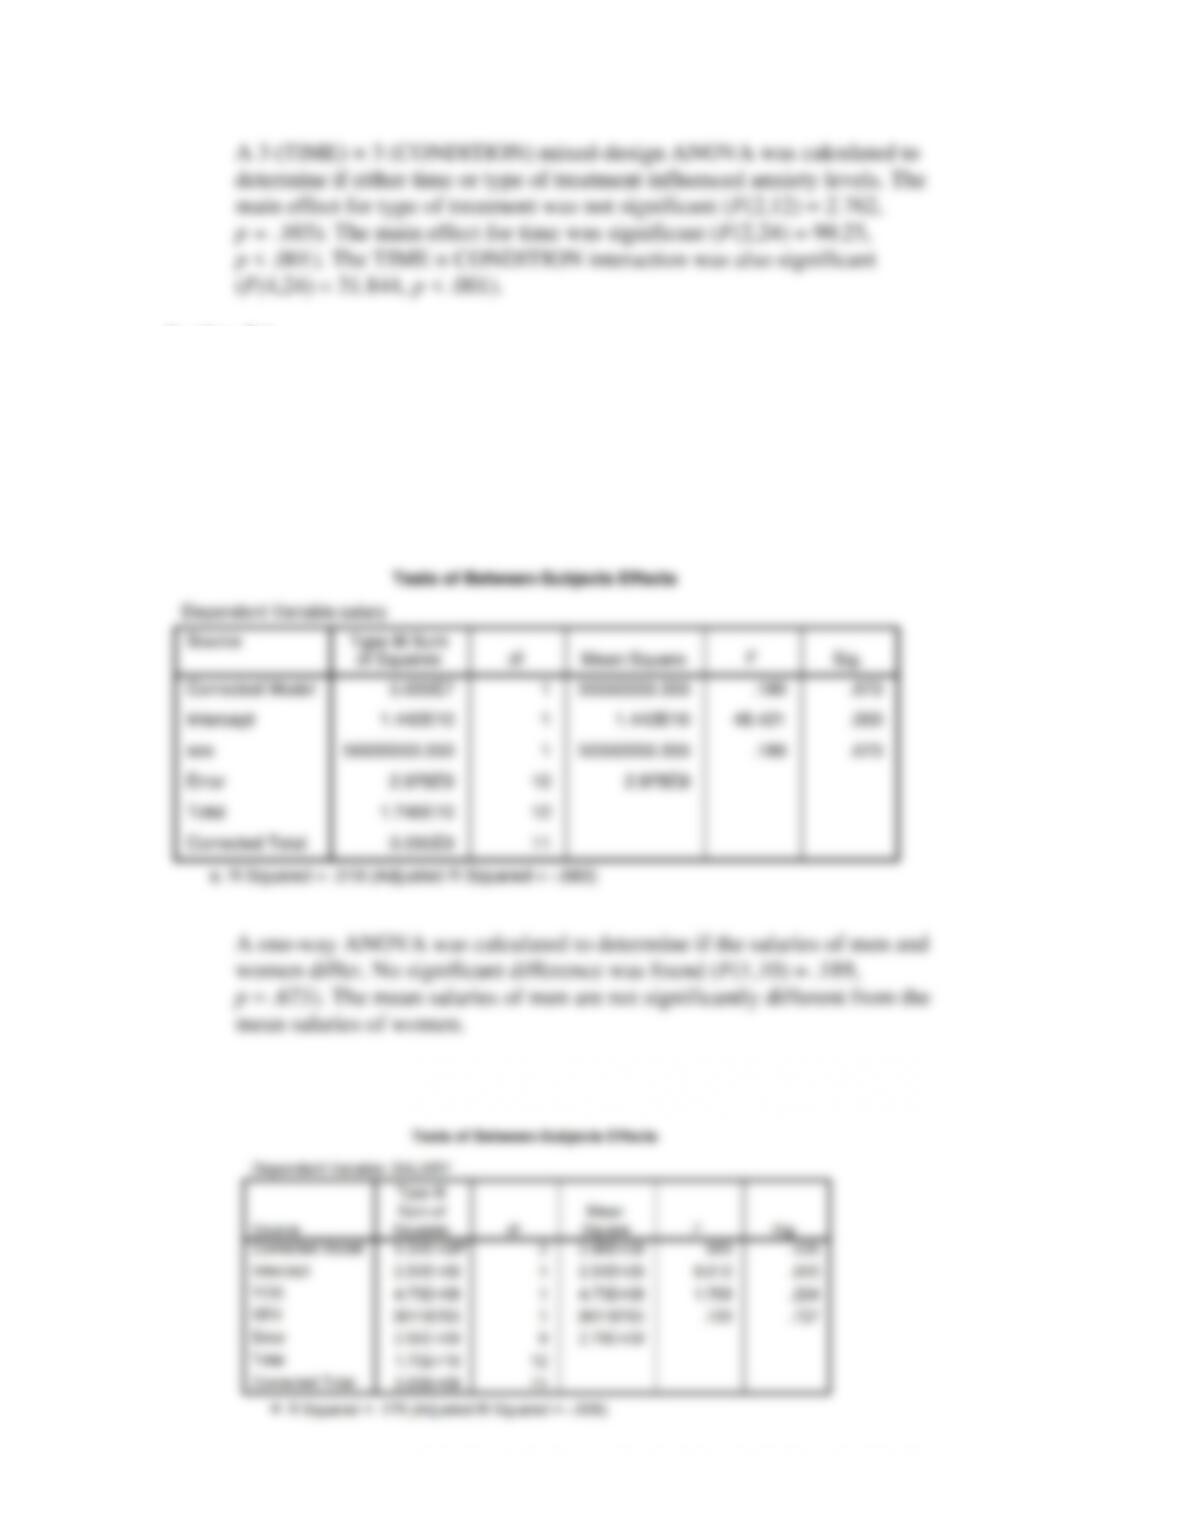
Use Practice Data Set 3 in Appendix B. Determine if anxiety levels changed over time for
each of the treatment (CONDITION) types. How did time change anxiety levels for each
treatment? Write a statement of results.
Section 7.6
Use Practice Data Set 2 in Appendix B. Determine if salaries are different for males and
females. Repeat the analysis, statistically controlling for years of service. Write a statement
of results for each. Compare and contrast your two answers.
Regular ANOVA results
ANCOVA results
Section 8.1
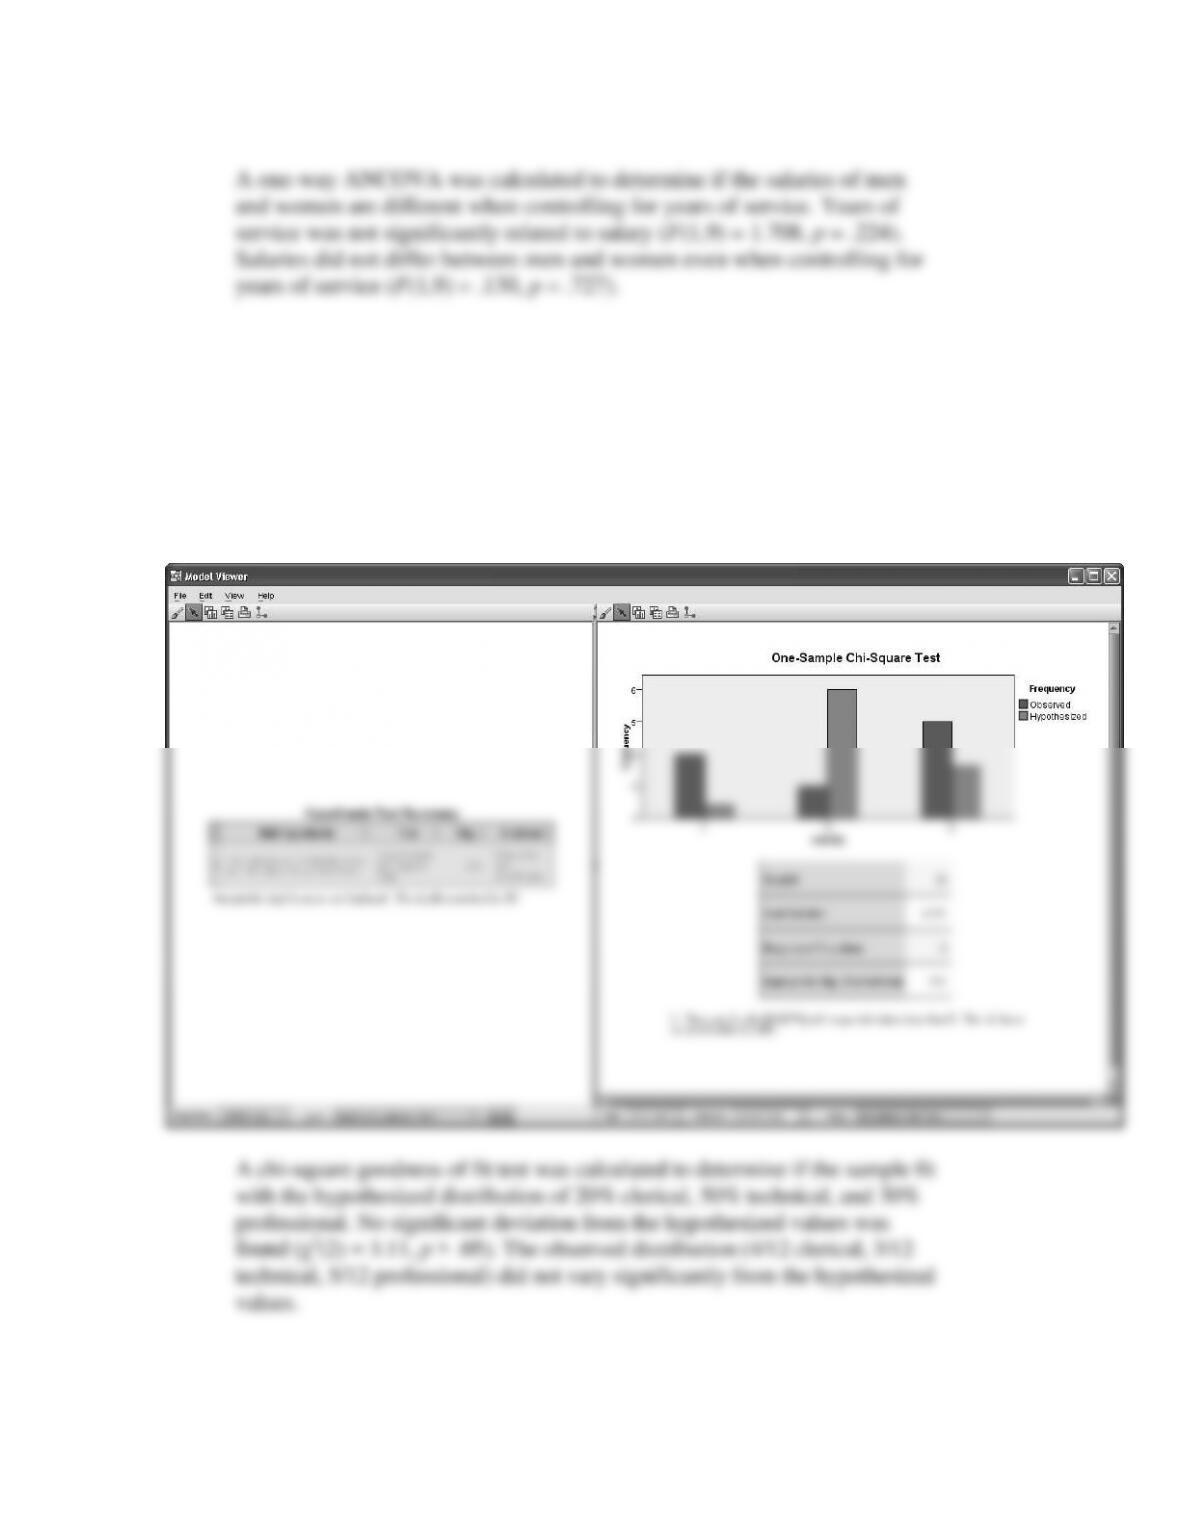
Use Practice Data Set 2 in Appendix B. In the population from which the sample was
drawn, 20% of employees are clerical, 50% are technical, and 30% are professional.
Determine whether or not the sample drawn conforms to these values. Hint: You will need
to customize expected probabilities and enter the category values (1, 2, 3) and relative
percentages (20, 50, 30). Also, be sure you have entered the variable CLASSIFY as
nominal.
Section 8.2
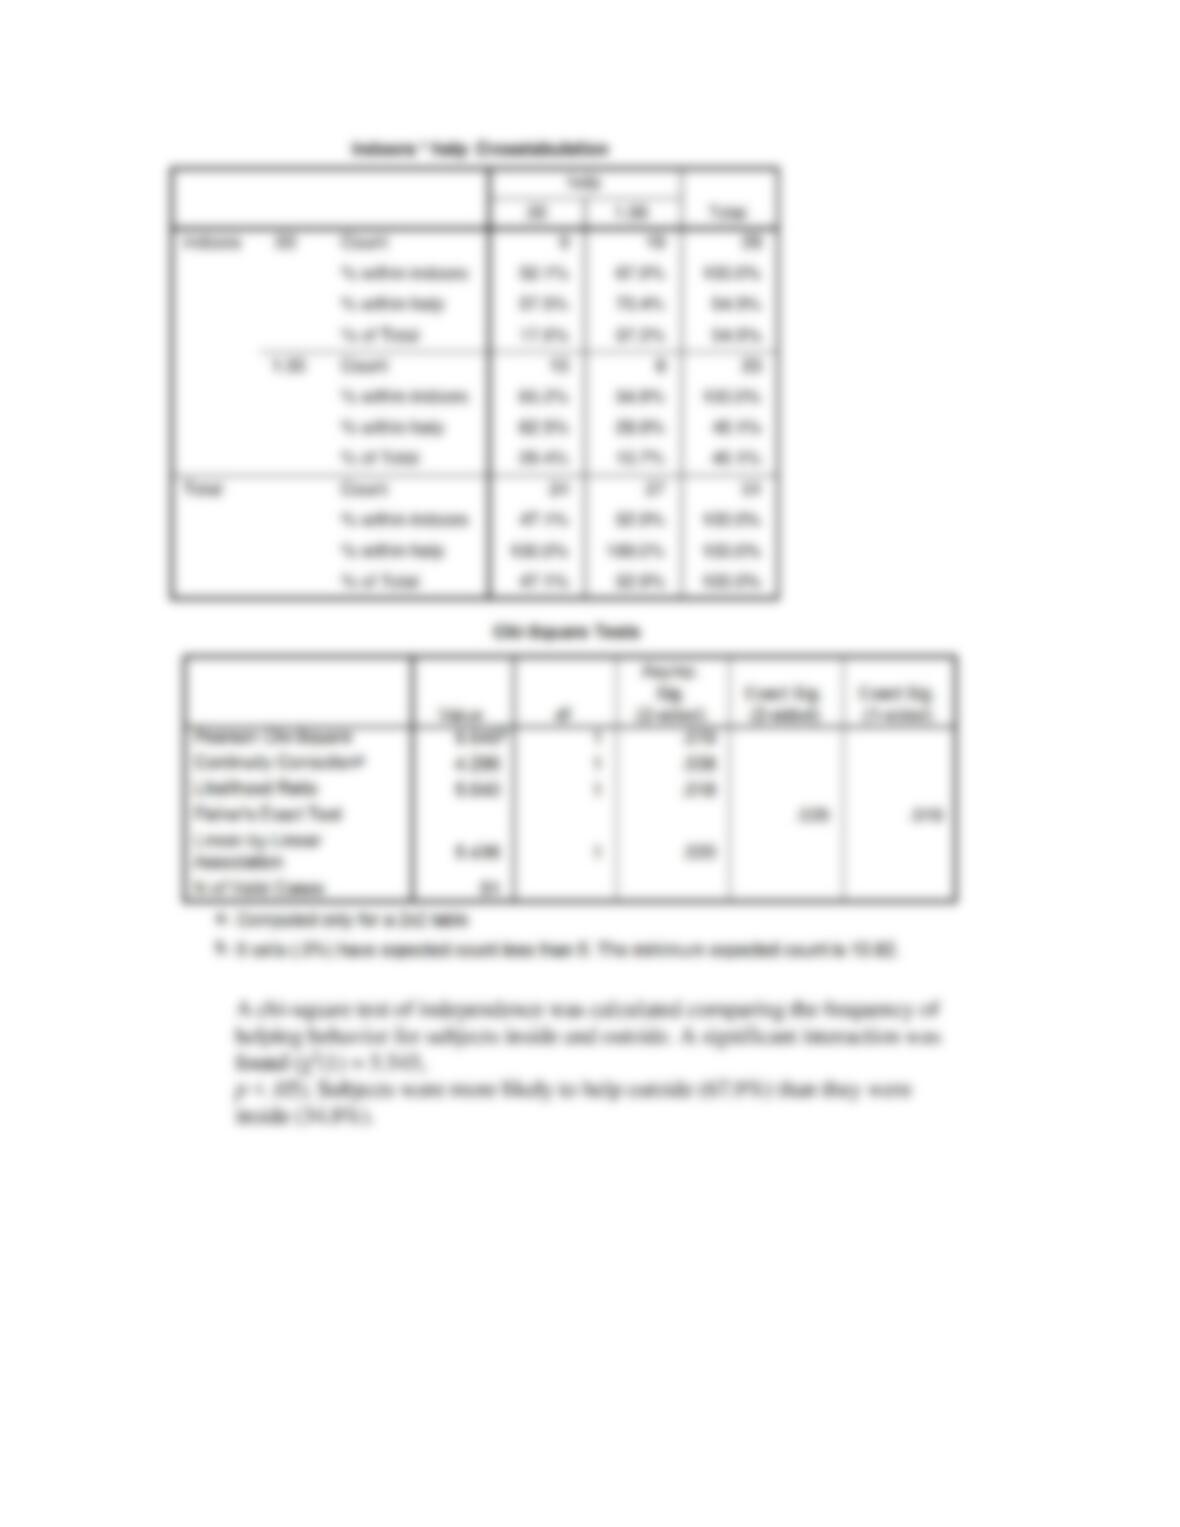
A researcher wants to know if individuals are more likely to help in an emergency when
they are indoors or when they are outdoors. Of 28 participants who were outdoors, 19
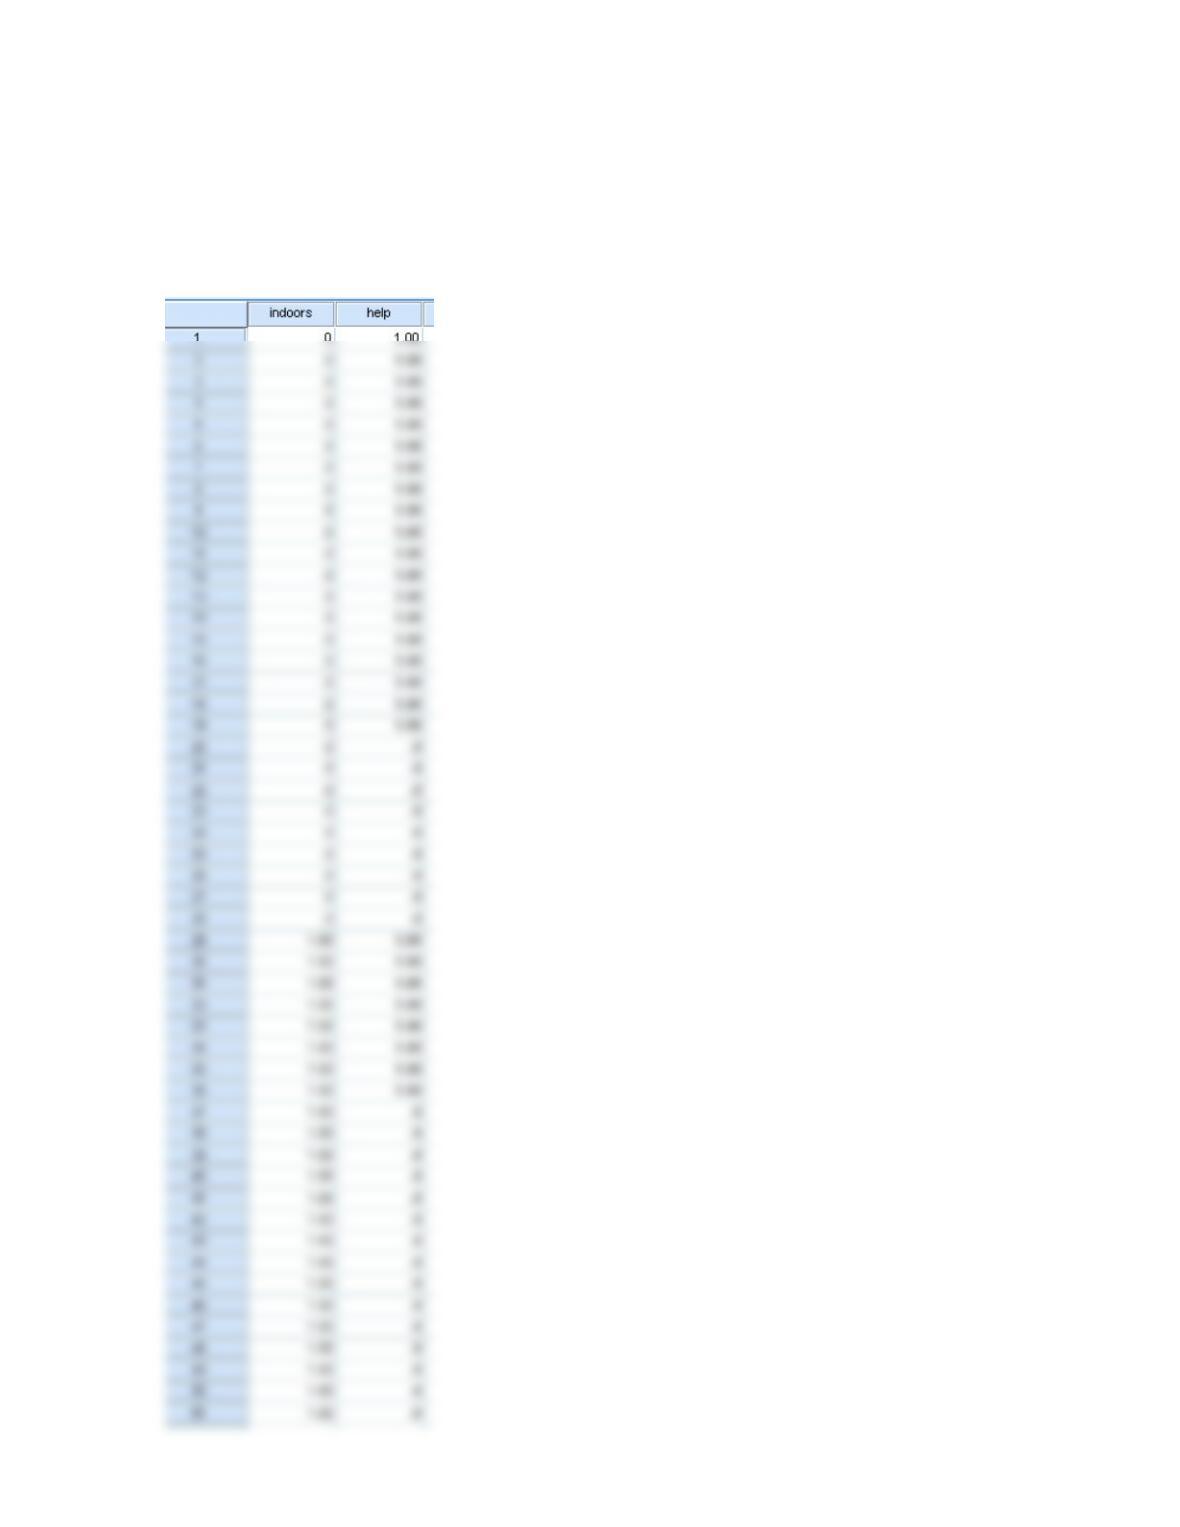
helped and 9 did not. Of 23 participants who were indoors, 8 helped and 15 did not. Enter
these data, and find out if helping behavior is affected by the environment. The key to this
problem is in the data entry. (Hint: How many participants were there, and how many
pieces of information do we know about each? Having SPSS give you cell percentages will
help you with interpretation of this problem.)
Section 8.3
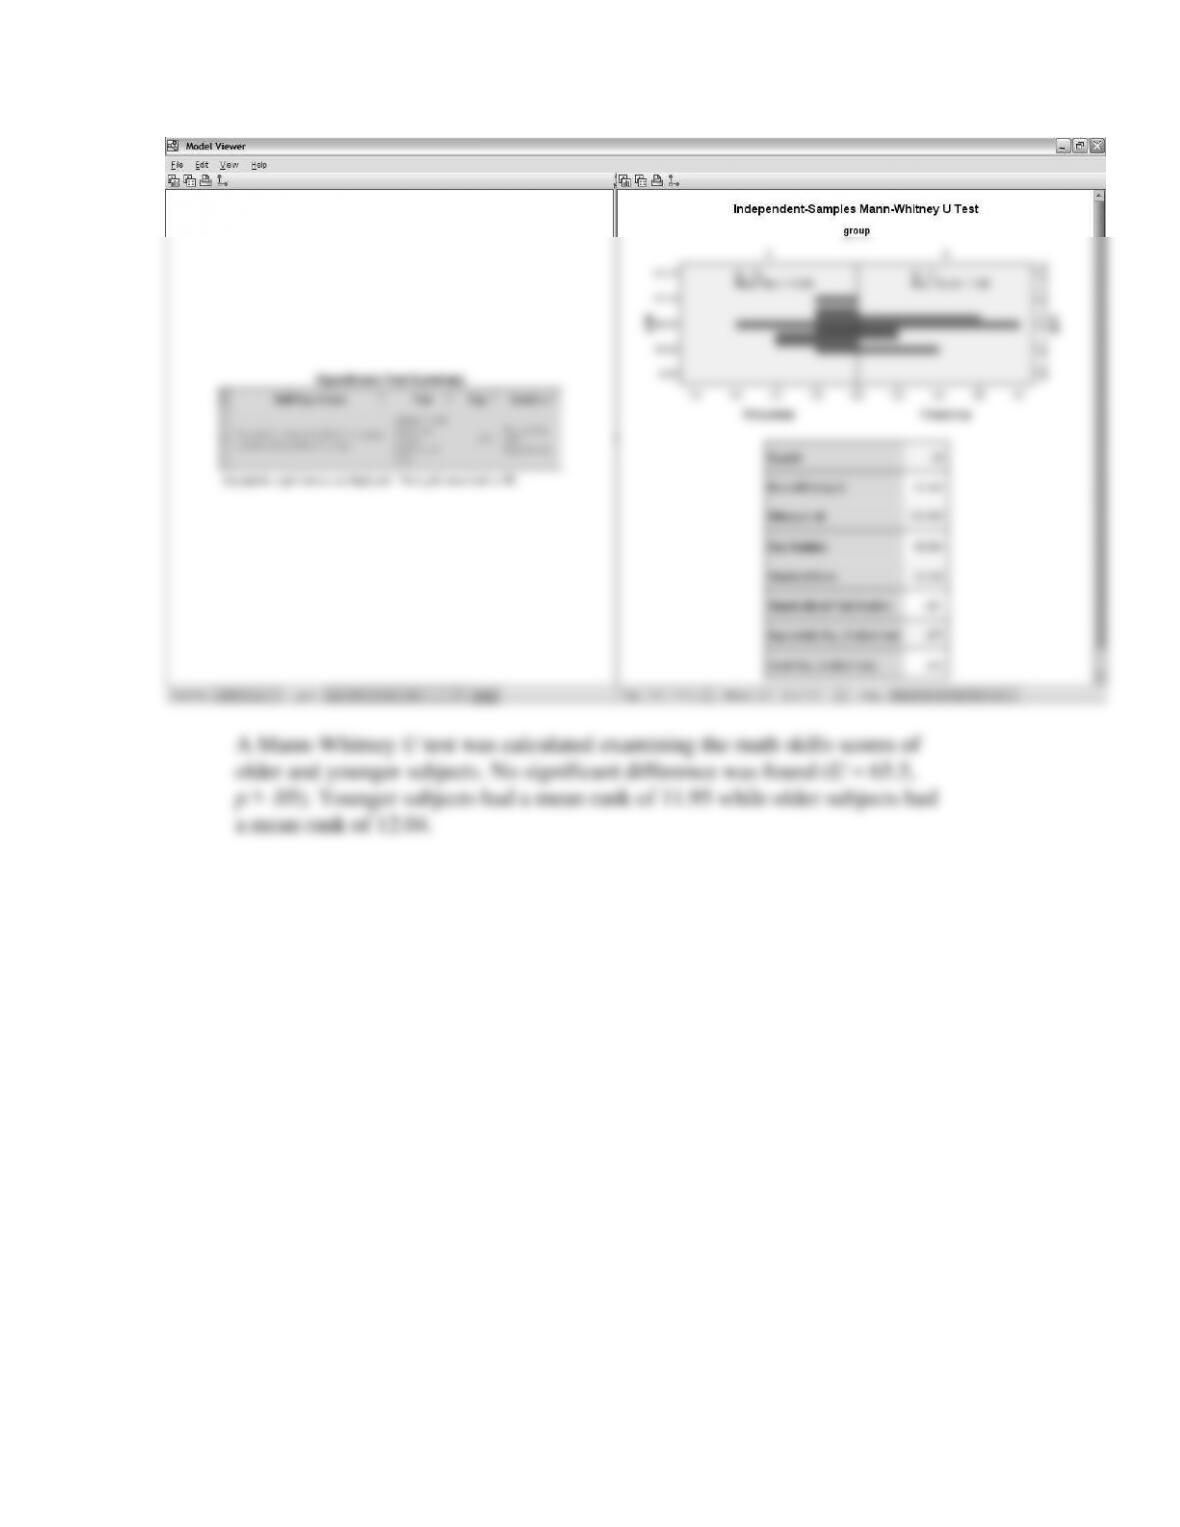
Use Practice Data Set 1 in Appendix B. Determine if younger participants (< 26) have
significantly lower mathematics scores than older participants. (Note: You will need to
create a new ordinal variable representing each age group. See Section 2.2 if you need a
refresher on how to do that.)
Section 8.4
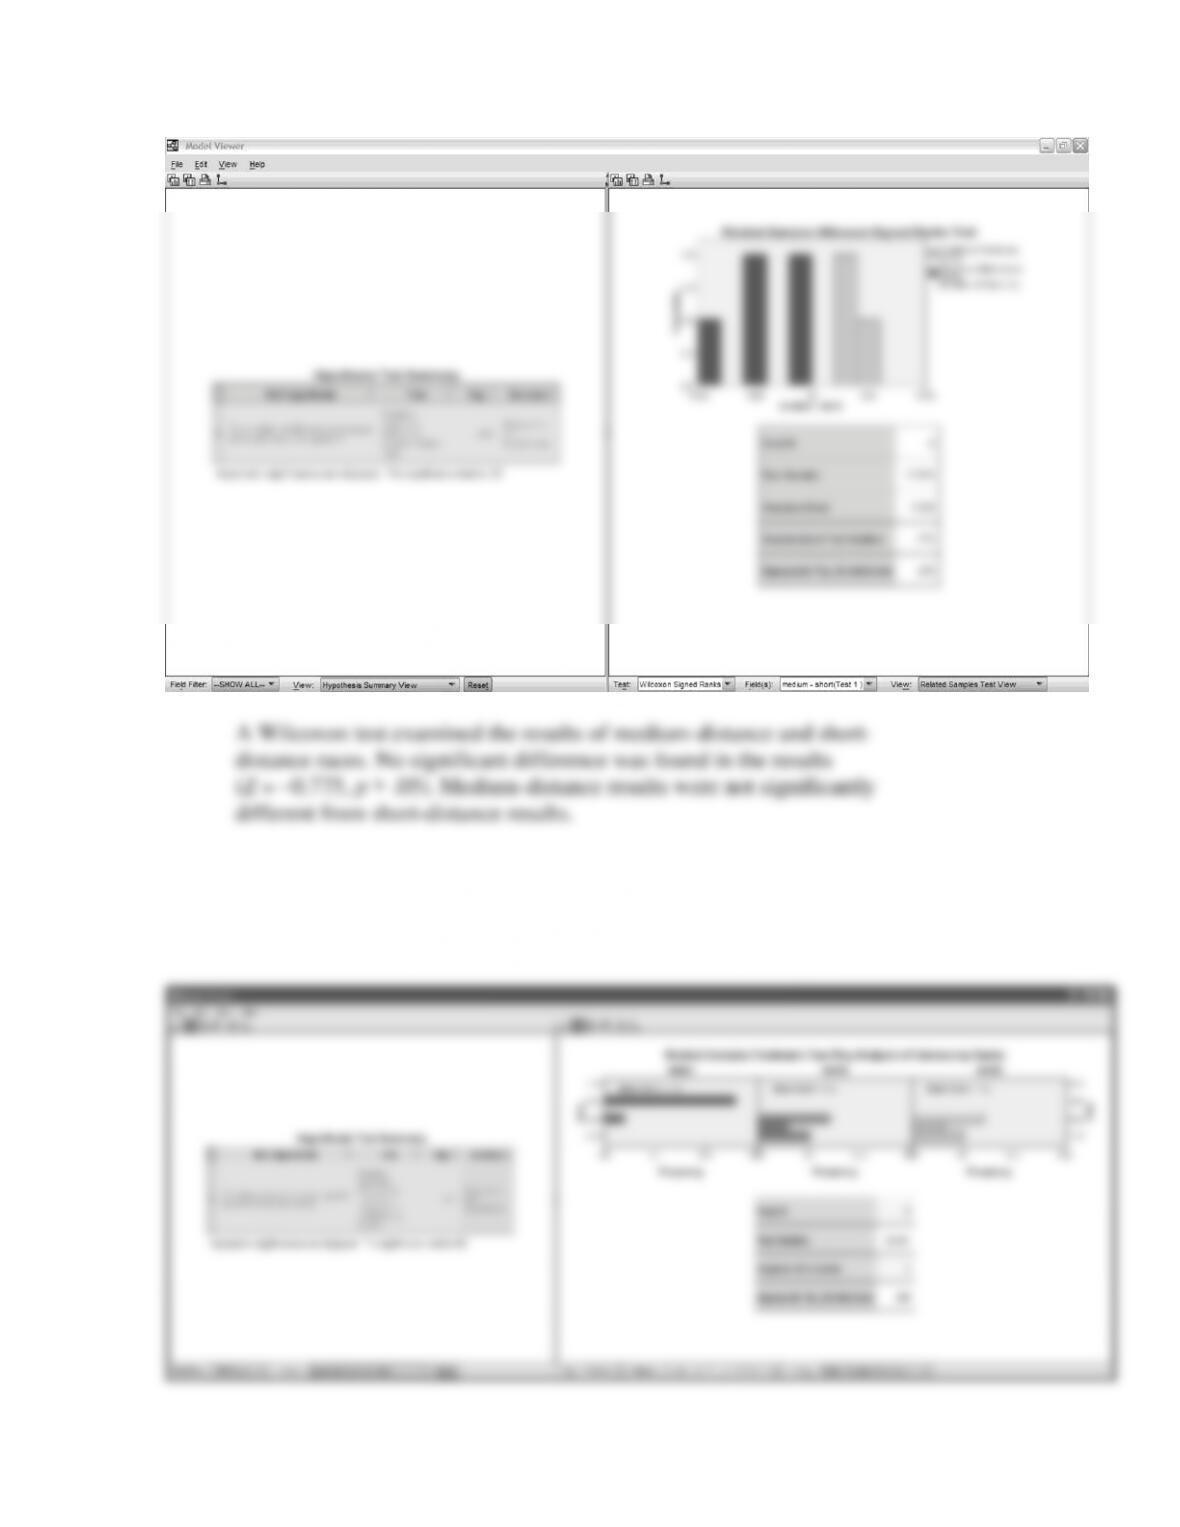
Use the RACE.sav data file to determine whether or not the outcome of short-distance
races is different from that of medium-distance races. Phrase your results.
Section 8.6
Use the data in Practice Data Set 3 in Appendix B. If anxiety is measured on an ordinal
scale, determine if anxiety levels changed over time. Phrase your results.