A n s w e r K e y
Section 1.6
Load the sample data file you created earlier (SAMPLE.sav). Run the Descriptives
command for the variable GRADE, and view the output. Your output should look very
similar to the example on page 8 of the book. Next, select the data window and print it.
Section 1.7
Follow the previous example (where TRAINING is the new variable). Make the
modifications to your SAMPLE.sav data file and save it.
Section 3.1
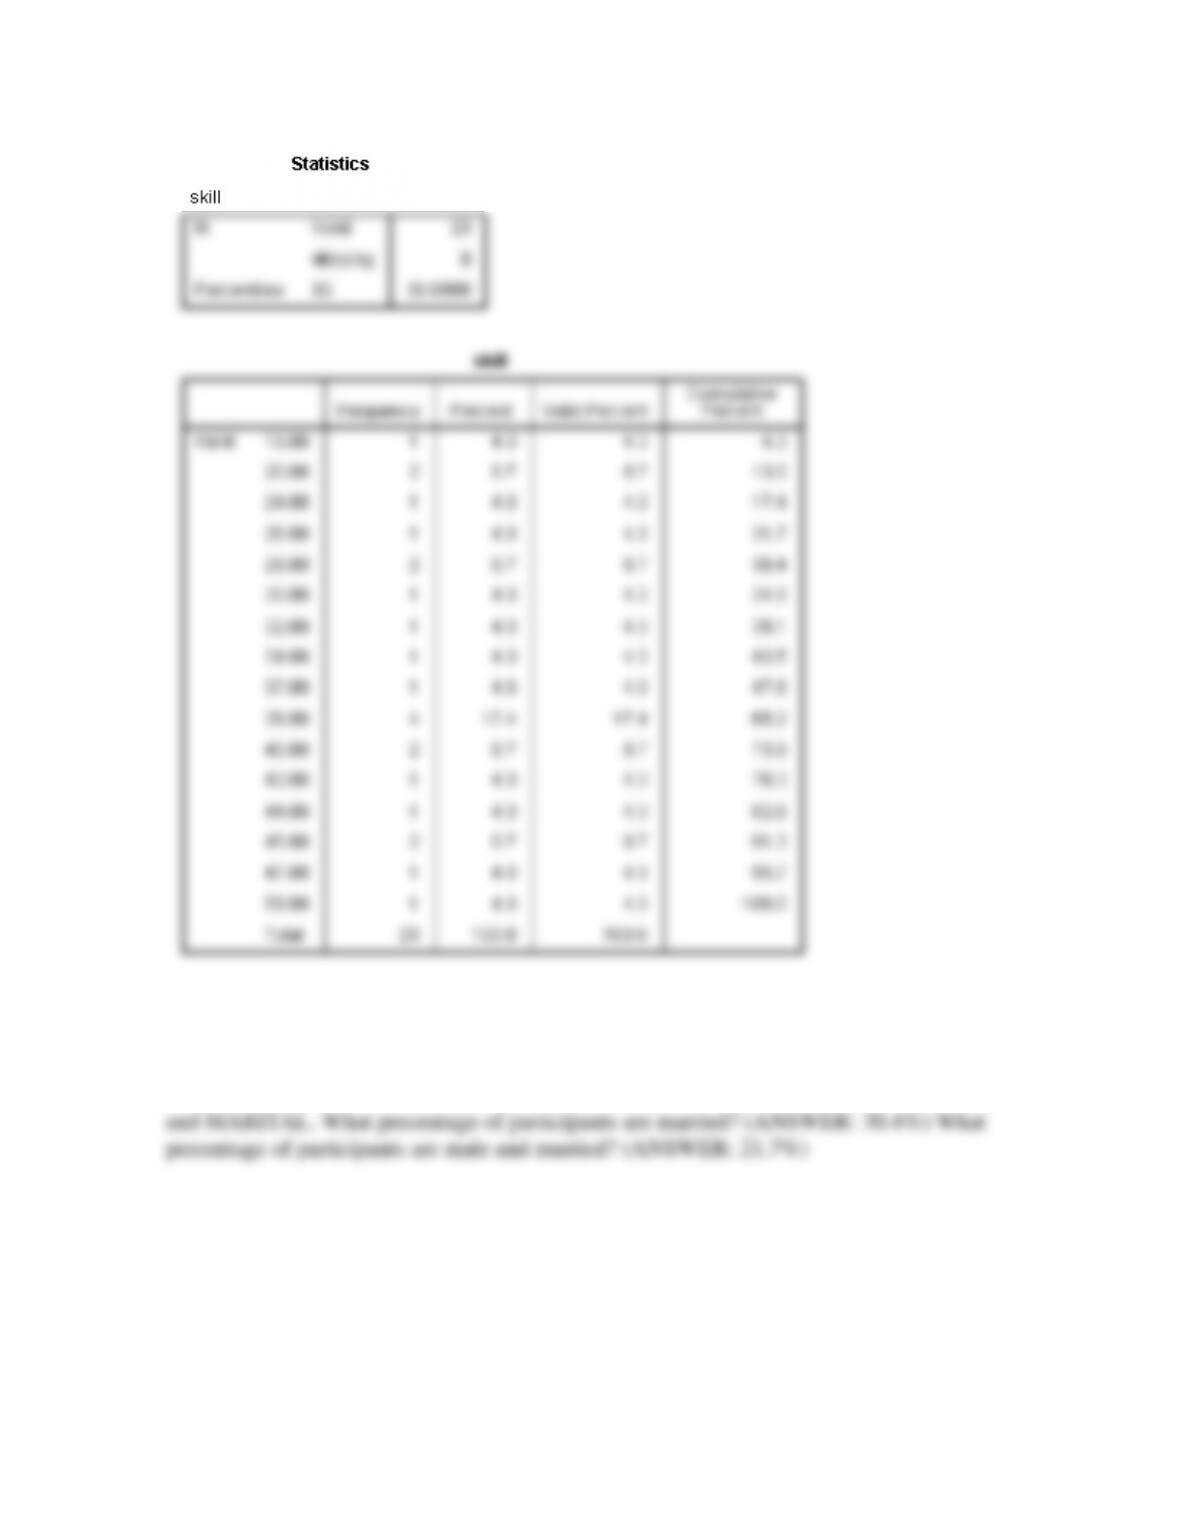
Use Practice Data Set 1 in Appendix B. Create a frequency distribution table for the
mathematics skills scores. Determine the mathematics skills score at which the 60th
percentile lies.
Section 3.2
Use Practice Data Set 1 in Appendix B. Create a contingency table using the Crosstabs
command. Determine the number of participants in each combination of the variables SEX
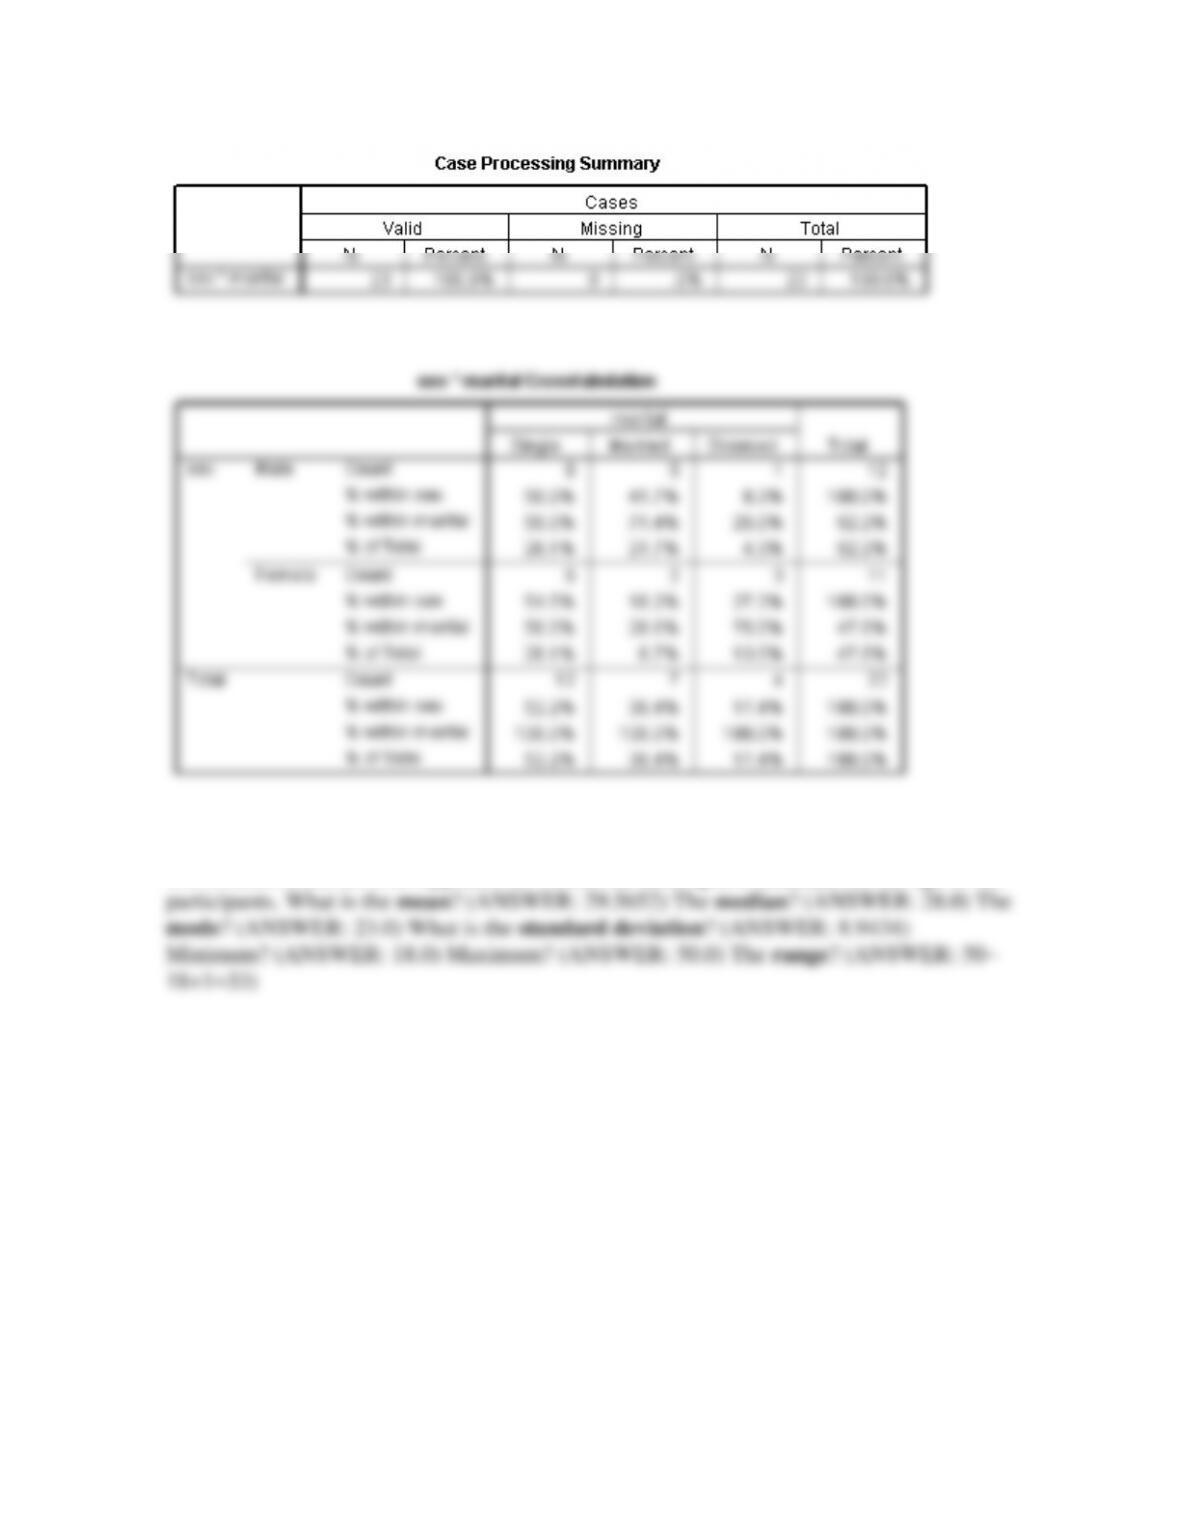
Section 3.3
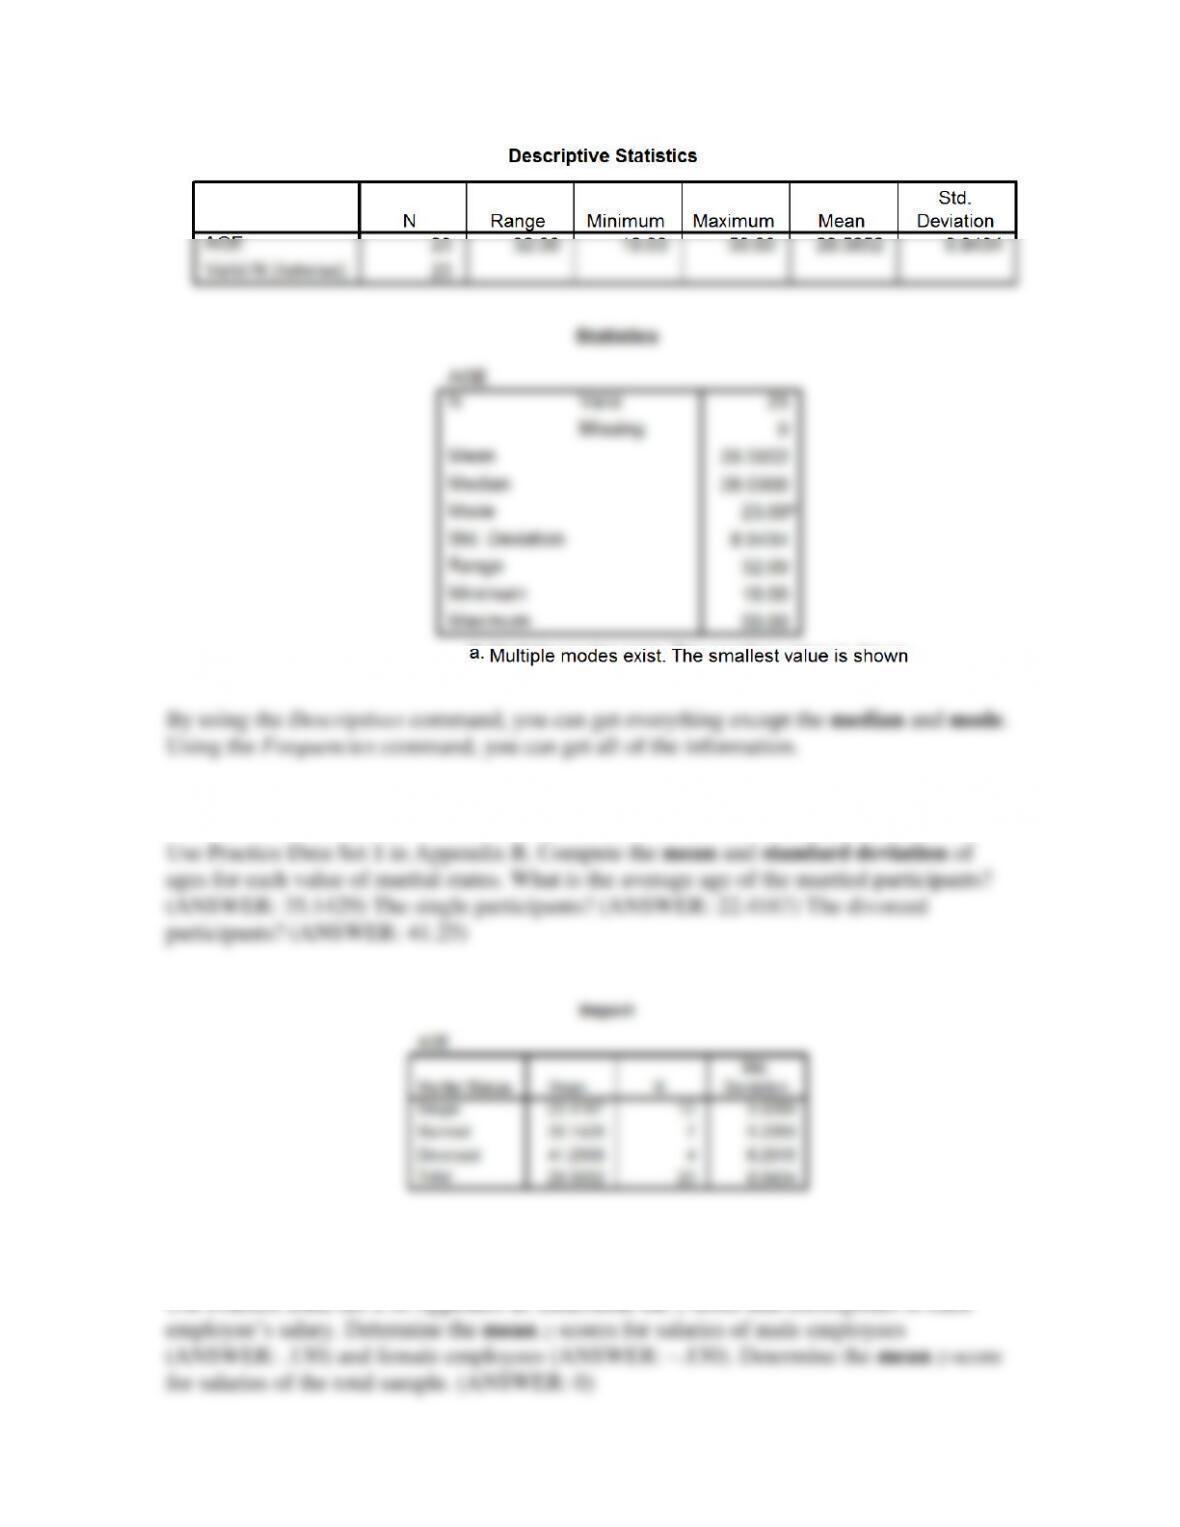
Use Practice Data Set 1 in Appendix B. Obtain the descriptive statistics for the age of the
Section 3.4
Section 3.5
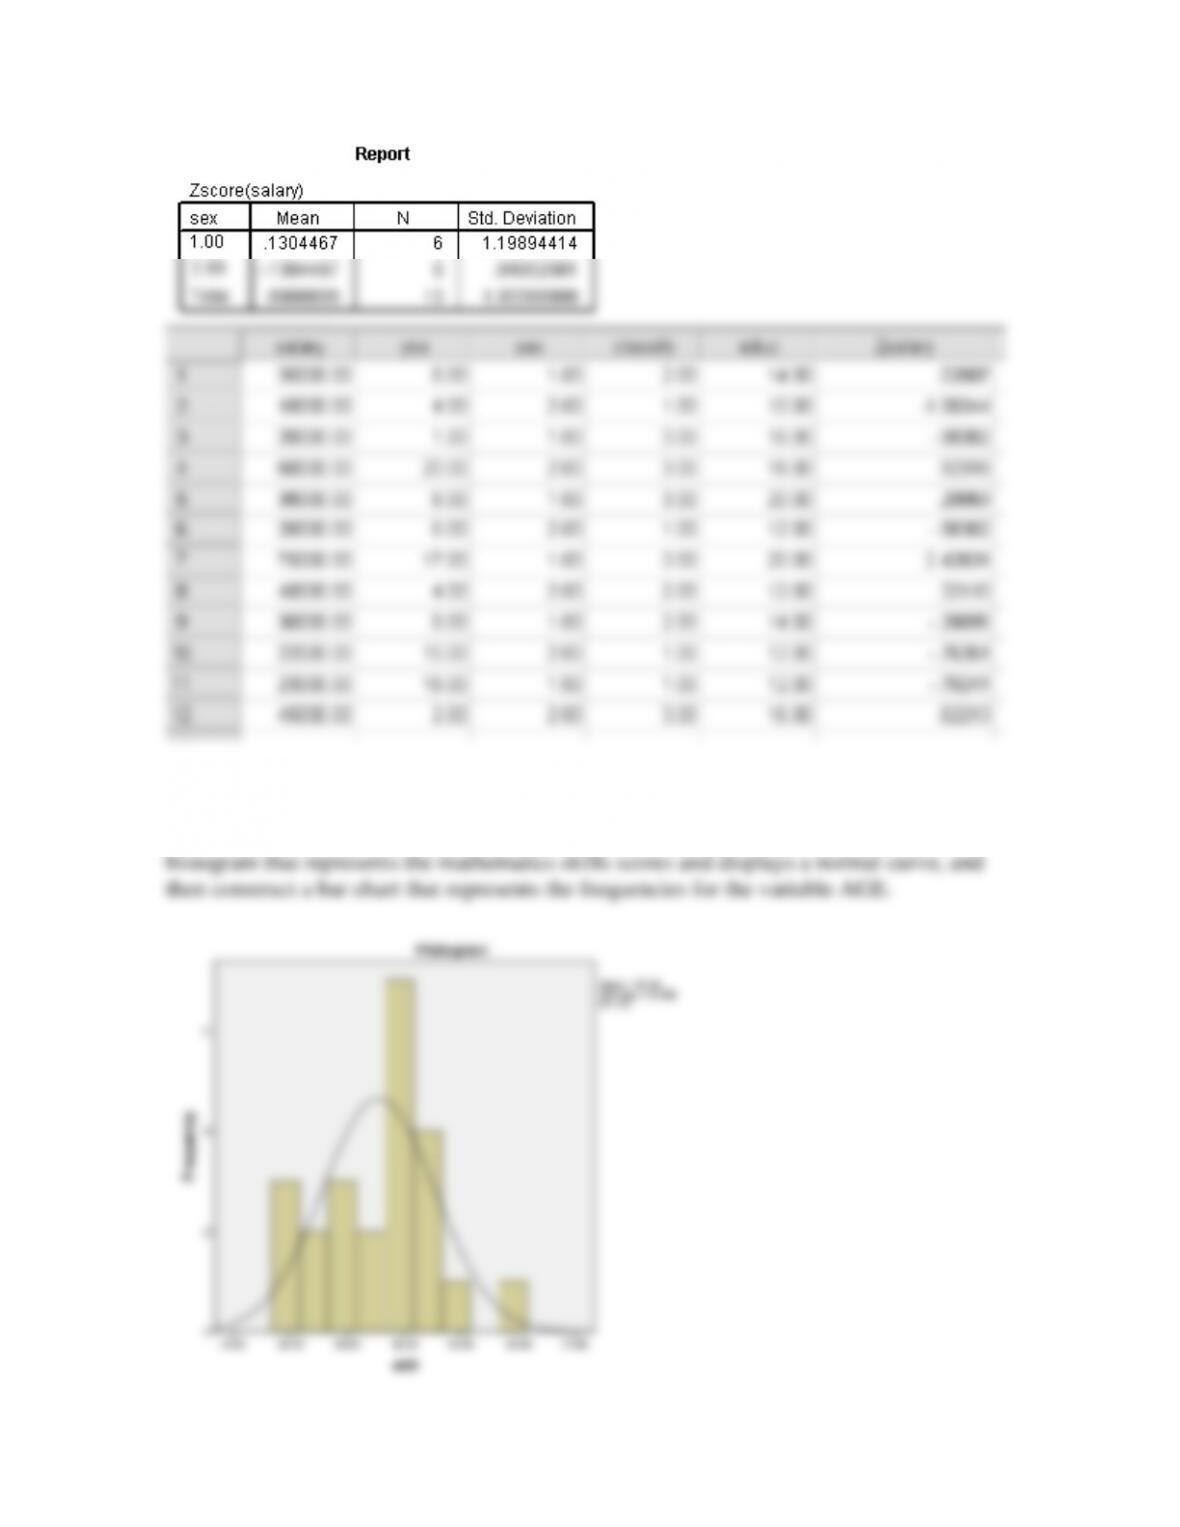
Use Practice Data Set 2 in Appendix B. Determine the z-score that corresponds to each
Section 4.2
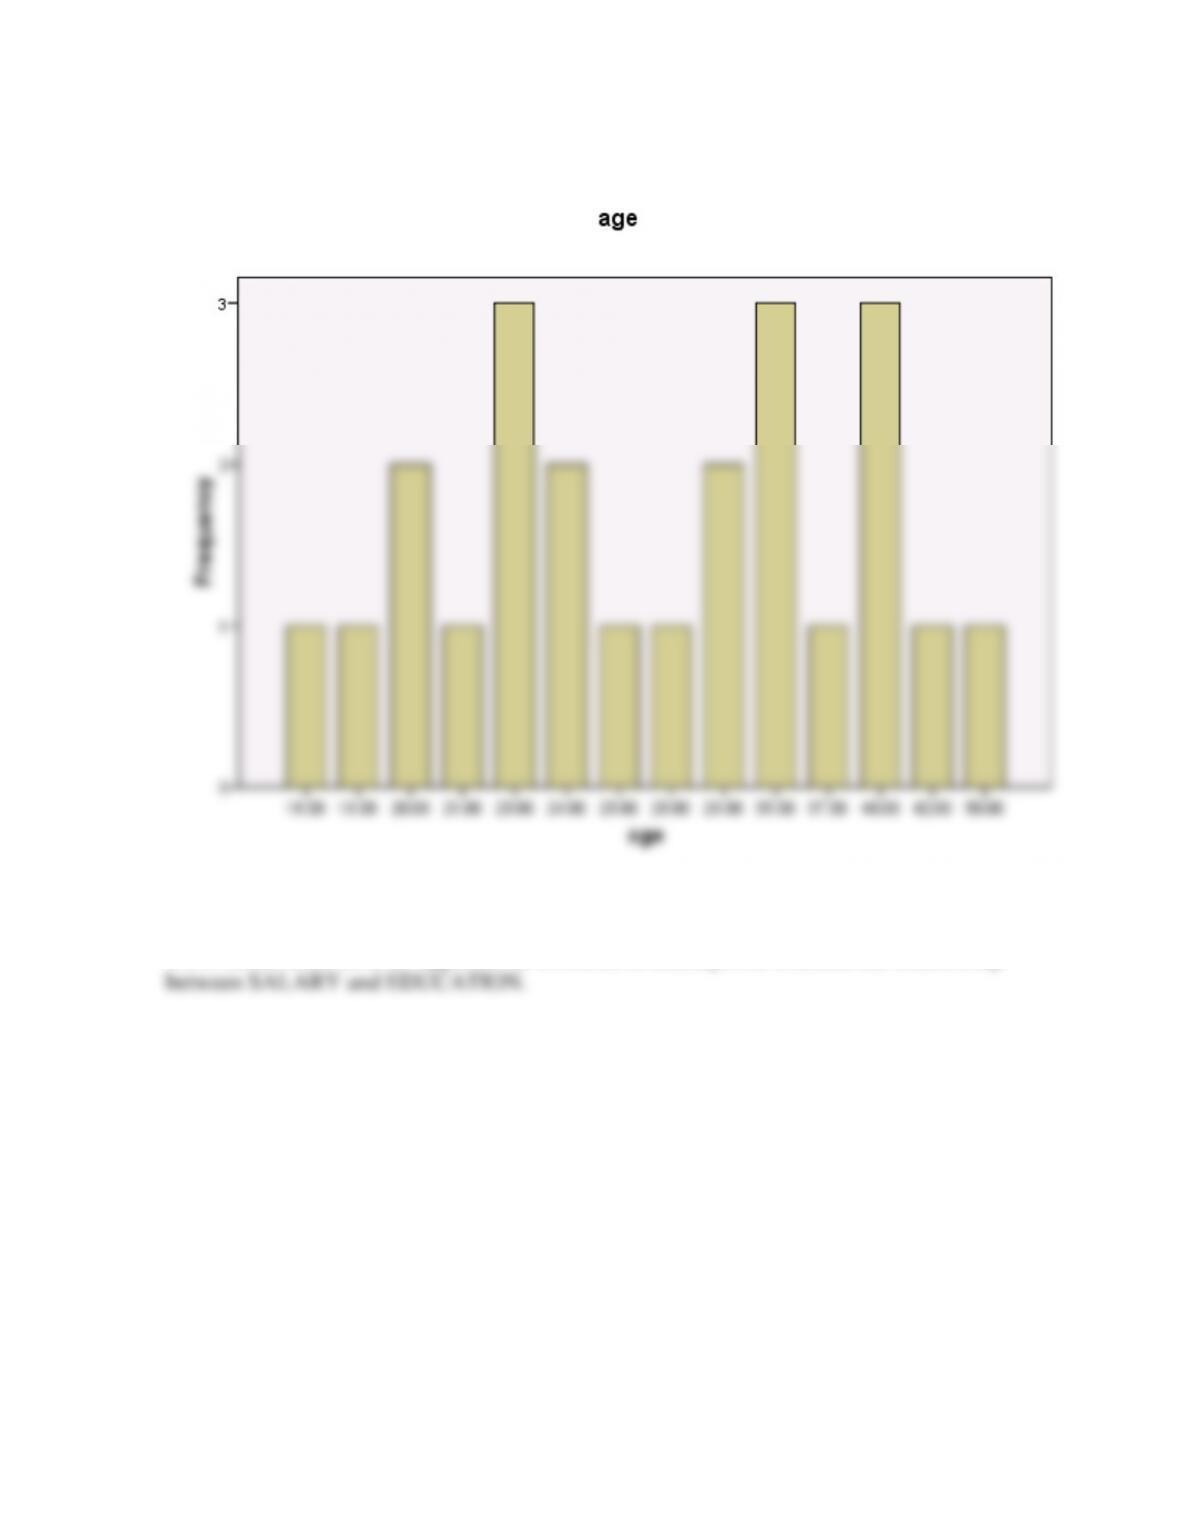
Use Practice Data Set 1 in Appendix B. After you have entered the data, first construct a
Section 4.4
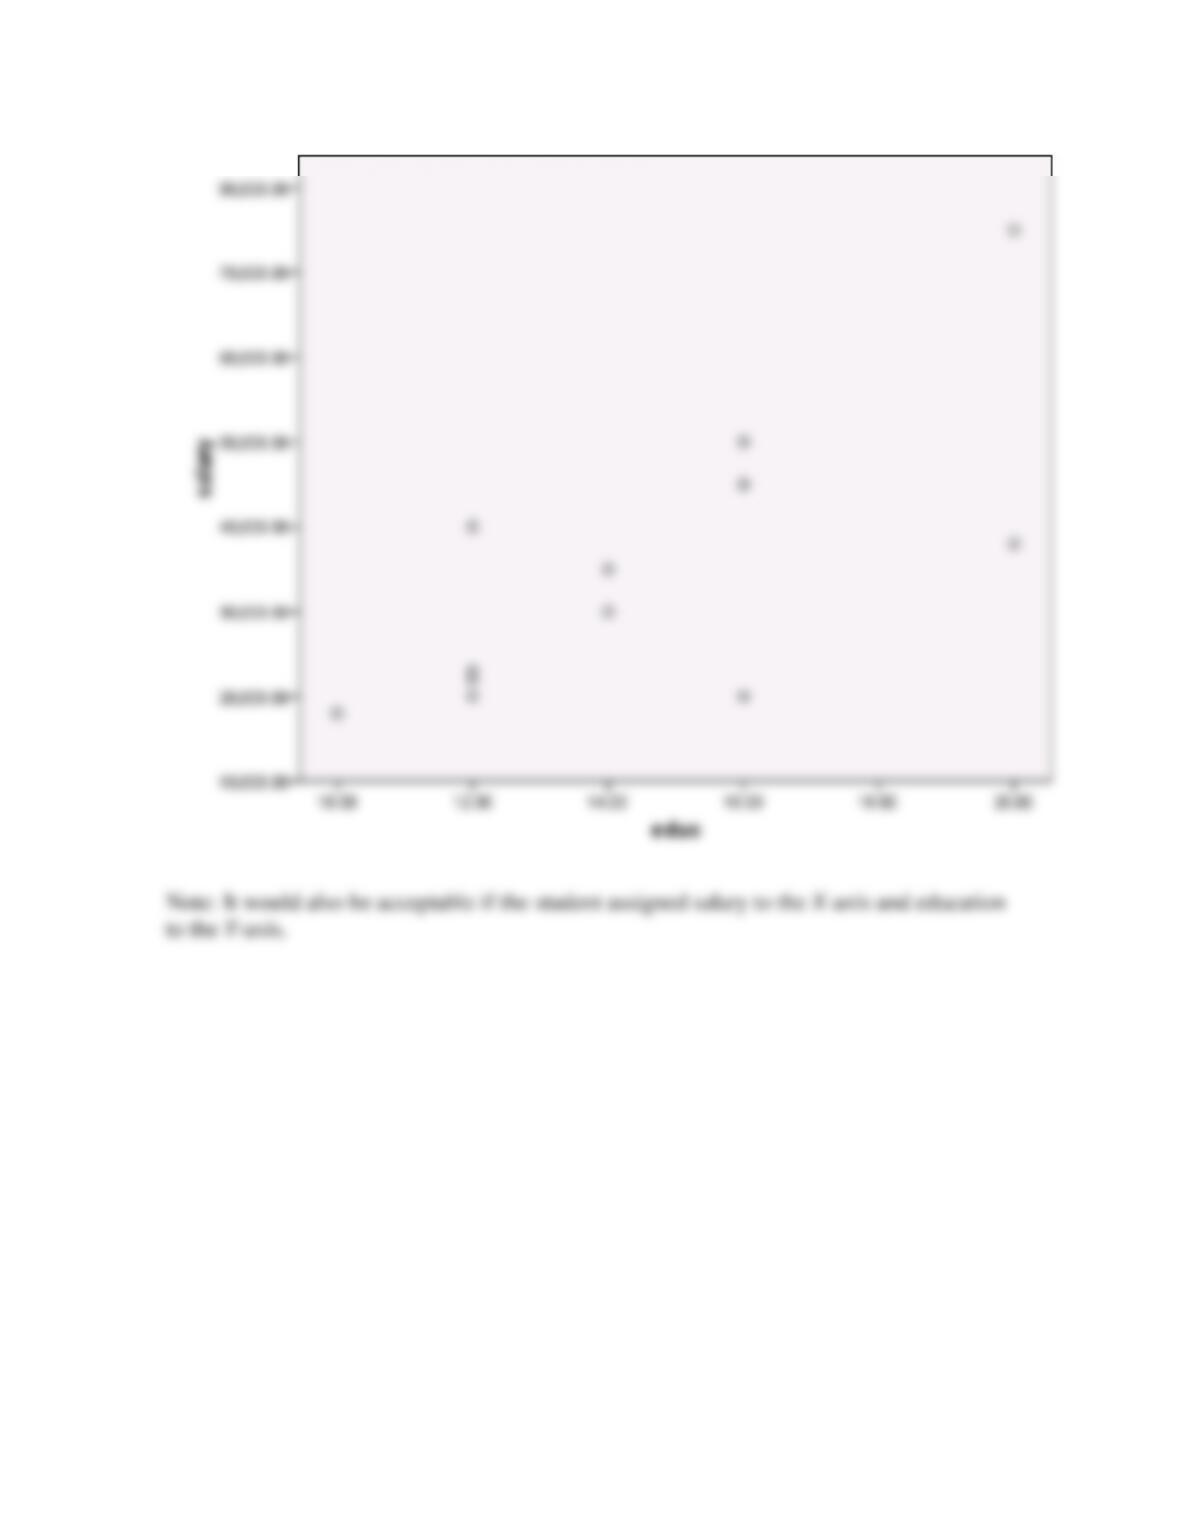
Use Practice Data Set 2 in Appendix B. Construct a scatterplot to examine the relationship
Section 4.5
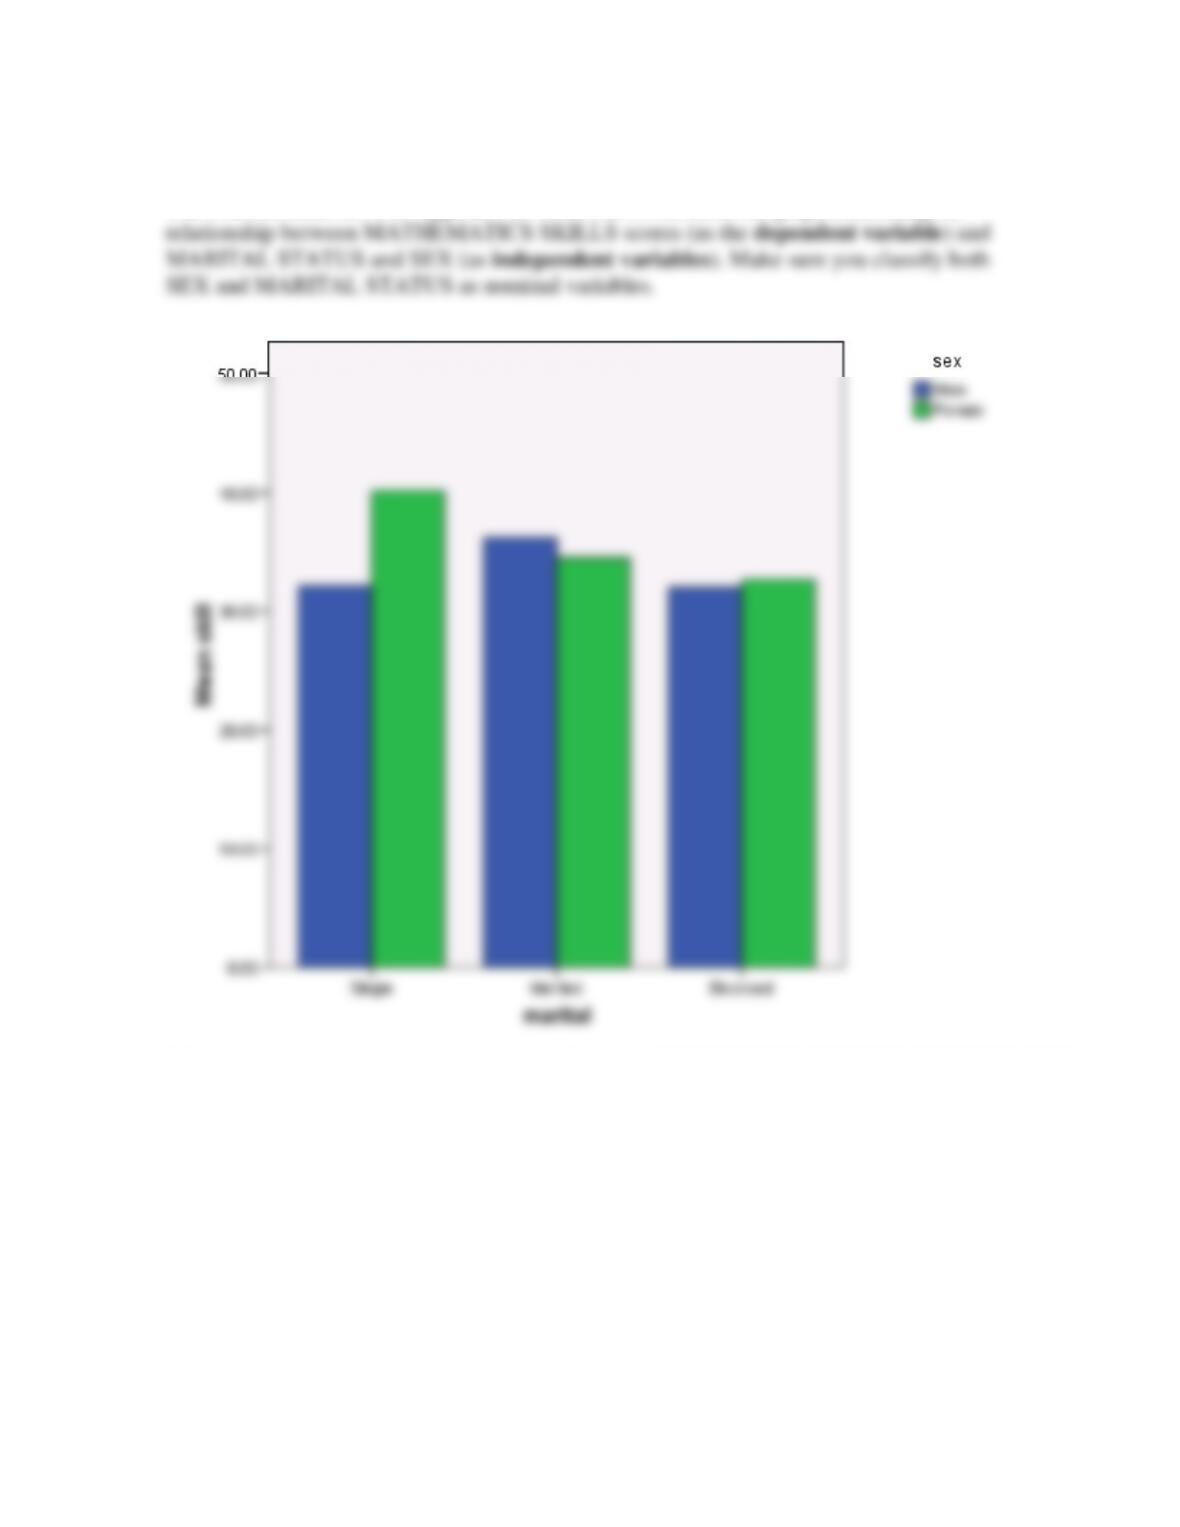
Use Practice Data Set 1 in Appendix B. Construct a clustered bar graph examining the
Section 5.1
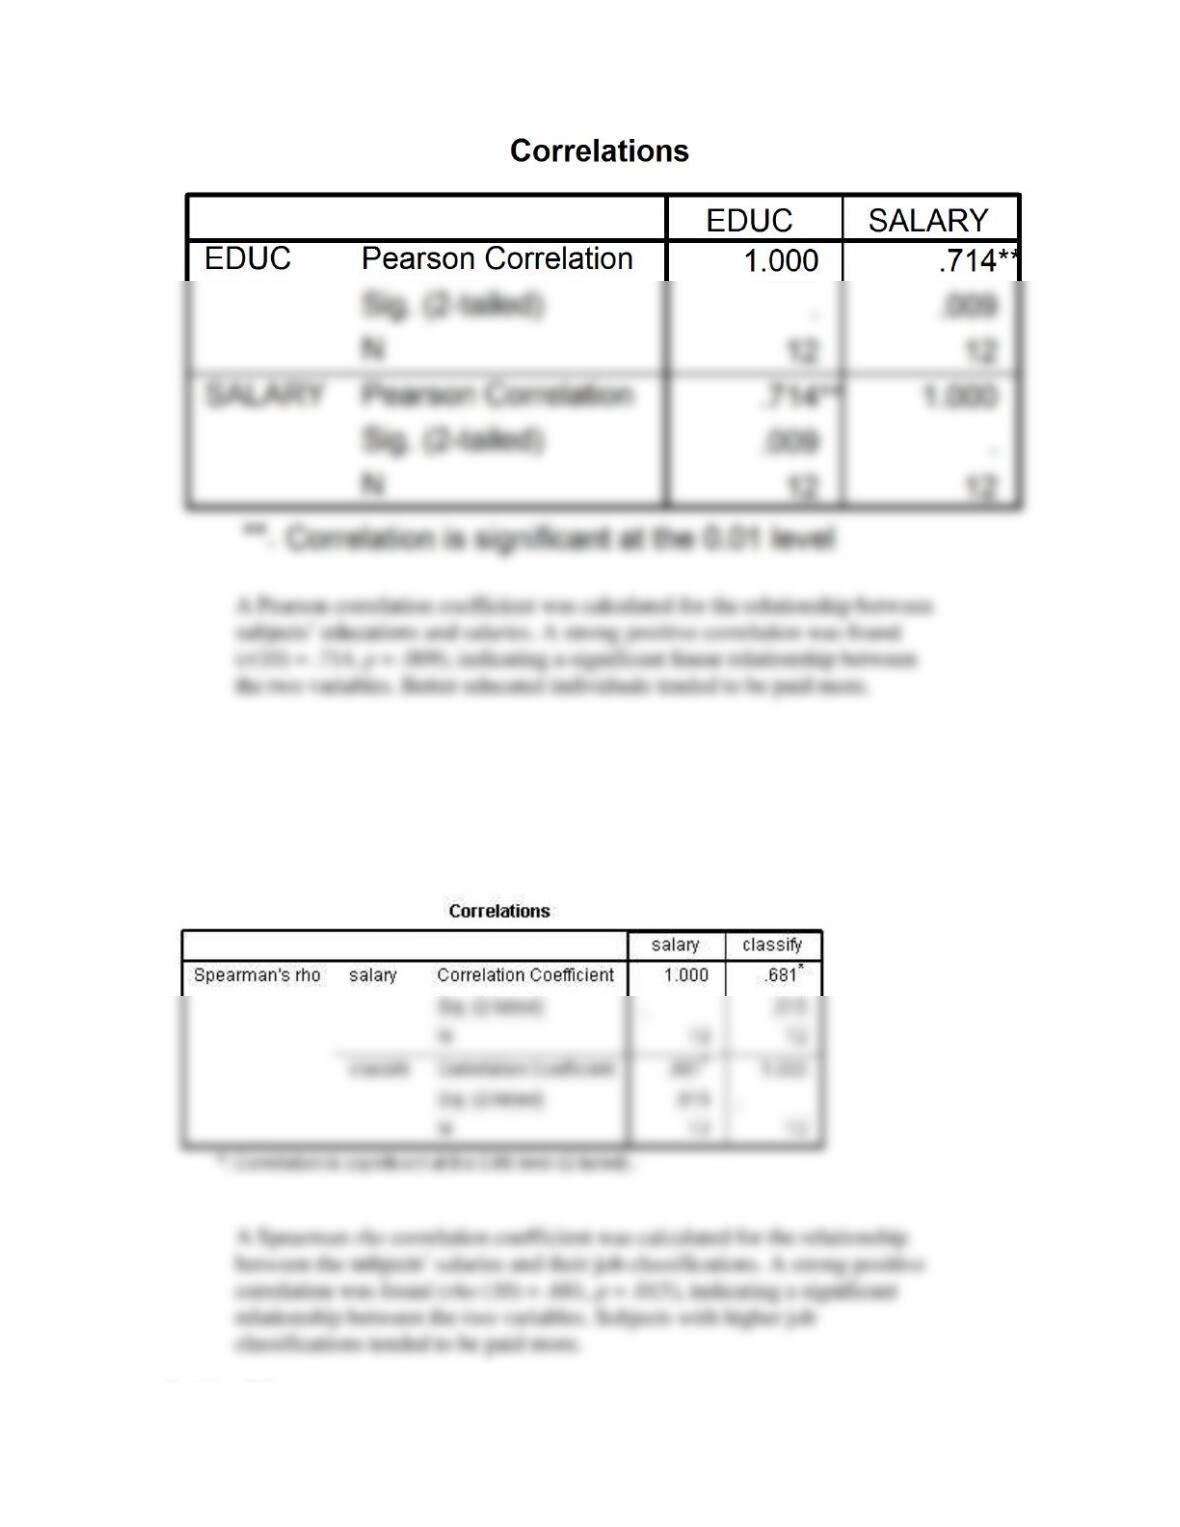
Use Practice Data Set 2 in Appendix B. Determine the value of the Pearson correlation
coefficient for the relationship between SALARY and YEARS OF EDUCATION, and
phrase your results.
Section 5.2
Use Practice Data Set 2 in Appendix B. Determine the strength of the relationship between
salary and job classification by calculating the Spearman rho correlation.
Section 5.3
Section 5.4
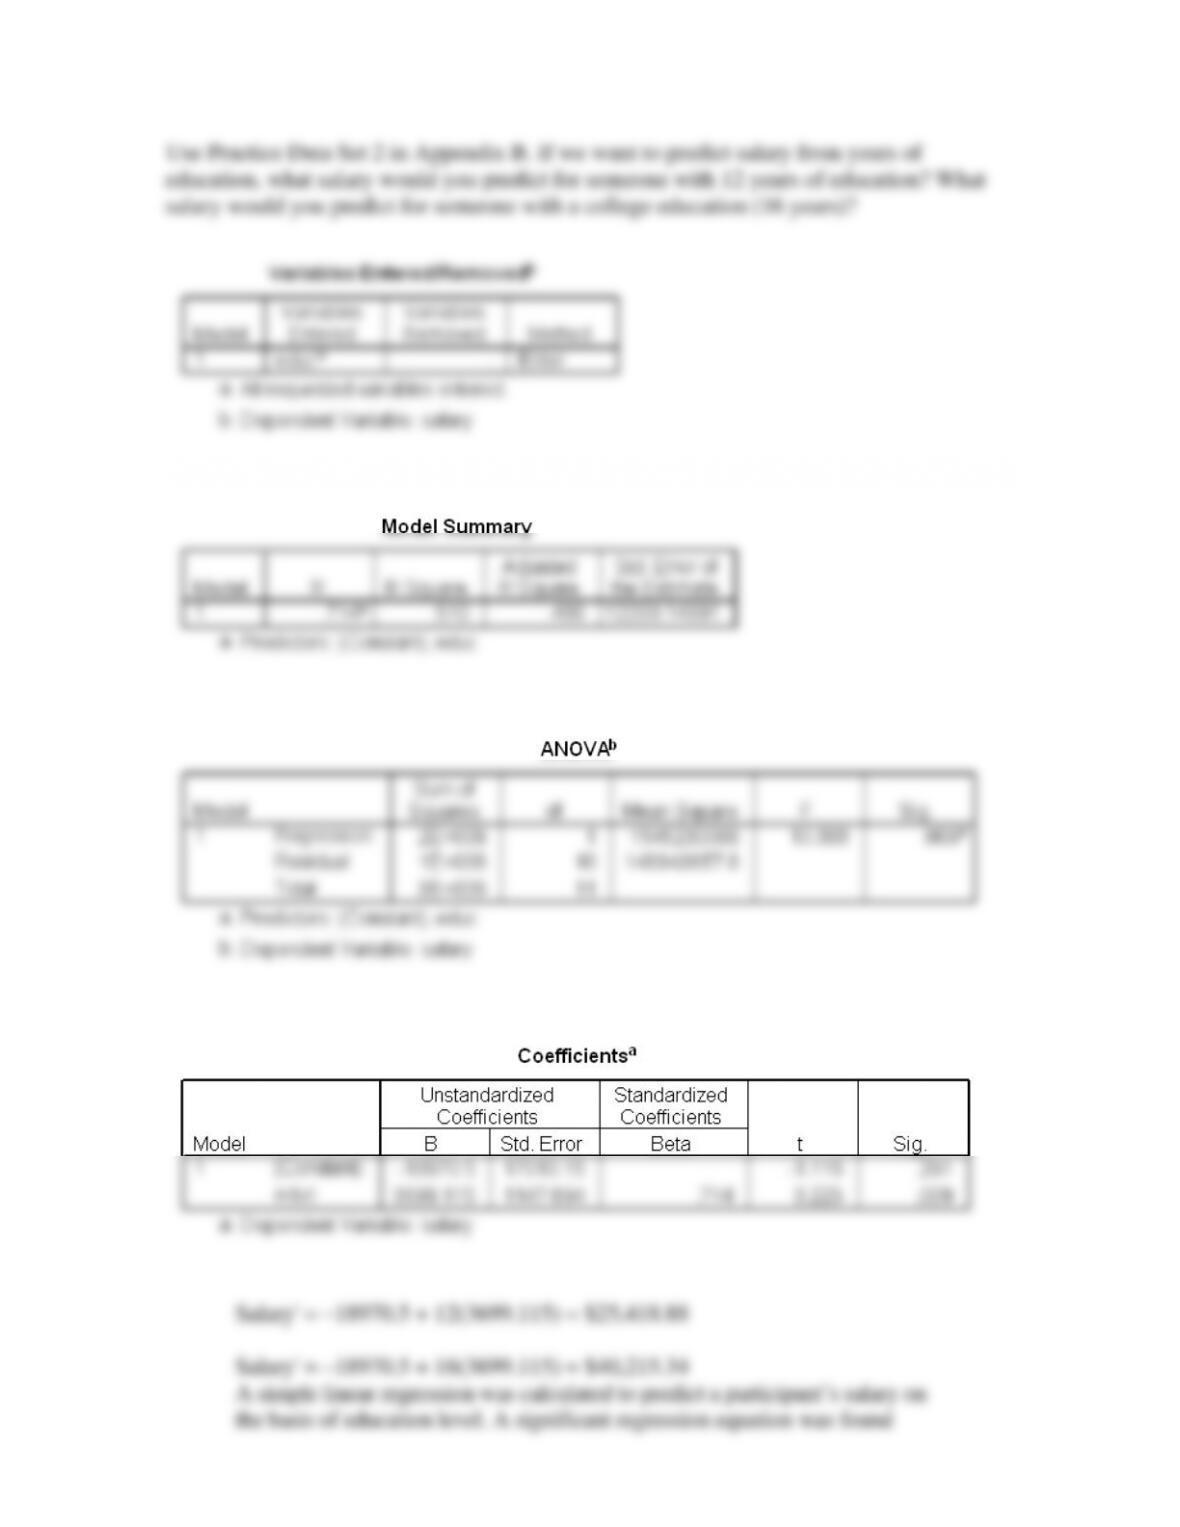
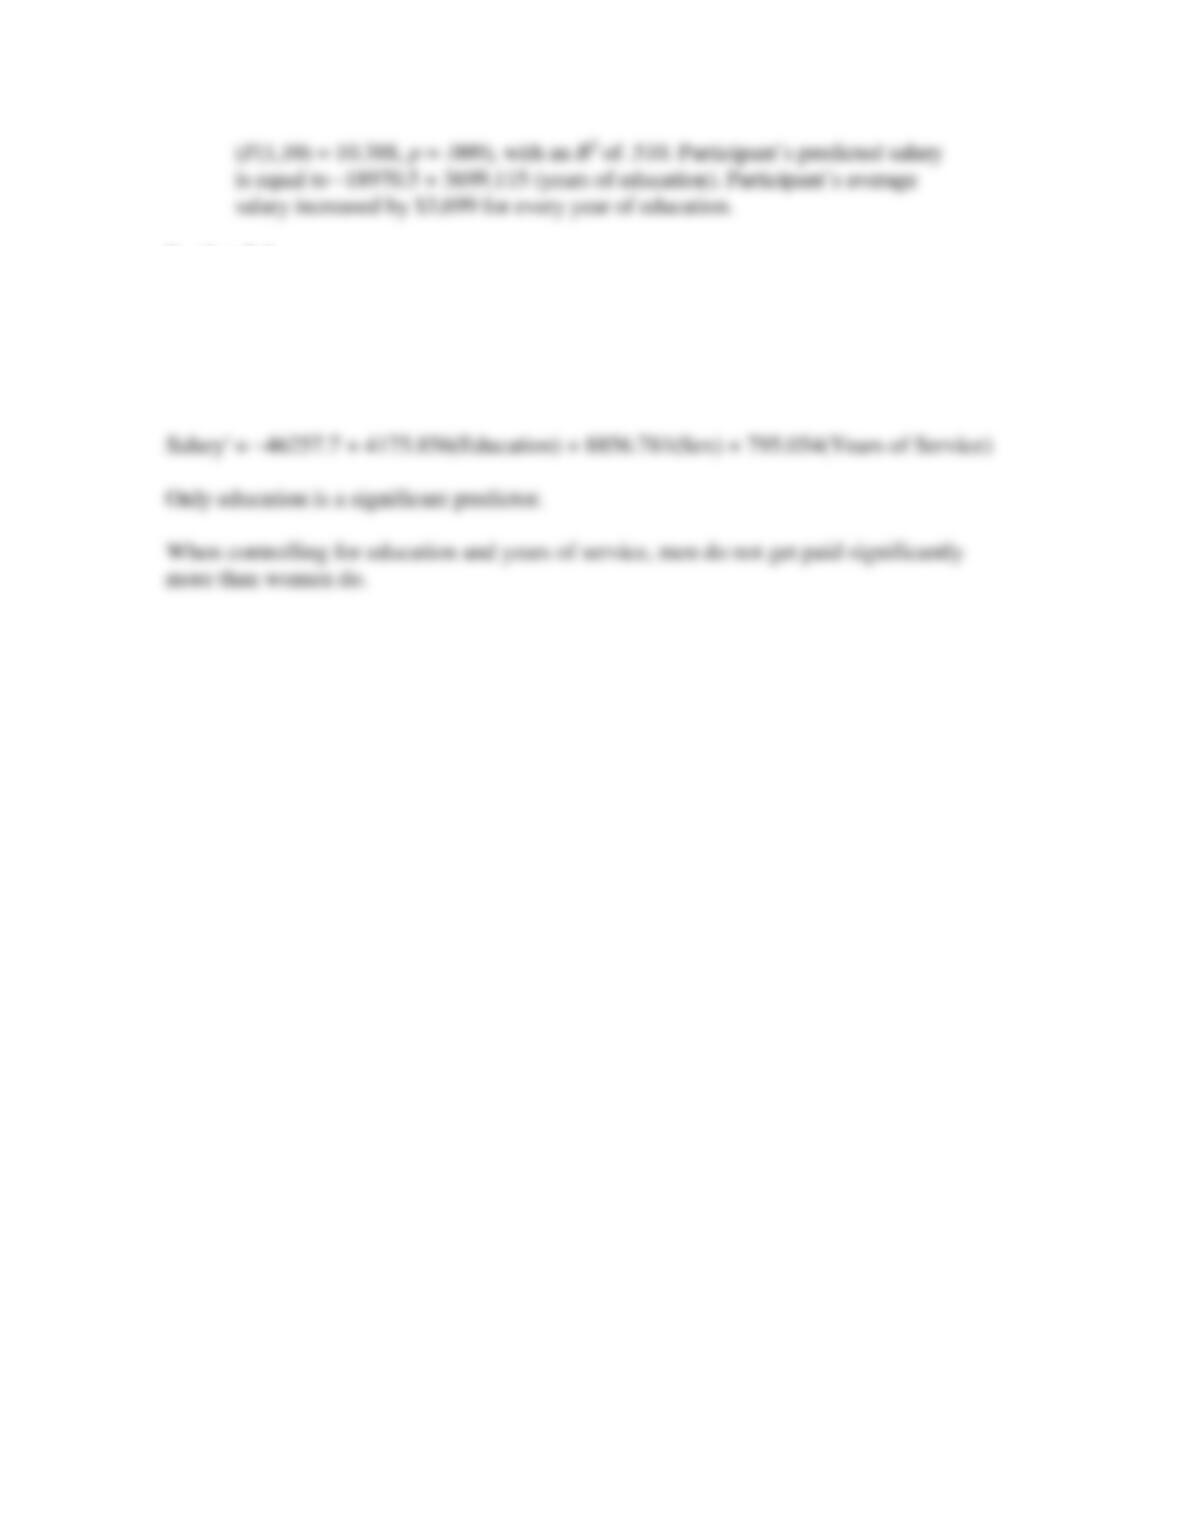
Use Practice Data Set 2 in Appendix B. Determine the prediction equation for predicting
salary based on education, years of service, and sex. Which variables are significant
predictors? If you believe that men were paid more than women, what would you conclude
after conducting this analysis?
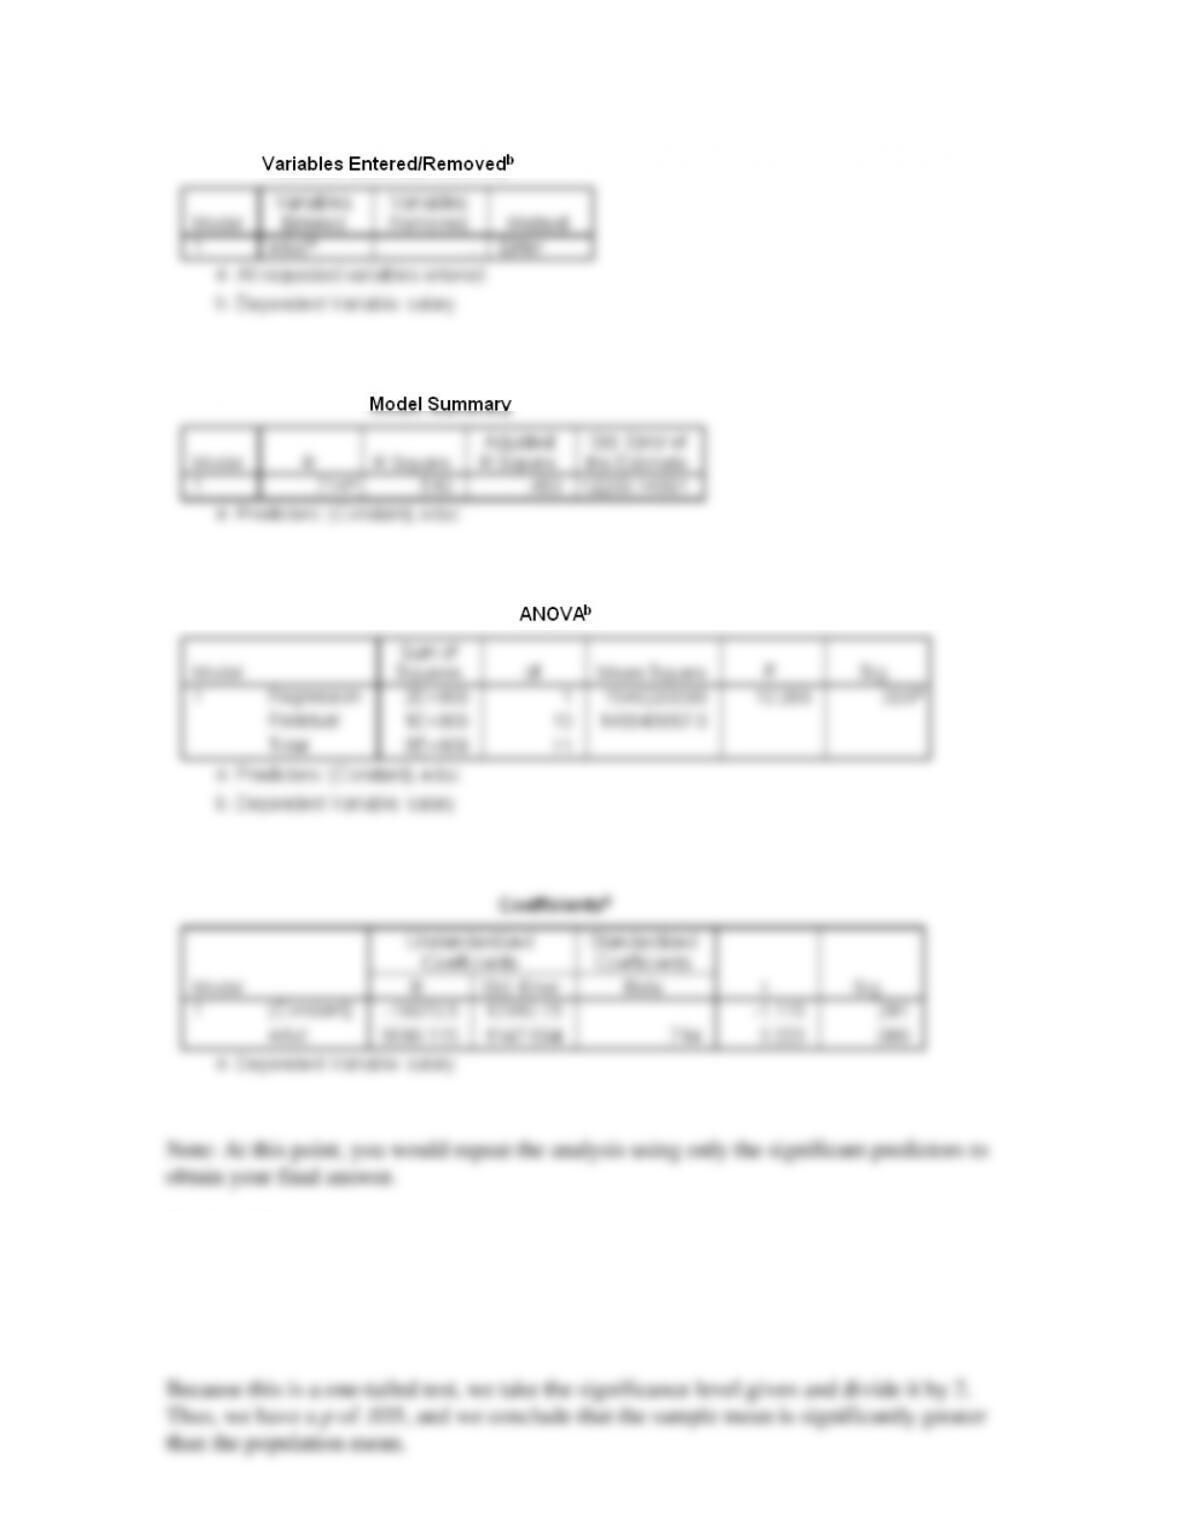
Note: At this point, you would repeat the analysis using only the significant predictors to
obtain your final answer.
Section 6.2
The mean salary in the United States is a hypothetical average of $25,000. Determine if
the average salary of the participants in Practice Data Set 2 in Appendix B is significantly
greater than this value. Note that this is a one-tailed hypothesis.