Archives: Quiz
Economics Chapter 11d 3 Suppose The GDP Equilibrium Full Employment And The MPC 80 Government
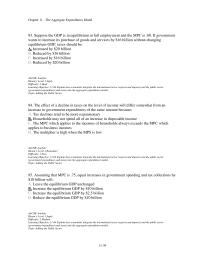
Chapter 11 – The Aggregate Expenditures Model 93. Suppose the GDP is in equilibrium at full employment and the MPC is .80. If government wants to increase its purchase of goods and services by $16 billion without changing equilibrium GDP, […]
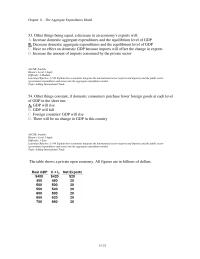
Economics Chapter 11d 2 Other Things Being Equal Decrease Economy Exports Will Increase Domestic Aggregate
Chapter 11 – The Aggregate Expenditures Model 11–21 53. Other things being equal, a decrease in an economy’s exports will: AACSB: Analytic Bloom’s: Level 3 Apply Difficulty: 2 Medium Learning Objective: 11-04 Explain how economists integrate the international sector (exports […]
Economics Chapter 11d 1 The Most Basic Assumption The Aggregate Expenditures Model That The Economy Operating
Chapter 11 – The Aggregate Expenditures Model 1. The most basic assumption of the aggregate expenditures model is that: A. The economy is operating at full employment B. There is inflation in the economy C. There is no public sector […]
Economics Chapter 10d 1 The Most Important Determinant Consumer Spending Is The Level Household Borrowing Consumer
Chapter 10 – Basic Macroeconomic Relationships 1. The most important determinant of consumer spending is: A. the level of household borrowing. B. consumer expectations. C. the stock of wealth. D. the level of income. AACSB: Analytic Bloom’s: Level 2 Understand […]
Economics Chapter 10d 3 Which Factor Explains The Variability Investment The Regularity Innovation The Durability
Chapter 10 – Basic Macroeconomic Relationships 97. Which factor explains the variability of investment? A. The regularity of innovation B. The durability of capital goods C. The constancy of expectations D. The constancy of profits AACSB: Analytic Bloom’s: Level 1 […]
Economics Chapter 10d 2 Change The Amount Saved Due Change Income Represented Shift The Entire
Chapter 10 – Basic Macroeconomic Relationships 58. A change in the amount saved due to a change in income is represented by a: A. Shift of the entire saving schedule B. Movement along the saving schedule C. Change in the […]
Economics Chapter 10d 1 Personal Saving Equal To Disposable Income Plus Consumption Consumption Minus
Chapter 10 – Basic Macroeconomic Relationships 1. Personal saving is equal to: A. Disposable income plus consumption B. Consumption minus disposable income C. Disposable income minus consumption D. Consumption times disposable income AACSB: Analytic Bloom’s: Level 1 Remember Difficulty: 1 […]
Economics Chapter 10d 4 The Multiplier Defined As MPS Change GDP Initial Change Spending
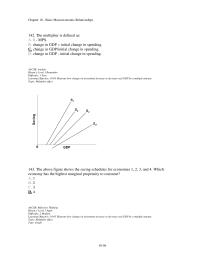
Chapter 10 – Basic Macroeconomic Relationships 142. The multiplier is defined as: A. 1 – MPS. B. change in GDP initial change in spending. C. change in GDP/initial change in spending. D. change in GDP – initial change in […]
Economics Chapter 10d 3 Given The Expected Rate Return All Possible Investment Opportunities The Economy
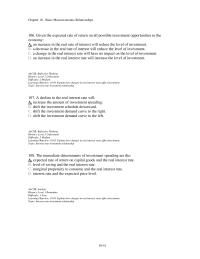
Chapter 10 – Basic Macroeconomic Relationships 106. Given the expected rate of return on all possible investment opportunities in the economy: A. an increase in the real rate of interest will reduce the level of investment. B. a decrease in […]
Economics Chapter 10d 2 Which The Following Will Not Tend Shift The Consumption Schedule Upward
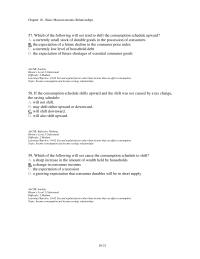
Chapter 10 – Basic Macroeconomic Relationships 57. Which of the following will not tend to shift the consumption schedule upward? A. a currently small stock of durable goods in the possession of consumers B. the expectation of a future decline […]
Economics Chapter 9d 1 The Recurrent Ups And Downs The Level Economic Activity Extending Over Several
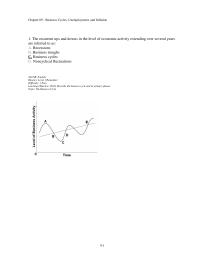
Chapter 09 – Business Cycles, Unemployment, and Inflation 1. The recurrent ups and downs in the level of economic activity extending over several years are referred to as: A. Recessions B. Business troughs C. Business cycles D. Noncyclical fluctuations 9-1 […]
Economics Chapter 9d 3 Which The Following Would Most Likely Occur During The Expansionary Phase
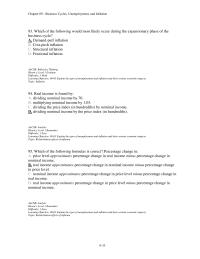
Chapter 09 – Business Cycles, Unemployment, and Inflation 93. Which of the following would most likely occur during the expansionary phase of the business cycle? A. Demand-pull inflation B. Cost-push inflation C. Structural inflation D. Frictional inflation AACSB: Reflective Thinking […]
Economics Chapter 9d 3 100 Year The Price Level Was 120 And The Average Nominal Income
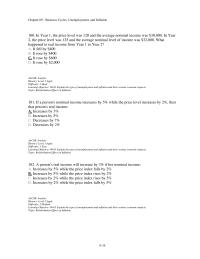
Chapter 09 – Business Cycles, Unemployment, and Inflation 100. In Year 1, the price level was 120 and the average nominal income was $30,000. In Year 2, the price level was 125 and the average nominal level of income was […]
Economics Chapter 9d 2 58 The Natural Rate Unemployment Was Percent The Current Unemployment Rate Was
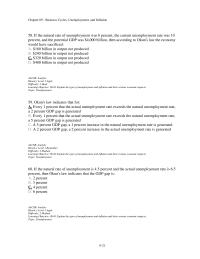
Chapter 09 – Business Cycles, Unemployment, and Inflation 58. If the natural rate of unemployment was 6 percent, the current unemployment rate was 10 percent, and the potential GDP was $4,000 billion, then according to Okun’s law the economy would […]
Economics Chapter 9d 2 58 The GDP Gap Measures The Difference Between NDP And GDP And
Chapter 09 – Business Cycles, Unemployment, and Inflation 58. The GDP gap measures the difference between: A. NDP and GDP. B. NI and PI. C. actual GDP and potential GDP. D. nominal GDP and real GDP. AACSB: Analytic Bloom’s: Level […]
Economics Chapter 9d 1 Recurring Upswings And Downswings Economy Real GDP Over Time Are Called Recessions
Chapter 09 – Business Cycles, Unemployment, and Inflation 1. Recurring upswings and downswings in an economy’s real GDP over time are called: A. recessions. B. business cycles. C. output yo-yos. D. total product oscillations. AACSB: Analytic Bloom’s: Level 1 Remember […]
Economics Chapter 8d 3 Economists Who Believe That The Recent Rise The Average Rate Productivity
Chapter 08 – Economic Growth 95. Economists who believe that the recent rise in the average rate of productivity growth will be long lasting say that: A. the United States is entering an era of high structural unemployment due to […]
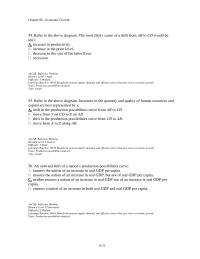
Economics Chapter 8d 2 Refer The Above Diagram The Most Likely Cause Shift From Would
Chapter 08 – Economic Growth 54. Refer to the above diagram. The most likely cause of a shift from AB to CD would be a(n): A. increase in productivity. B. increase in the price level. C. decrease in the size […]
Economics Chapter 8d 1 Economic Growth Best Defined Increase In Either Real GDP Real GDP Per
Chapter 08 – Economic Growth 1. Economic growth is best defined as an increase in: A. either real GDP or real GDP per capita. B. nominal GDP. C. total consumption expenditures. D. wealth in the economy. AACSB: Analytic Bloom’s: Level […]
Economics Chapter 8d 2 53 The Us Economic growth Experience Most Capital Substitute For Labor Most Capital
Chapter 08 – Economic Growth 53. In the U.S. economic-growth experience: A. Most capital substitute for labor B. Most capital is complementary to labor C. The amount of capital available per worker has been relatively constant D. The amount of […]
Economics Chapter 8d 1 Which The Following Measure Economic Growth That Most Useful For Measuring Political
Chapter 08 – Economic Growth 1. Which of the following is a measure of economic growth that is most useful for measuring political preeminence? A. Growth in nominal GDP B. Decreases in the rate of unemployment C. Increases in real […]
Economics Chapter 7d 1 The National Income And Product Accounts Nipa Help Economists And Policymakers To
Chapter 07 – Measuring Domestic Output and National Income 1. The National Income and Product Accounts (NIPA) help economists and policymakers to: A. determine which firms are likely to succeed or fail. B. follow the long-run course of the economy […]
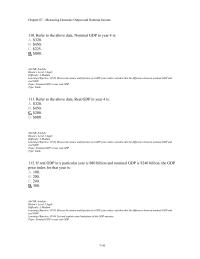
Economics Chapter 7d 3 Refer The Above Data Year The Base Year Then Real GDP
Chapter 07 – Measuring Domestic Output and National Income 7-41 104. Refer to the above data. If year 2 is the base year, then Real GDP in year 5 is: AACSB: Analytic Bloom’s: Level 3 Apply Difficulty: 3 Hard Learning […]
Economics Chapter 7d 2 Refer The Above Data United States Exports Are Billion 16 Billion
Chapter 07 – Measuring Domestic Output and National Income 55. Refer to the above data. United States exports are: A. $9 billion B. $16 billion C. $24 billion D. $28 billion AACSB: Analytic Bloom’s: Level 3 Apply Difficulty: 1 Easy […]
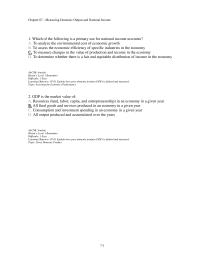
Economics Chapter 7d 1 Which The Following Primary Use For National Income Accounts Analyze The Environmental
Chapter 07 – Measuring Domestic Output and National Income 1. Which of the following is a primary use for national income accounts? A. To analyze the environmental cost of economic growth B. To assess the economic efficiency of specific industries […]
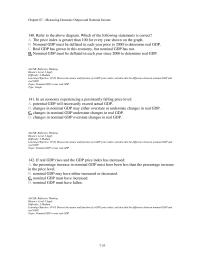
Economics Chapter 7d 4 140 Refer The Above Diagram Which The Following Statements Correct The Price
Chapter 07 – Measuring Domestic Output and National Income 140. Refer to the above diagram. Which of the following statements is correct? A. The price index is greater than 100 for every year shown on the graph. B. Nominal GDP […]
Economics Chapter 7d 3 If real disposable income fell during a particular year
Chapter 07 – Measuring Domestic Output and National Income 110. Refer to the above data. Nominal GDP in year 4 is: A. $320. B. $450. C. $225. D. $800. AACSB: Analytic Bloom’s: Level 3 Apply Difficulty: 2 Medium Learning Objective: […]
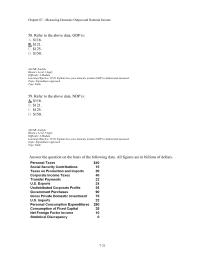
Economics Chapter 7d 2 Refer to the above data. Consumption of fixed capital is
Chapter 07 – Measuring Domestic Output and National Income 7-21 58. Refer to the above data. GDP is: AACSB: Analytic Bloom’s: Level 3 Apply Difficulty: 2 Medium Learning Objective: 07-01 Explain how gross domestic product (GDP) is defined and measured. […]
Economics Chapter 6d 2 53 Karas Kittens Typically Produces And Sells Its Optimal Lowest Perunit Cost
Chapter 06 – An Introduction to Macroeconomics 53. Kara’s Kittens typically produces and sells at its optimal (lowest per-unit cost) level of 30 scratching posts per week. Kara’s also maintains an inventory of 20 scratching posts. If prices are sticky […]
Economics Chapter 6d 1 Macroeconomics Mostly Focused On The Individual Markets Within Economy Only The Largest
Chapter 06 – An Introduction to Macroeconomics 1. Macroeconomics is mostly focused on: A. the individual markets within an economy. B. only the largest industries in the economy. C. the economy as a whole. D. why specific businesses fail. AACSB: […]
Economics Chapter 6d 2 56 Prices Are Sticky The Short Run Then The Economy Will Respond
Chapter 06 – An Introduction to Macroeconomics 56. If prices are “sticky” in the short run, then: A. The economy will respond to demand shocks primarily through changes in output and employment B. The economy will respond to demand shocks […]
Economics Chapter 6d 1 Short run Fluctuations Output And Employment Are Referred Business Cycles
Chapter 06 – An Introduction to Macroeconomics 1. Short-run fluctuations in output and employment are referred to as A. business cycles B. economic growth C. inventory cycles D. recessions AACSB: Analytic Bloom’s: Level 1 Remember Difficulty: 1 Easy Learning Objective: […]
Economics Chapter 5d 3 74 The Marginal Benefit Society Reducing Pollution Declines With Increases Pollution Abatement
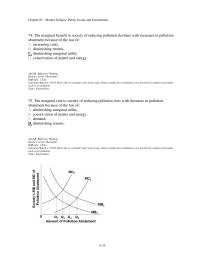
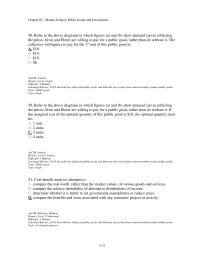
Chapter 05 – Market Failures: Public Goods and Externalities 74. The marginal benefit to society of reducing pollution declines with increases in pollution abatement because of the law of: A. increasing costs. B. diminishing returns. C. diminishing marginal utility. D. […]
Economics Chapter 5d 2 49 Refer The Above Diagrams Which Figures A And B Show Demand
Chapter 05 – Market Failures: Public Goods and Externalities 49. Refer to the above diagrams in which figures (a) and (b) show demand curves reflecting the prices Alvin and Elmer are willing to pay for a public good, rather than […]
Economics Chapter 5d 1 Market Failure Said Occur Whenever Private Markets Not Allocate Resources The Most
Chapter 05 – Market Failures: Public Goods and Externalities 1. Market failure is said to occur whenever: A. private markets do not allocate resources in the most economically desirable way. B. prices rise. C. some consumers who want a good […]
Economics Chapter 5d 2 52 The Production Product Service Involves External Benefits Then The Government Can
Chapter 05 – Market Failures: Public Goods and Externalities 52. If the production of a product or service involves external benefits, then the government can improve efficiency in the market by: A. Providing a subsidy to correct for an overallocation […]
Economics Chapter 5d 1 Which Example Market Failure There Are Not Enough Tickets Available Concerts Extremely
Chapter 05 – Market Failures: Public Goods and Externalities 1. Which is an example of a market failure? A. There are not enough tickets available to concerts of extremely popular performers B. The price of medical care has risen dramatically […]
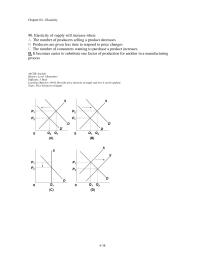
Economics Chapter 4d 3 90 Elasticity Supply Will Increase When The Number Producers Selling Product Decreases
Chapter 04 – Elasticity 90. Elasticity of supply will increase when: A. The number of producers selling a product decreases B. Producers are given less time to respond to price changes C. The number of consumers wanting to purchase a […]
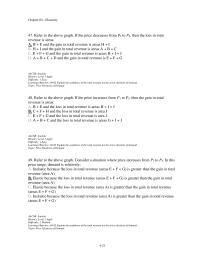
Economics Chapter 4d 2 47 Refer The Above Graph The Price Decreases From P2 Then The
Chapter 04 – Elasticity 47. Refer to the above graph. If the price decreases from P3 to P2, then the loss in total revenue is areas: A. B + E and the gain in total revenue is areas H + […]
Economics Chapter 4d 1 The Price Elasticity Demand Measure The Steepness Slope Demand Curve Absolute Changes
Chapter 04 – Elasticity 1. The price elasticity of demand is a measure of the: A. Steepness or slope of a demand curve B. Absolute changes in quantity demanded and price C. Responsiveness of quantity demanded to a change in […]
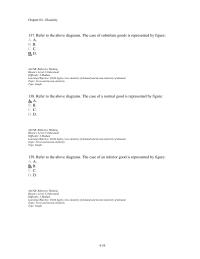
Economics Chapter 4d 4 137 Refer The Above Diagrams The Case Substitute Goods Represented Figure 138
Chapter 04 – Elasticity 137. Refer to the above diagrams. The case of substitute goods is represented by figure: A. A. B. B. C. C. D. D. AACSB: Reflective Thinking Bloom’s: Level 2 Understand Difficulty: 2 Medium Learning Objective: 04-04 […]
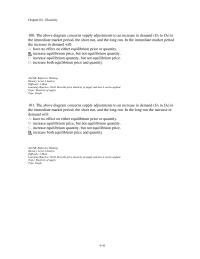
Economics Chapter 4d 3 100 The Above Diagram Concerns Supply Adjustments Increase Demand D1 D2 The
Chapter 04 – Elasticity 100. The above diagram concerns supply adjustments to an increase in demand (D1 to D2) in the immediate market period, the short run, and the long run. In the immediate market period the increase in demand […]
Economics Chapter 4d 1 The Price Elasticity Demand Coefficient Measures Buyer Responsiveness Price Changes The Extent
Chapter 04 – Elasticity 1. The price elasticity of demand coefficient measures: A. buyer responsiveness to price changes. B. the extent to which a demand curve shifts as incomes change. C. the slope of the demand curve. D. how far […]
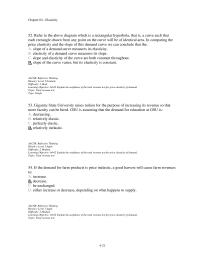
Economics Chapter 4d 2 52 Refer The Above Diagram Which Rectangular Hyperbola That Is Curve Such
Chapter 04 – Elasticity 52. Refer to the above diagram which is a rectangular hyperbola, that is, a curve such that each rectangle drawn from any point on the curve will be of identical area. In comparing the price elasticity […]
Economics Chapter 3d 3 105 The Price Pork May Increase Result Of Decrease The Cost Feed
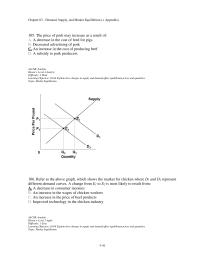
Chapter 03 – Demand, Supply, and Market Equilibrium (+ Appendix) 105. The price of pork may increase as a result of: A. A decrease in the cost of feed for pigs B. Decreased advertising of pork C. An increase in […]
Economics Chapter 3d 5 194 Price Ceiling Means That There Currently Surplus The Relevant Product Government
Chapter 03 – Demand, Supply, and Market Equilibrium (+ Appendix) 194. A price ceiling means that: A. there is currently a surplus of the relevant product. B. government is imposing a legal price that is typically below the equilibrium price. […]
Economics Chapter 3d 4 165 Which The Above Diagrams Illustrates The Effect Decline The Price Irrigation
Chapter 03 – Demand, Supply, and Market Equilibrium (+ Appendix) 165. Which of the above diagrams illustrate(s) the effect of a decline in the price of irrigation equipment on the market for corn? A. B only. B. C only. C. […]
Economics Chapter 3d 3 110 Refer The Above Diagram This Competitive Market Price And Quantity Will
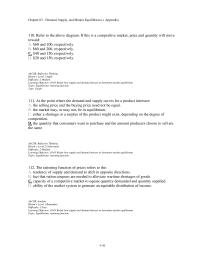
Chapter 03 – Demand, Supply, and Market Equilibrium (+ Appendix) 110. Refer to the above diagram. If this is a competitive market, price and quantity will move toward: A. $60 and 100, respectively. B. $60 and 200, respectively. C. $40 […]
Economics Chapter 3d 2 58 Increase Demand Economists Mean That Product Price Has Fallen Consumers Move
Chapter 03 – Demand, Supply, and Market Equilibrium (+ Appendix) 58. By an “increase in demand” economists mean that: A. product price has fallen so consumers move down to a new point on the demand curve. B. the quantity demanded […]
Economics Chapter 3d 1 Market Reflects Upsloping Demand And Down sloping Supply Curves Entails The Exchange Goods
Chapter 03 – Demand, Supply, and Market Equilibrium (+ Appendix) 1. A market: A. reflects upsloping demand and downsloping supply curves. B. entails the exchange of goods, but not services. C. is an institution that brings together buyers and sellers. […]