ERP application modules can be used alone or in combination.
Collaborative planning, forecasting, and replenishment (CPFR) is a useful tool
supporting supply chain integration.
Process design specifies what tasks need to be done and how they are to be coordinated
among functions, people, and organizations.
Modular design combines standardized building blocks, or modules, to create unique
finished products.
The proliferation of nation trading groups has increased tariffs and decreased duties.
The economic order quantity occurs when the annual carrying cost is equal to the
annual ordering cost.
A Gantt chart provides a visual display of the project schedule that includes scheduled
start times, finish times, and available slack.
The four primary functional areas of a firm are marketing, finance, operations, and
legal.

Aggregate planning involves the process of determining the timing and quantity of
production for an individual item over an intermediate time frame.
Mass production means doing more with fewer workers, less inventory, and less space.
If the work remaining is greater than the time remaining, the critical ratio (CR) will be
a. less than one.
b. greater than one.
c. equal to one.
d. None of these answer choices is correct.
In general, it can be said of a modern supply chain that ________ information has the
effect of ________ inventory.

a. increasing, decreasing
b. decreasing, increasing
c. increasing, increasing
d. decreasing, decreasing
Which of the following quality tools displays the relationship between two variables on
a graph
a. Process flow chart
b. Fishbone diagram
c. Histogram
d. Scatter diagram
Kallie Inc., a small parts manufacturer, has just engineered a new product for the
automotive industry. In order to produce the part the company can expand existing
facilities, acquire a competitor, or subcontract production. The company believes the
product will either experience high market demand or low market demand, with
probabilities of 0.6 and 0.4, respectively. The following payoff table describes the
company’s decision situation.
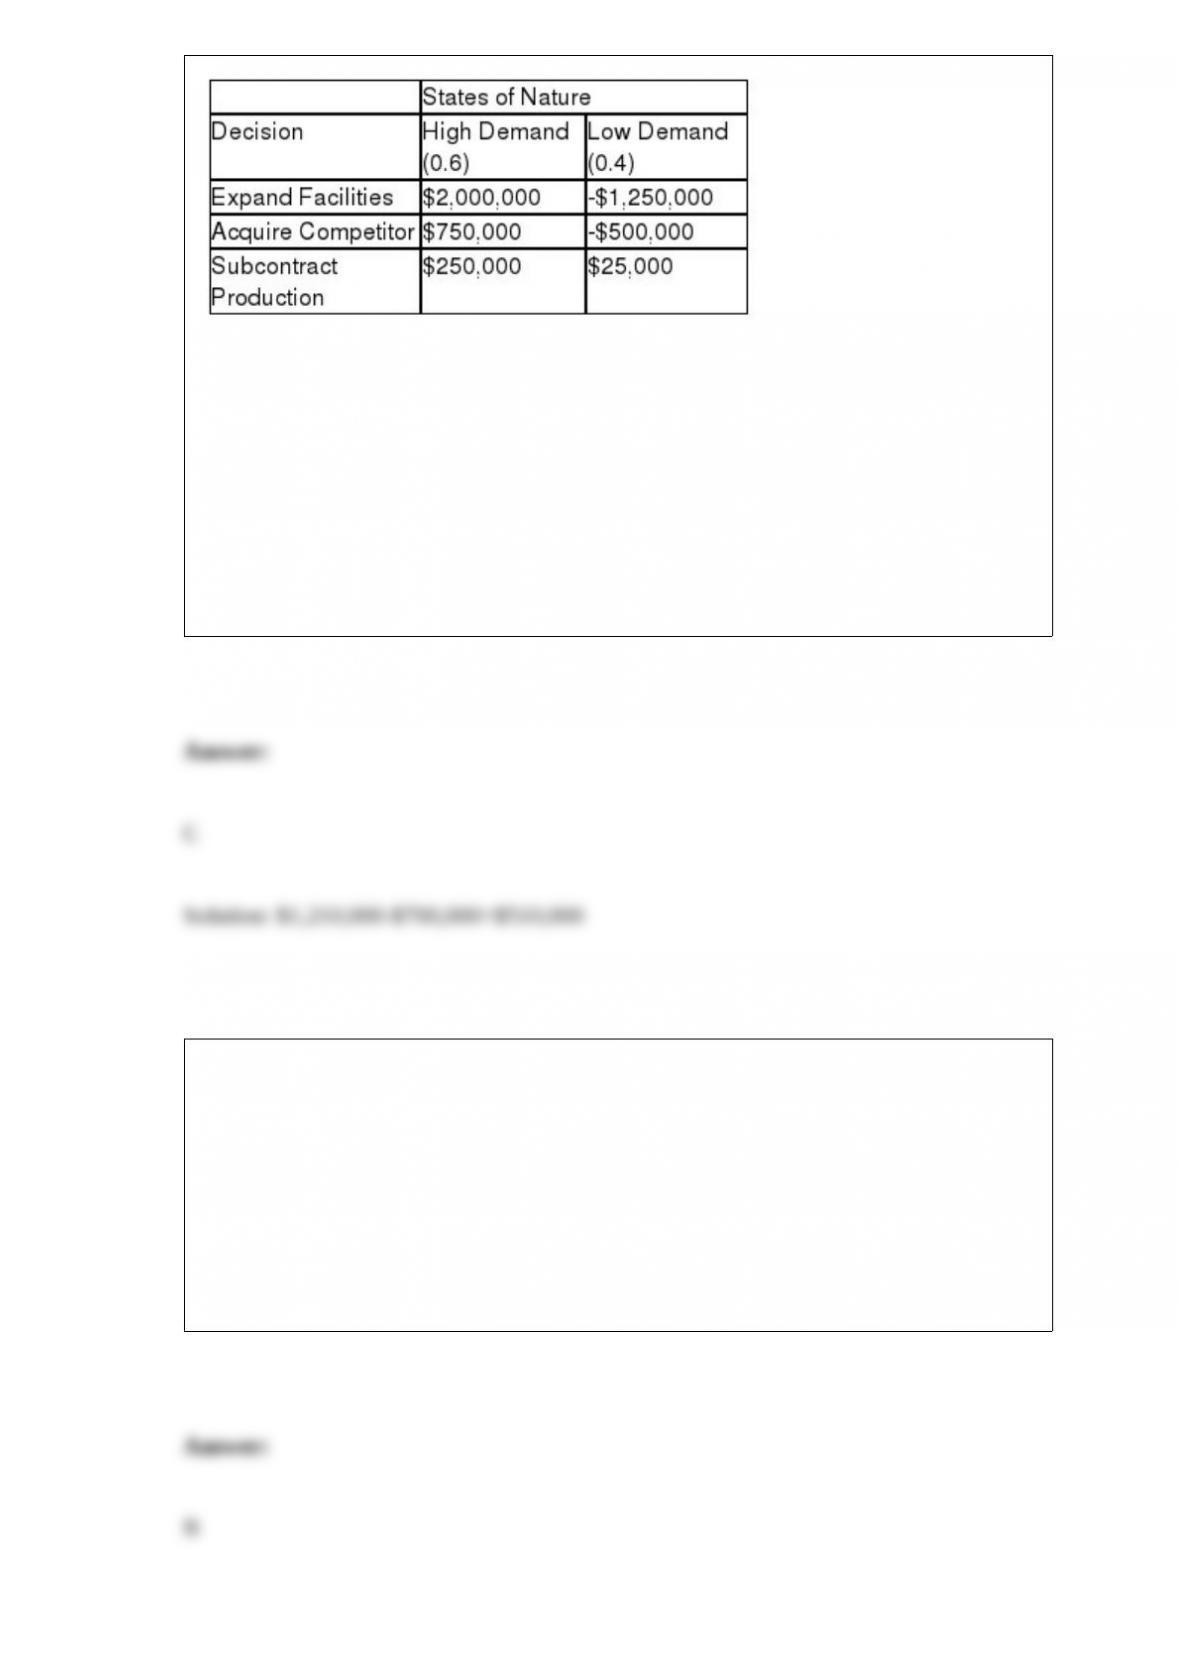
The expected value of perfect information for Kallie Inc.is
a. $1,210,000.
b. $700,000.
c. $510,000..
d. $312,500
International trade specialists include all of the following except
a. export packers.
b. finance brokers.
c. purchasing agents.
d. duty specialists.
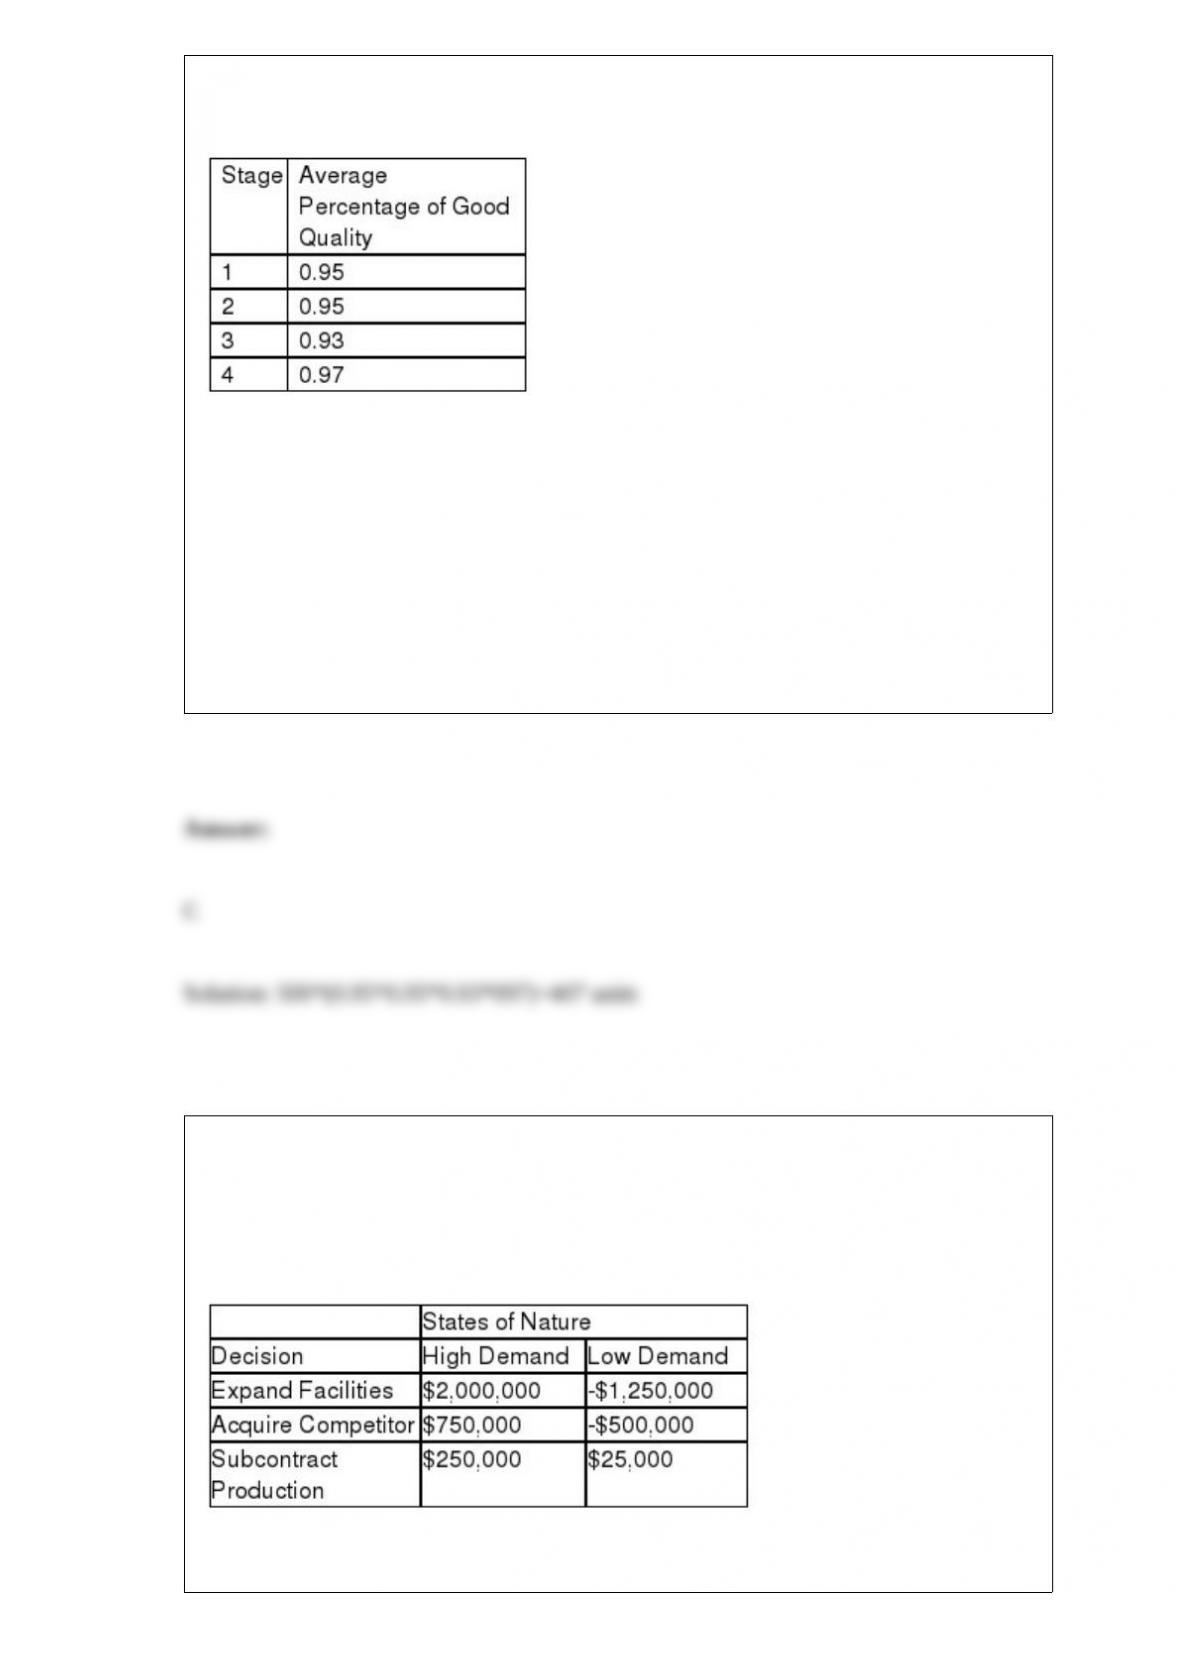
A production process consists of the following four stages with the average percentage
of good quality at each stage as shown.
What is the daily production yield for the company if daily input is 500 units?
a. 485 units
b. 465 units
c. 407 units
d. 400 units
Kallie Inc., a small parts manufacturer, has just engineered a new product for the
automotive industry. In order to produce the part the company can expand existing
facilities, acquire a competitor, or subcontract production. The company believes the
product will either experience high market demand or low market demand. The
following payoff table describes the company’s decision situation.
The value of the Hurwicz decision criterion for subcontract production when the
coefficient of optimism is 0.30 is
a. $92,500.
b. $182,500.
c. $250,000.
d. $275,000.
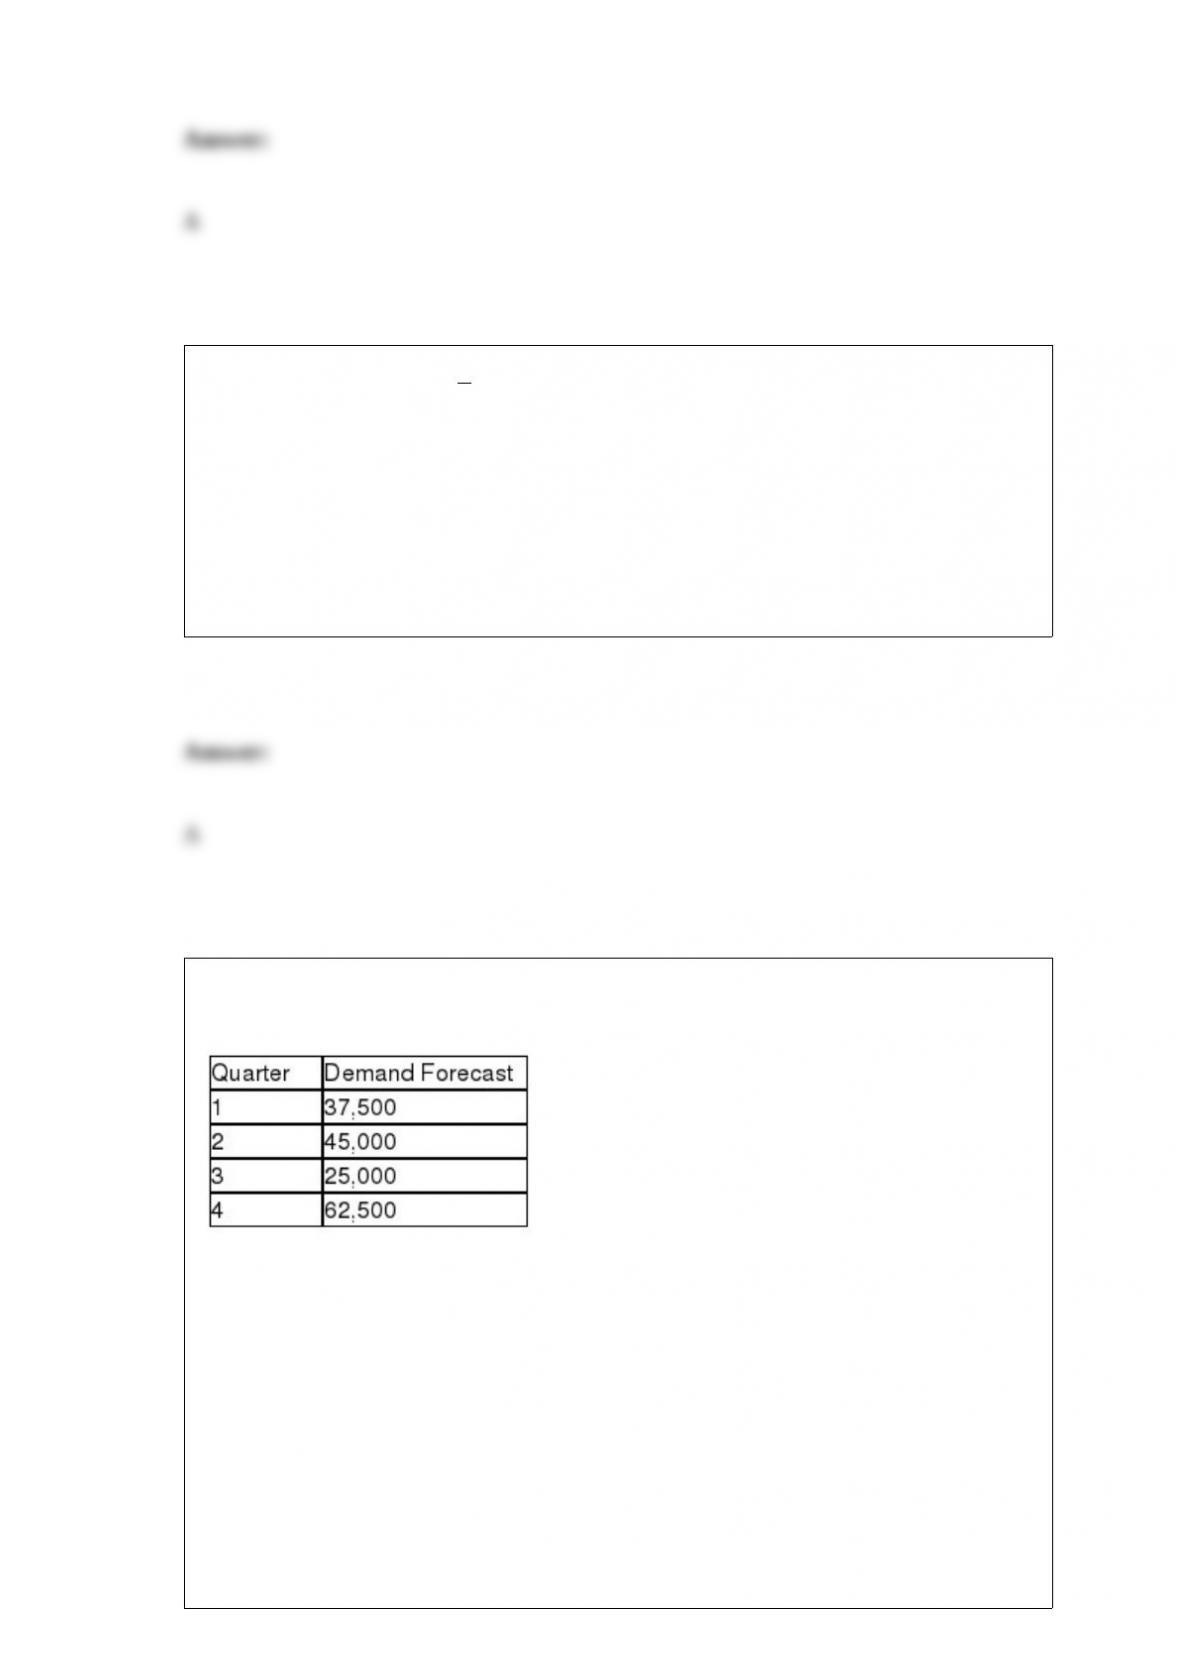
Given the information below, the number of available-to-promise units in period 6 is
a. 400
b. 150
c. 50
d. 0

Technology decisions
a. involve large sums of money.
b. definefuture capabilities.
c. set the stage for competitive interactions.
d. All of these answer choices are correct.
The material storage space required for in-process inventory is typically larger in a
a. cellular manufacturing layout.
b. product layout.
c. fixed-position layout.
d. process layout.
______________ gives employees the responsibility and authority to make decisions.
a. Cross training
b. Empowerment
c. Job rotation
d. Horizontal job enlargement

Correlation is a measure of the strength of the
a. nonlinear relationship between two dependent variables.
b. nonlinear relationship between a dependent and independent variable.
c. linear relationship between two dependent variables.
d. linear relationship between a dependent and independent variable.
If a sample point plotted on a control chart is outside the control limits
a. the evidence indicates the process is in control.
b. the evidence indicates the process is out of control.
c. the evidence is inconclusive.
d. None of these answer choices is correct.

With vendor-managed inventory,
a. distributors generate orders.
b. retailers place orders.
c. customers place orders.
d. manufacturers place orders.
Which of the following is not considered a form of inventory?
a. items being transported
b. tools and equipment
c. purchased parts and supplies
d. backorders
A periodic inventory system is also known as a
a. fixed-time period system.
b. fixed-order quantity system.
c. fixed-lead time system.
d. fixed-amount system.
For a less than or equal to (<) constraint the shadow price represents the
a. amount you would be willing to pay for one additional unit of a resource.
b. amount you at which you would be willing to sell one additional unit of a resource.
c. difference between the slack price and the surplus price.
d. difference between the surplus price and the slack price.
The following information relates to a company’s aggregate production planning
activities:
Beginning Workforce = 125 workers
Production per Employee = 500 units per quarter
Hiring Cost = $750 per worker
Firing Cost = $1,500 per worker
Inventory Carrying Cost = $10 per unit per quarter
If a level production strategy is used the total cost of the production plan (hiring cost,
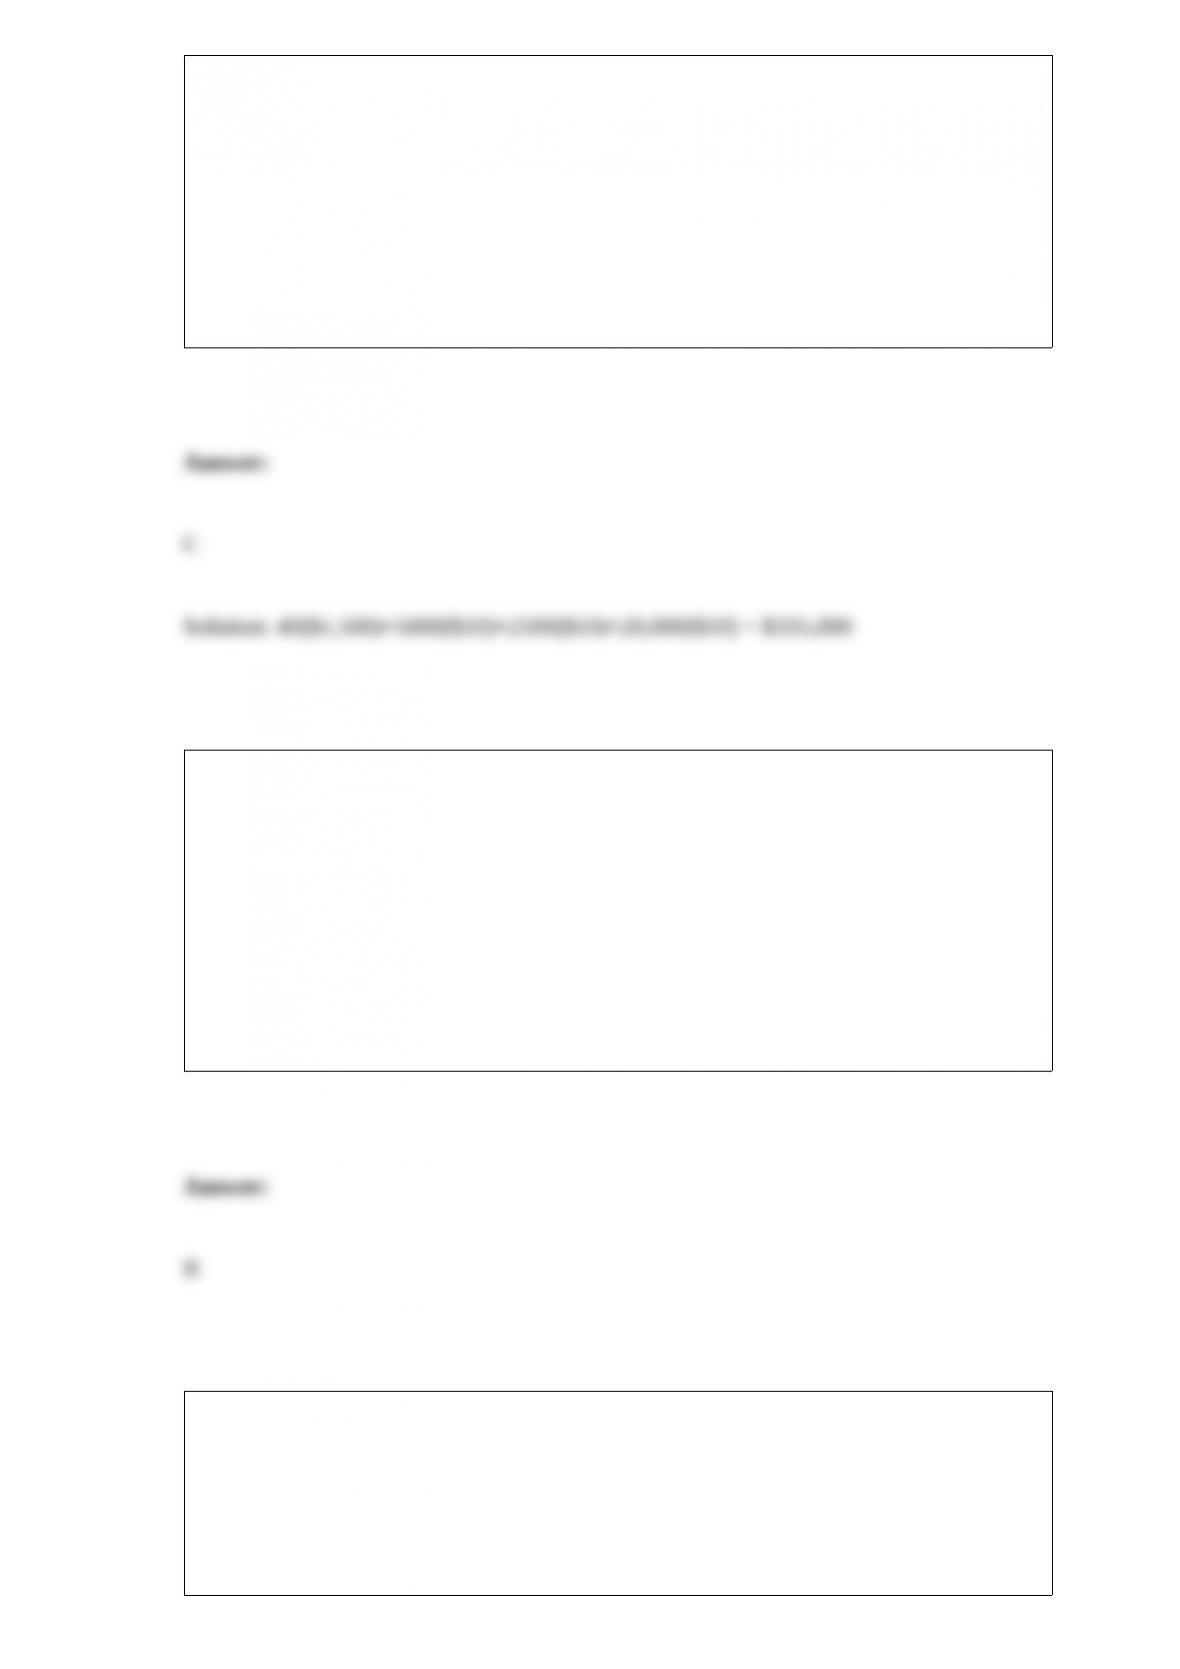
firing cost, and inventory cost) is
a. $60,000
b. $275,000
c. $335,000
d. $610,000
The number of arrivals per unit of time at a service facility can frequently be described
by a
a. normal distribution.
b. Poisson distribution.
c. binomial distribution.
d. Beta distribution.
All the following are basic tools of process analysis except
a. flowcharts.
b. diagrams.
c. maps.
d. spreadsheets.
A print shop is an example of which of the following process choices?
a. project
b. batch production
c. continuous production
d. mass production
Briefly describe how operations can be viewed as a transformation process.

What are some of the questions/inquiries one would ask regarding every material, every
part, and every operation in value analysis?
List five ways that design quality can be improved.
How does MRP differ from traditional inventory control systems?
Explain when it is better to use the continuous inventory system and when it is better to
use the periodic inventory system. Discuss how the ABC classification system provides
guidance in selecting one versus the other.
Briefly compare the storage and movement of material in a process layout and in a
product layout.