
1) In a maximization problem, when one or more of the solution variables and the profit
can be made infinitely large without violating any constraints, the linear program has
A) an infeasible solution.
B) an unbounded solution.
C) a redundant constraint.
D) alternate optimal solutions.
E) None of the above
2) At an automatic car wash, cars arrive randomly at a rate of 7 cars every 30 minutes.
The car wash takes exactly 4 minutes (this is constant). On average, what would be the
length of the line?
A) 8.171
B) 7.467
C) 6.53
D) 0.467
E) None of the above
3) The number of cell phone minutes used by high school seniors follows a normal
distribution with a mean of 500 and a standard deviation of 50. What is the probability
that a student uses more than 350 minutes?
A) 0.001
B) 0.999
C) 0.618
D) 0.382
E) None of the above
4) Table 11-1
The following represents a project with known activity times. All times are in weeks.
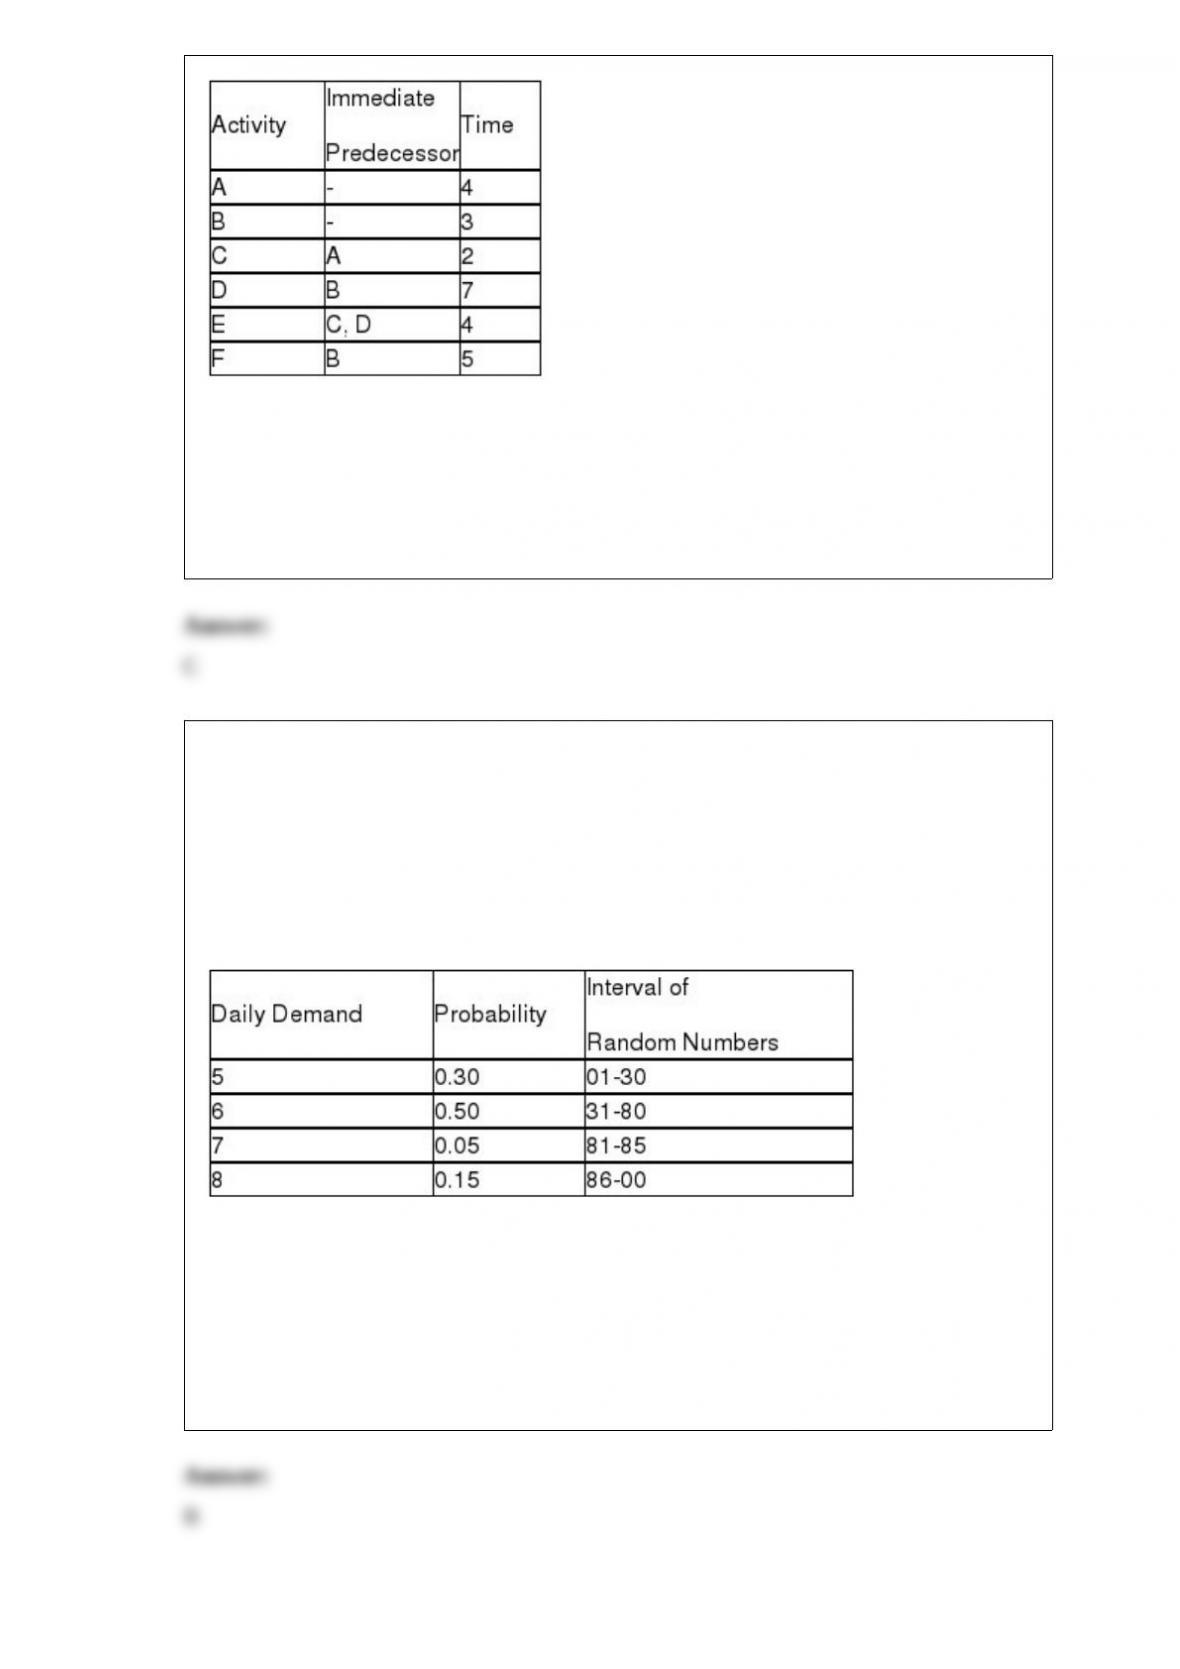
Using the data in Table 11-1, compute the latest finish time for activity E.
A) 4
B) 10
C) 14
D) 25
E) None of the above
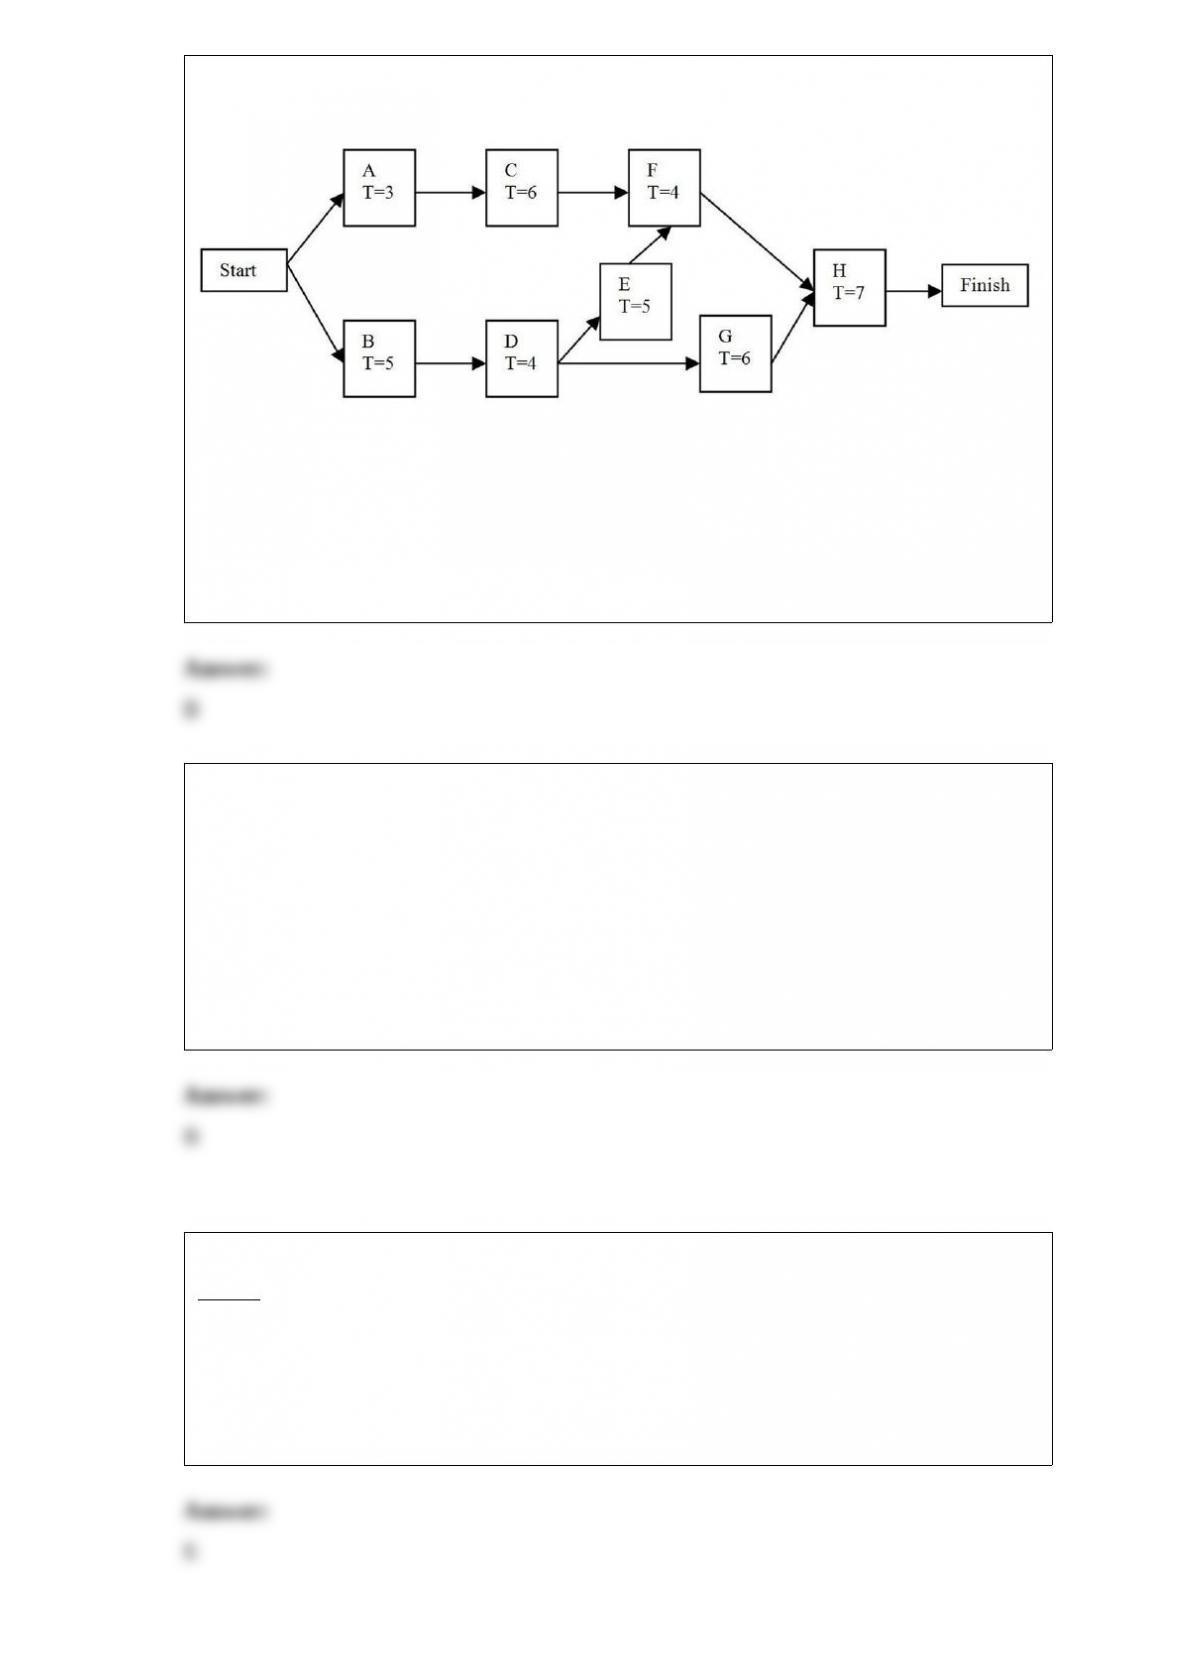
5) Table 13-2
A new young mother has opened a cloth diaper service. She is interested in simulating
the number of diapers required for a one-year-old. She hopes to use this data to show
the cost effectiveness of cloth diapers. The table below shows the number of diapers
demanded daily and the probabilities associated with each level of demand.
According to Table 13-2, if the random number 40 were generated for a particular day,
what would the simulated demand be for that day?
A) 5
B) 6
C) 7
D) 20
E) None of the above
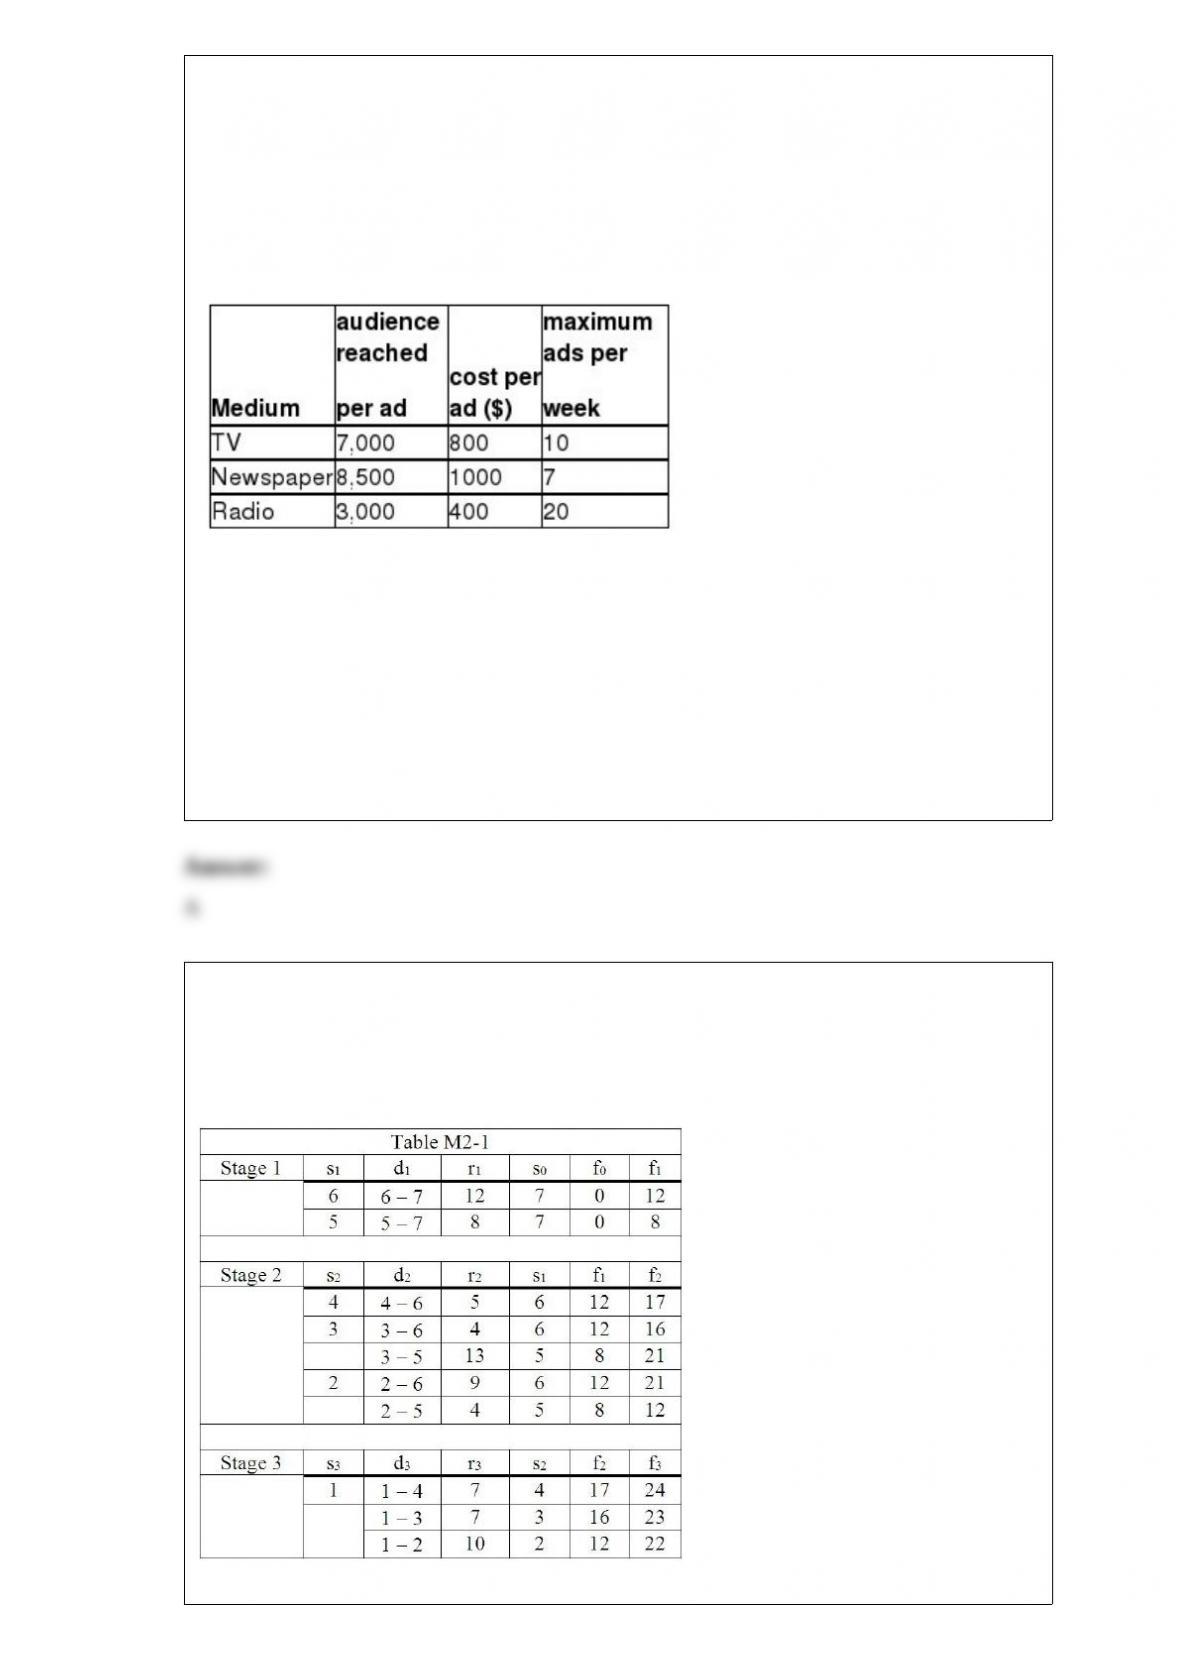
6) Figure 11-1
Given the network in Figure 11-1, the critical path is
A) A-C-F-H.
B) B-D-E-F-H.
C) A-C-E-G-H.
D) B-D-G-E-F-H.
E) None of the above
7) The primary difference between r2 and the adjusted r2 is that
A) the adjusted r2 accounts for the total number of variables in the regression model.
B) the adjusted r2 accounts for the number of independent variables in the regression
model.
C) the adjusted r2 accounts for the number of dependent variables in the regression
model.
D) the adjusted r2 accounts for multicollinearity.
E) None of the above
8) All of the following are real computer applications that perform quantitative analysis
except
A) Solver in Excel.
B) Goal Seek in Excel.
C) Excel QM.
D) POM-QM for Windows.
E) QA for Windows.
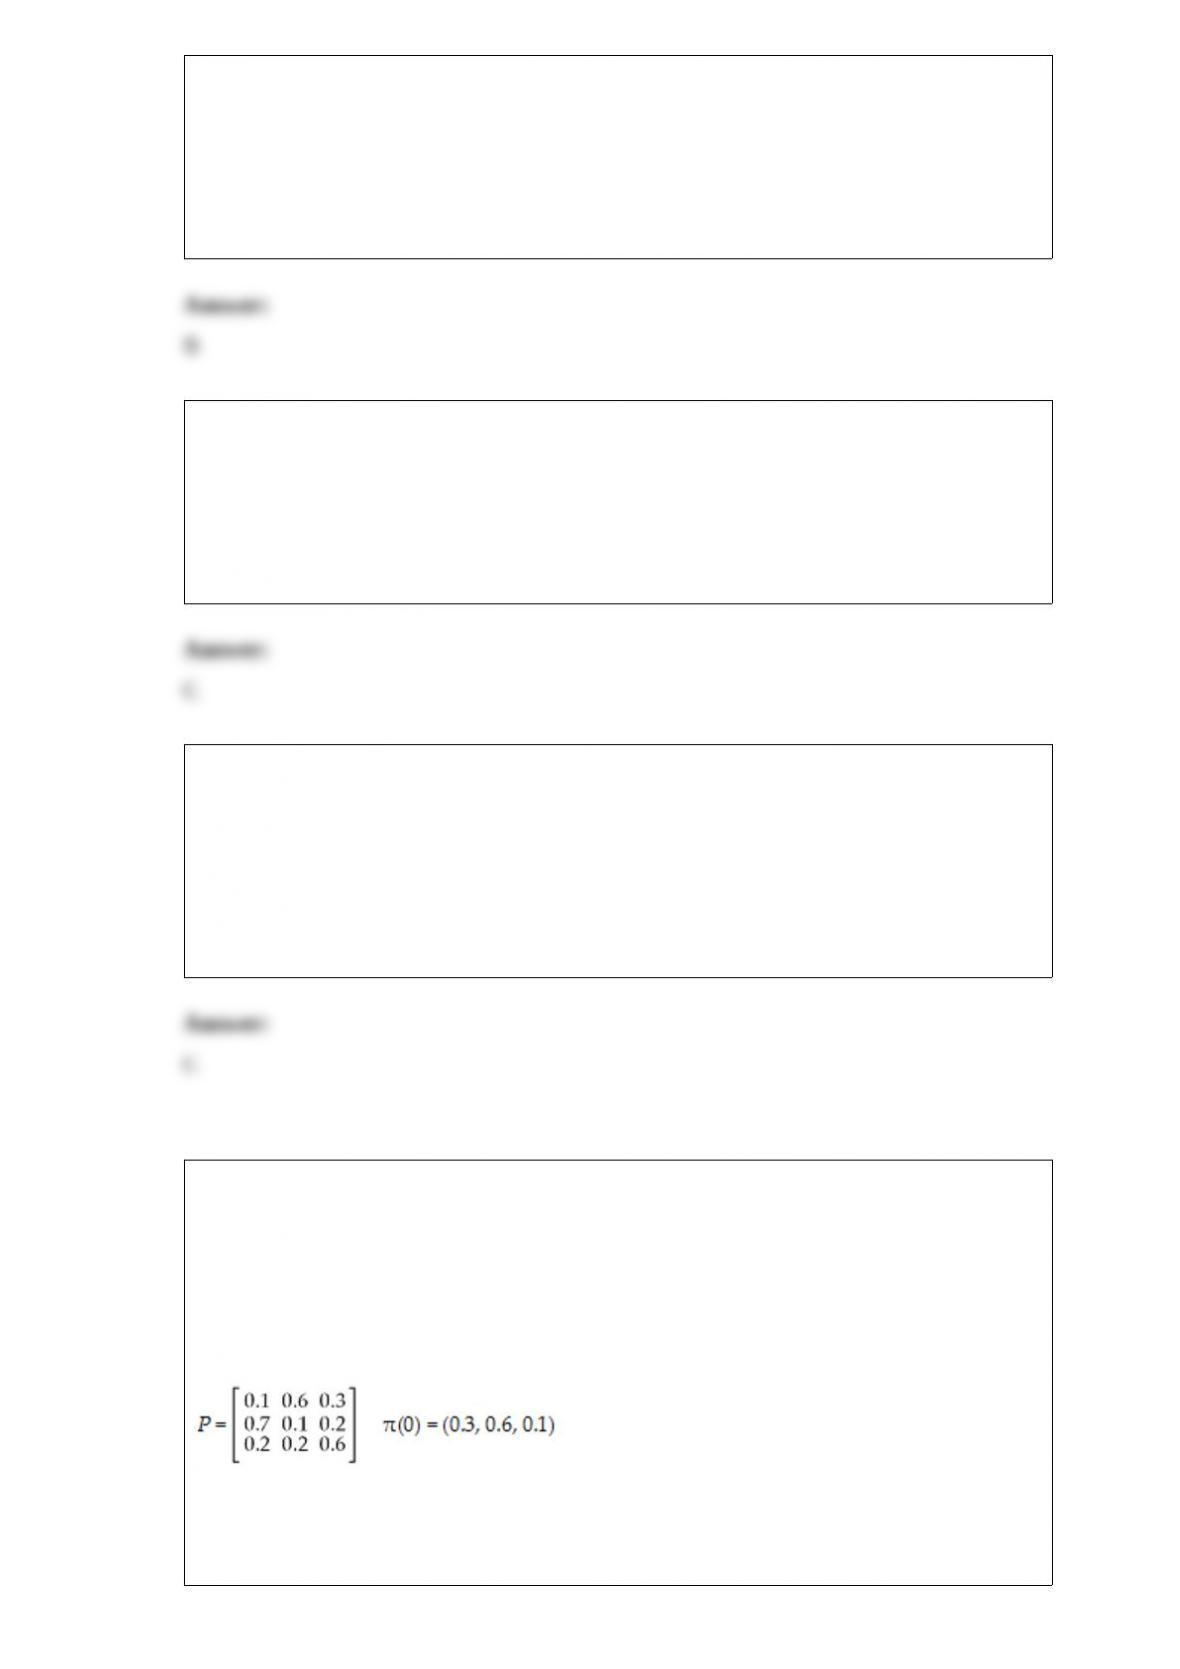
9) Table 8-2
Diamond Jeweler’s is trying to determine how to advertise in order to maximize their
exposure. Their weekly advertising budget is $10,000. They are considering three
possible media: tv, newspaper, and radio. Information regarding cost and exposure is
given in the table below:
Let T = the # of tv ads, N = the # of newspaper ads, and R = the # of radio ads
According to Table 8-2, which of the following set of inequalities properly represent the
limits on advertisements per week by media?
A) T =< 10; N =< 7; R =< 20
B) T >=10; N >=7; R >=20
C) T + R + N =< 37
D) T + R + N >=37
E) 10N + 7N + 20T =< 10,000
10) Table M2-1
The data below is a dynamic programming solution for a shortest route problem.
Using the data in Table M2-1, determine the distance of stage 2 for the optimal route.
A) 0
B) 4
C) 8
D) 12
E) 21
11) Pessimistic decision makers tend to
A) magnify favorable outcomes.
B) ignore bad outcomes.
C) discount favorable outcomes.
D) A and B
E) B and C
12) When is the exponential smoothing model equivalent to the nave forecasting
model?
A) α= 0
B) α= 0.5
C) α= 1
D) during the first period in which it is used
E) never
13) Table 14-1
The following data consists of a matrix of transition probabilities (P) of three competing
companies, and the initial market share (0). Assume that each state represents a
company (Company 1, Company 2, Company 3, respectively) and the transition
probabilities represent changes from one month to the next.
Using the data in Table 14-1, and assuming that the transition probabilities do not
change, in the long run what market share would Company 2 expect to reach?
(Rounded to two decimal places.)
A) 0.30
B) 0.32
C) 0.39
D) 0.60
E) None of the above
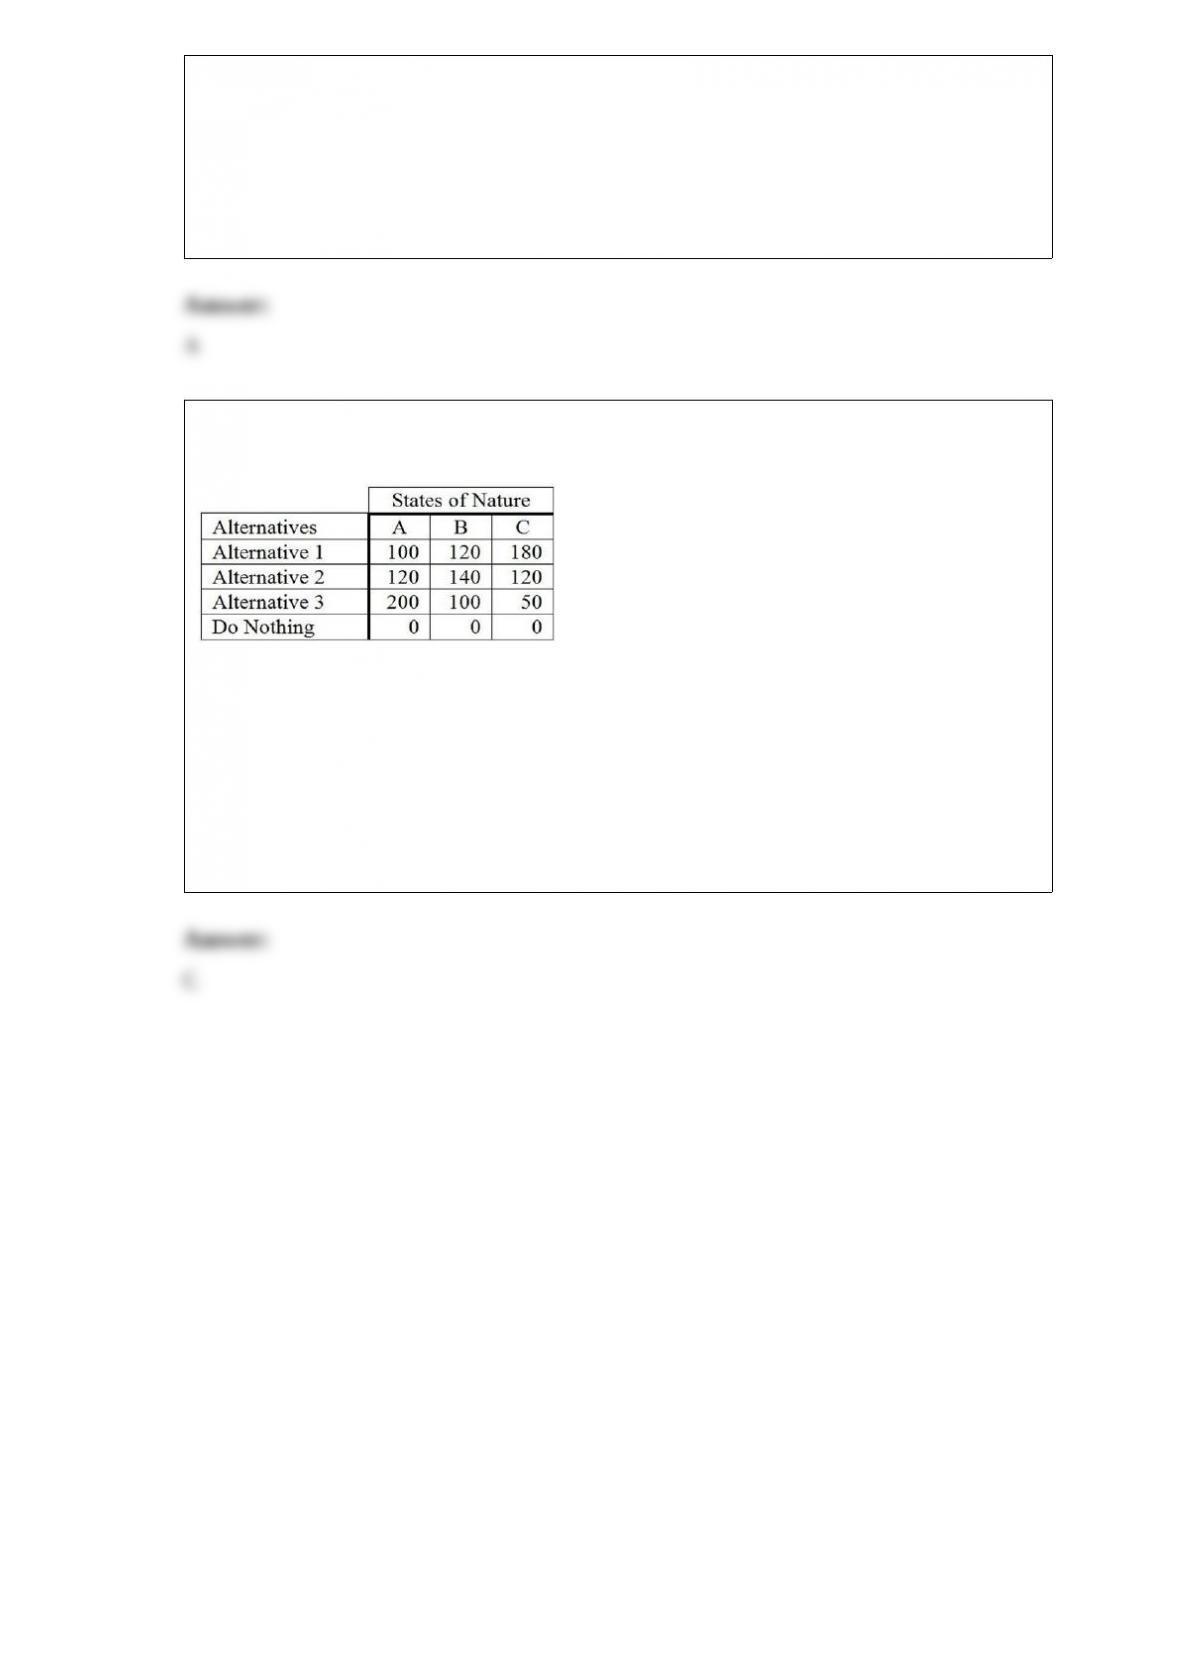
14) The following is a payoff table giving profits for various situations.
The probabilities for states of nature A, B, and C are 0.3, 0.5, and 0.2, respectively. If a
person selected Alternative 1, what would the expected profit be?
A) 120
B) 133.33
C) 126
D) 180
E) None of the above