Unlock document.
This document is partially blurred.
Unlock all pages and 1 million more documents.
Get Access
Which of the following is a measure of queue performance?
A) utilization factor
B) average queue length
C) probability of a specific number of customers in the system
D) average waiting time in the line
E) all of the above
What lot-sizing technique is generally preferred when inventory holding costs are
extremely high?
A) lot-for-lot
B) EOQ
C) part-period balancing
D) the Wagner-Whitin algorithm
E) All of the above are appropriate for the situation.
There are three work centers (A, B, and C) behind the financial aid counter at a nearby
university. They can each fit into any of three office spaces (1, 2, and 3) off the corridor
behind the desk. There is no student contact in these areas, only workers. The distance
1-2 is 20 feet, 2-3 is 30 feet, and 1-3 is 50 feet. The matrix of work (trips per day) at the
three centers is in the following table. Remember that each trip must be a round-trip
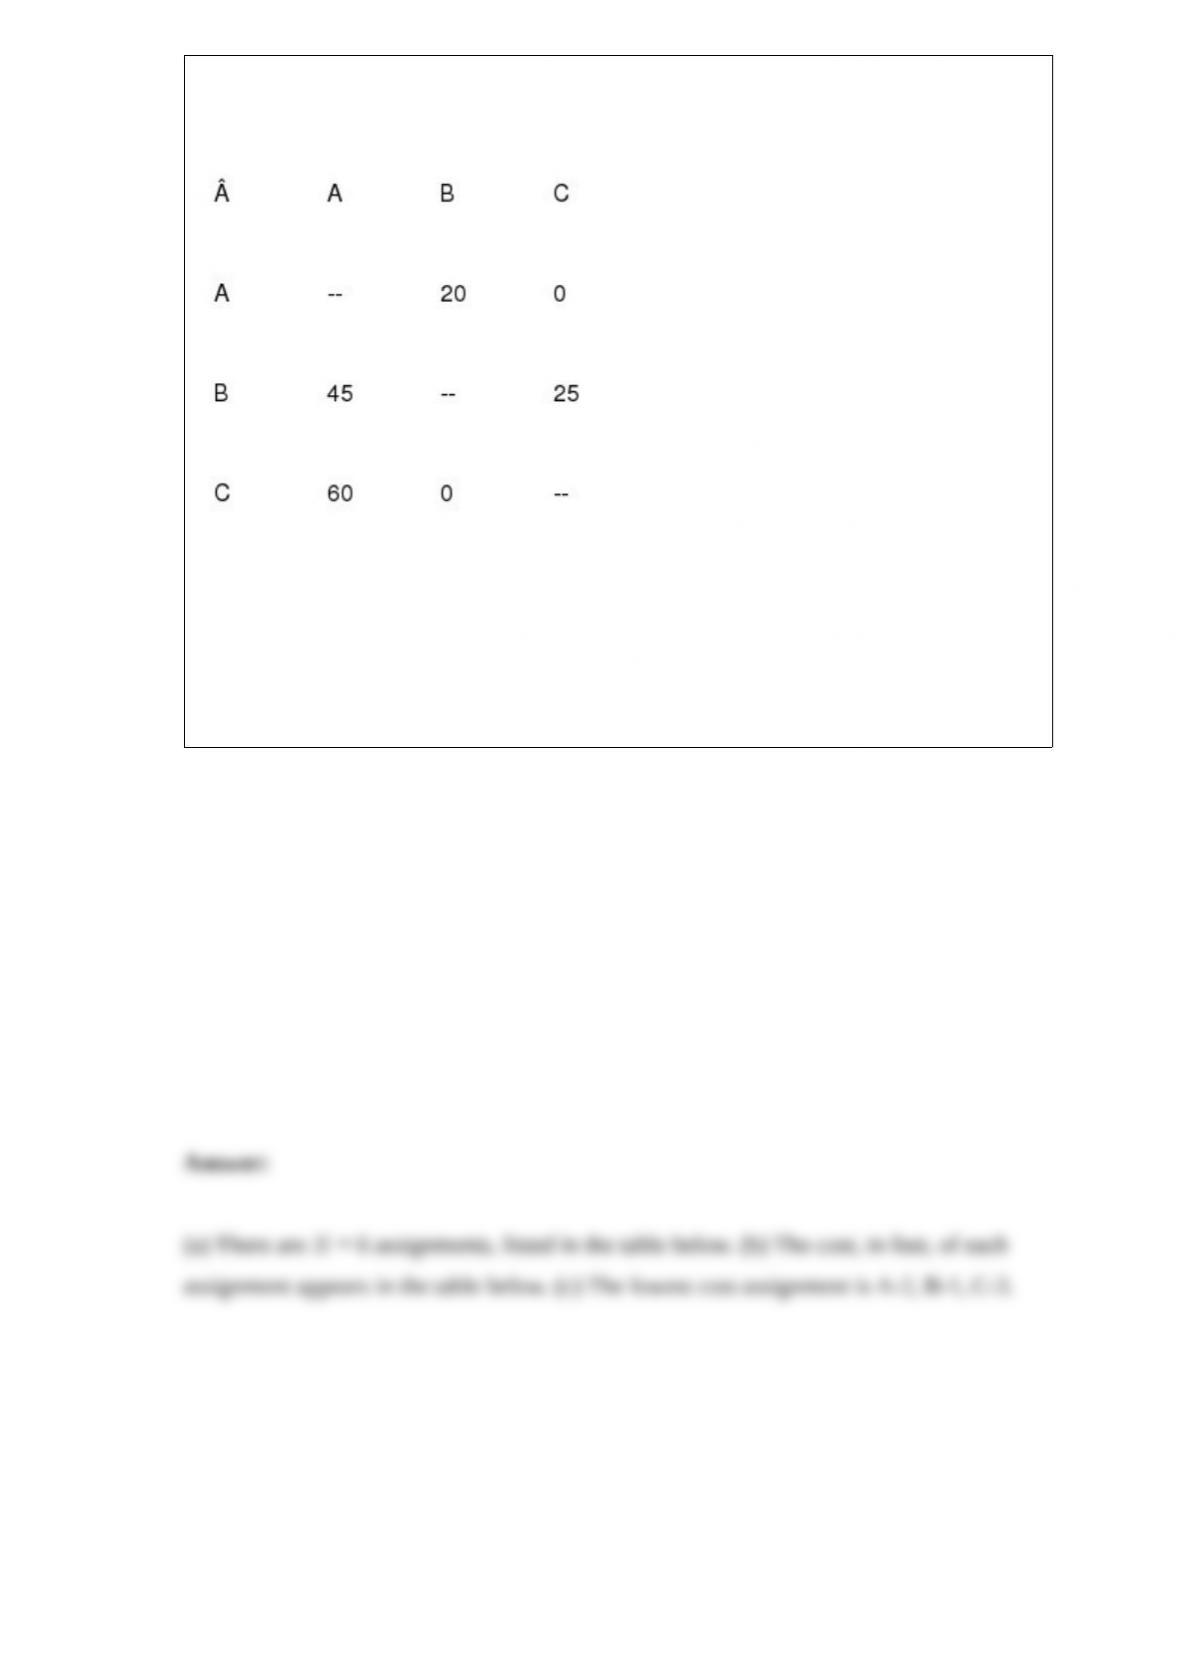
(from 1 to 2 and back, for example).
a. How many possible assignments are there? List them.
b. Calculate the total distance traveled in each of these assignments.
c. Which assignment minimizes distance traveled?
A production line is to be designed for a job with four tasks. The task times are 2.4
minutes, 1.4 minutes, 0.9 minutes, and 1.7 minutes. After line balancing, the largest
possible assigned cycle time is ________ and the smallest possible assigned cycle time
is ________ minutes.
A) 1.8; 1.4
B) 1.6; 0.9
C) 6.4; 2.4
D) 2.4; 0.9
E) none of these
A production manager at a pottery factory has noticed that about 70 percent of defects
result from impurities in raw materials, 15 percent result from human error, 10 percent
from machine malfunctions, and 5 percent from a variety of other causes. This manager
is most likely using
A) a Pareto chart
B) a scatter diagram
C) a Taguchi loss function
D) a cause-and-effect diagram
E) a flowchart
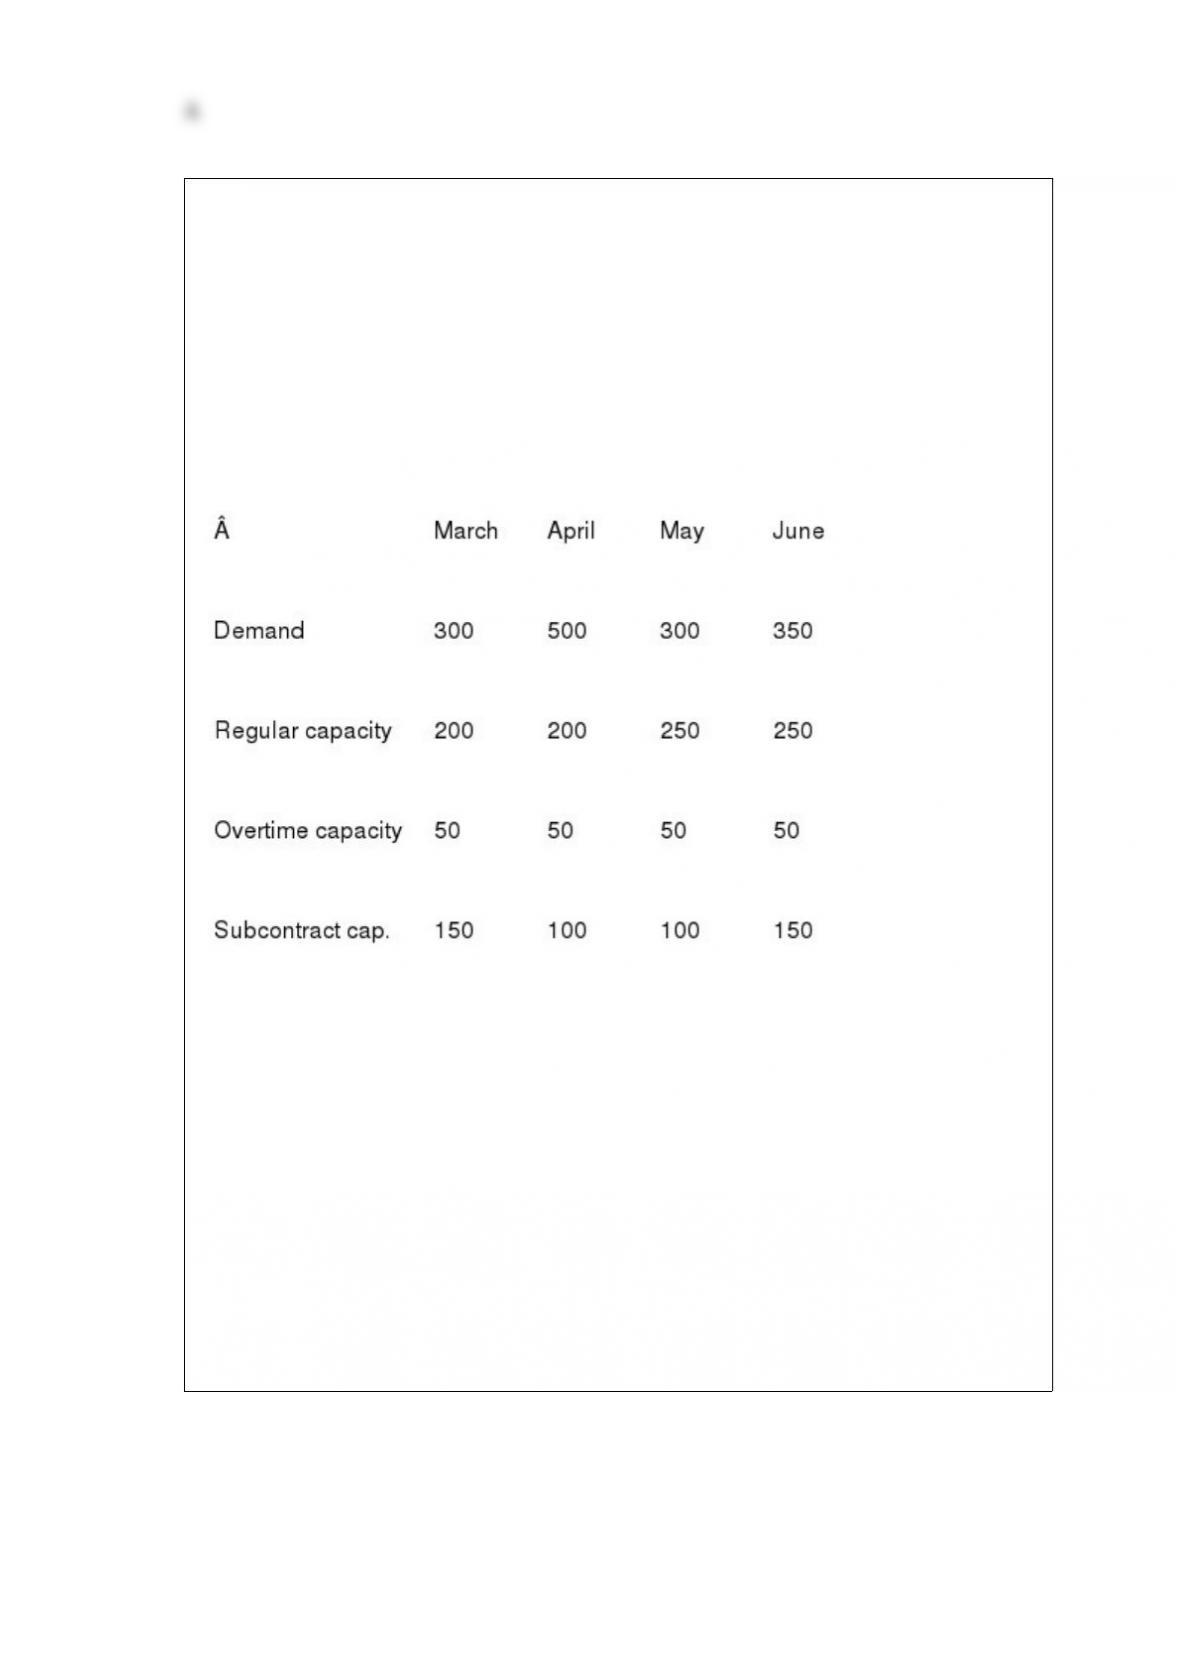
Houma Containers, Inc., makes industrial fiberglass tanks that are used on offshore oil
platforms. Demand for the next four months and capacities of the plant are shown in the
table below. Unit cost on regular time is $400. Overtime cost is 150% of regular time
cost. Subcontracting is available in substantial quantity but at a very high cost, $1100
per unit. Holding costs are $200 per tank per month; back orders cost the firm $1000
per unit per month. Houma's management believes that the transportation algorithm can
be used to optimize this scheduling problem. The firm has no beginning inventory and
anticipates no ending inventory.
a. How many units will be produced on regular time in June?
b. How many units will be produced by subcontracting over the four-month period?
c. What will be the inventory at the end of April?
d. What will be total production from all sources in April?
e. What will be the total cost of the optimum solution?
f. Does the firm utilize the expensive options of subcontracting and back ordering?
When; why?
A manager wishes to build a 3-sigma range chart for a process. The sample size is five,
the mean of sample means is 16.01, and the average range is 5.3. From Table S6.1, the
appropriate value of D3 is 0, and D4 is 2.115. The UCL and LCL for this range chart are
A) 33.9 and 11.2
B) 33.9 and 0
C) 11.2 and 0
D) 6.3 and 0
E) 31.91 and 0.11
The corner-point solution method requires
A) identifying the corner of the feasible region that has the sharpest angle
B) moving the iso-profit line to the highest level that still touches some part of the
feasible region
C) moving the iso-profit line to the lowest level that still touches some part of the
feasible region
D) finding the coordinates at each corner of the feasible solution space
E) none of the above
A learning curve
A) plots man-hours per dollar versus time
B) is mathematically described by a parabola
C) should be plotted on polar coordinate graph paper
D) is based on the premise that organizations learn from experience
E) follows a normal distribution
Which of the following companies use a mass customization approach?
A) Dell
B) Align Technology
C) Frito-Lay
D) Arnold Palmer hospital
E) A and B
For a full-time college student, which of the following moments of truth exemplifies the
customer's standard expectations?
A) Your advisor made you wait, even though you had an appointment.
B) You had to visit more than once to reach your academic advisor.
C) Your advisor was competent, helpful, and understanding.
D) Your advisor failed to keep her appointment with you.
E) Your advisor offered to work with you after regular work hours.
Concerning relationships with suppliers, which of the following combinations is critical
to the success of JIT?
A) close relationships with trust
B) close relationships with skepticism
C) distant relationships with trust
D) distant relationships with skepticism
E) none of the above
Is Starbucks Coffee a user of Geographic Information Systems? Support your answer
with examples.
What is meant by the visual workplace? Provide two examples.
PERT calculations typically include the duration variance of each activity. What is the
purpose of this calculation€what's the role of variances in PERT analysis?
__________ is a complex aggregate planning technique, using models that may be
difficult to build and for managers to understand.
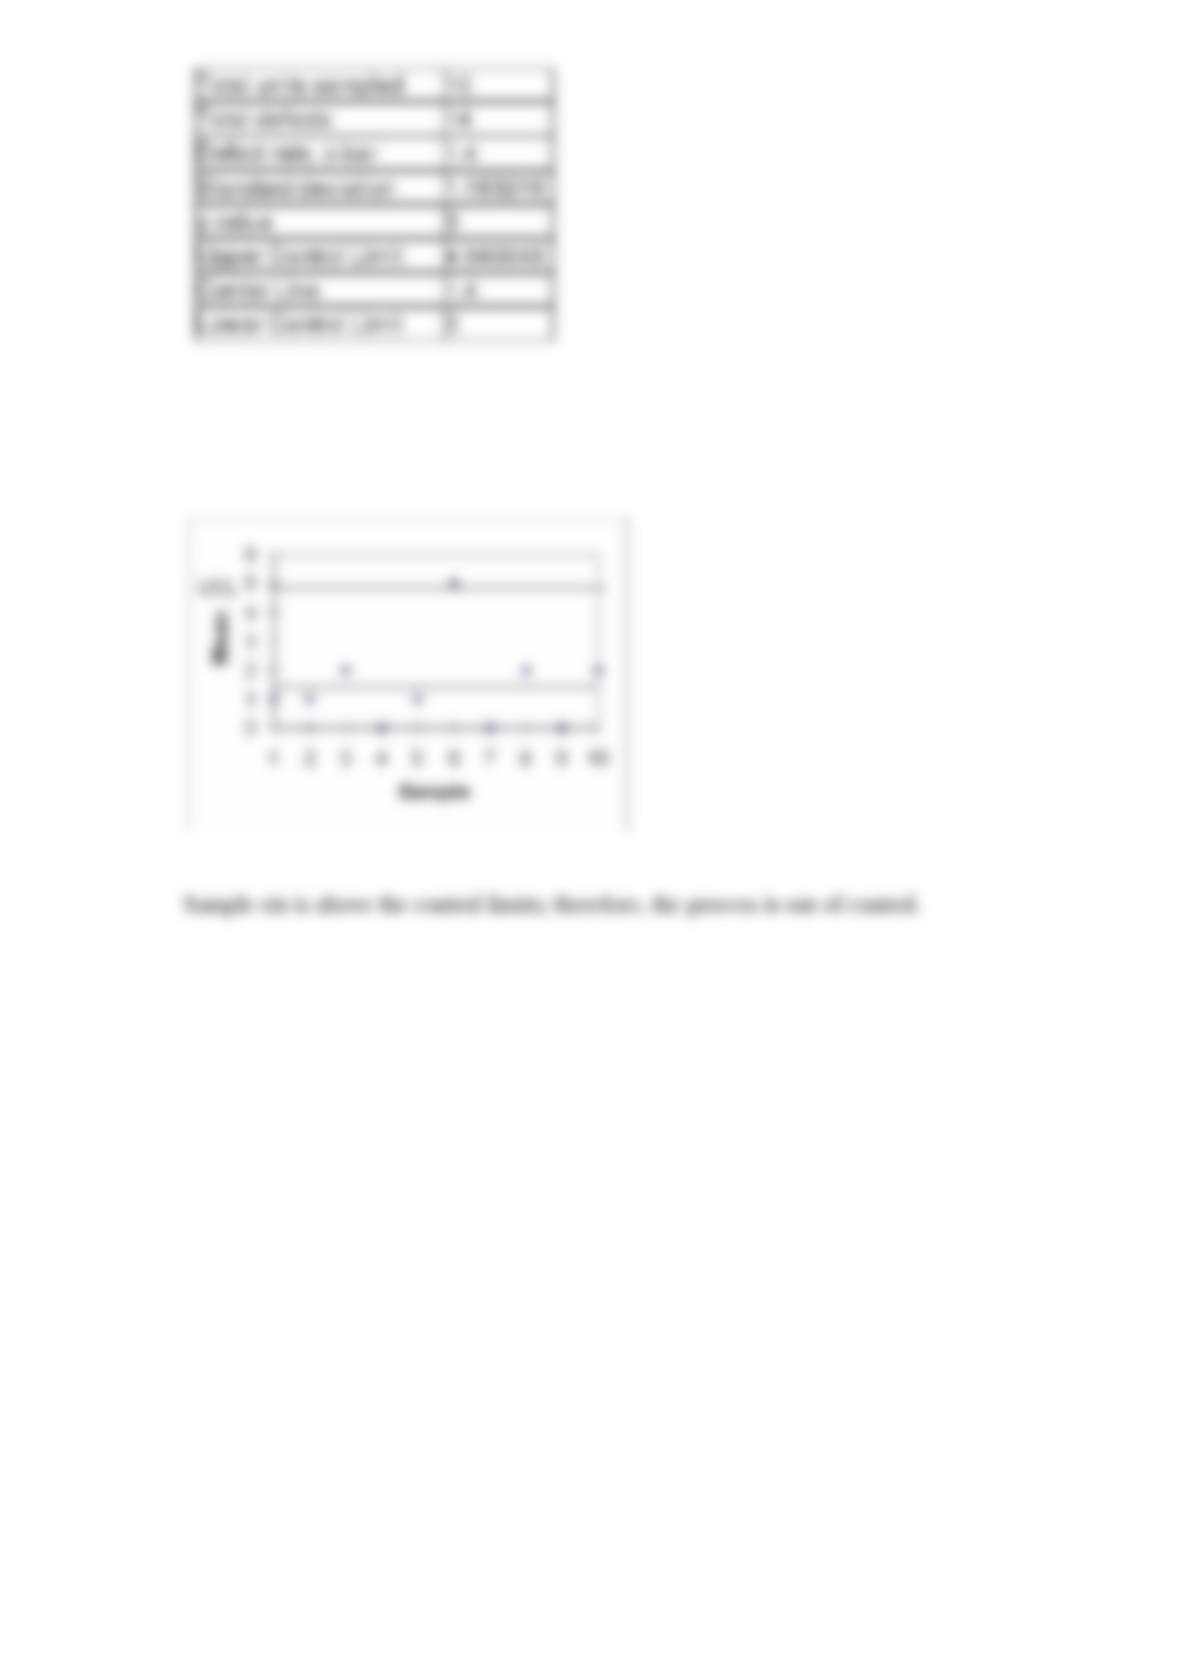
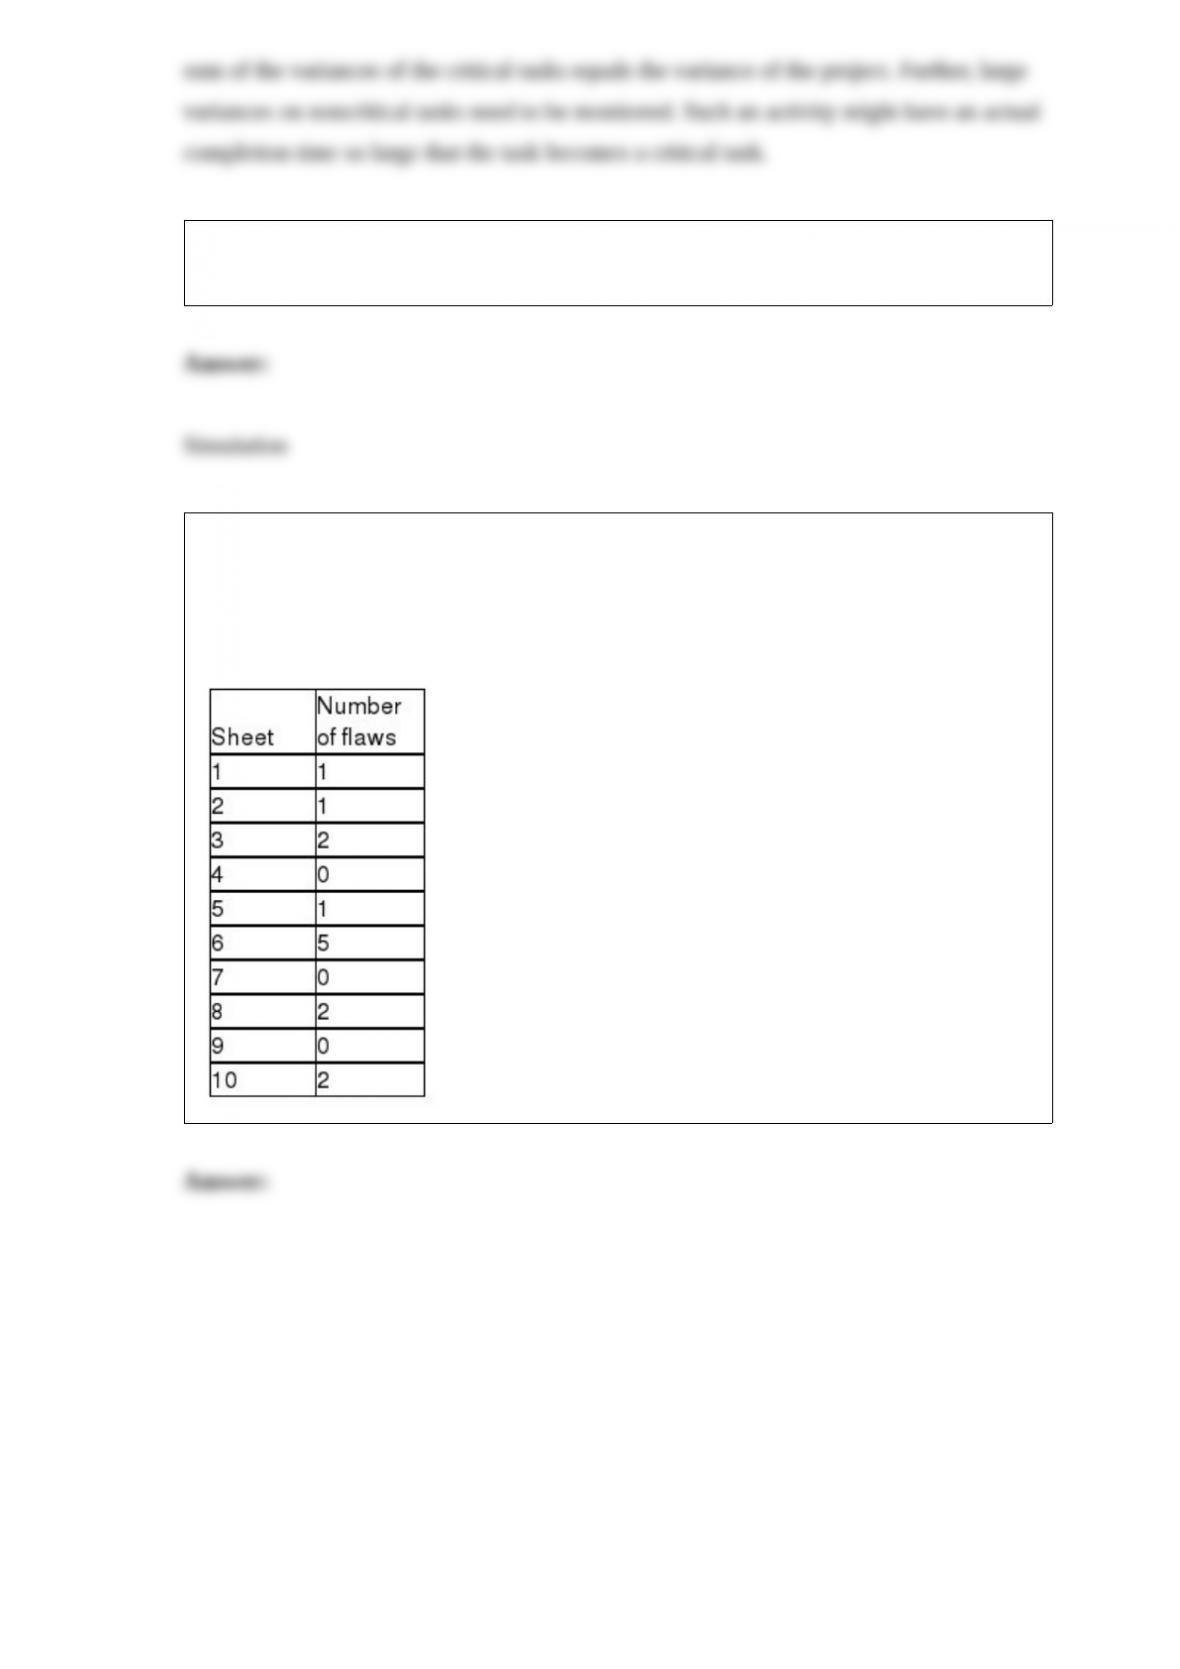
McDaniel Shipyards wants to develop control charts to assess the quality of its steel
plate. They take ten sheets of 1" steel plate and compute the number of cosmetic flaws
on each roll. Each sheet is 20' by 100'. Based on the following data, develop limits for
the control chart, plot the control chart, and determine whether the process is in control.